Demographic data
A total of 390 sheep, comprising three breeds, indigenous (n = 291), exotic (n = 75) and cross breeds (n = 24), were screened for the presence of T. lestoquardi by PCR assay of 18S rRNA (Table 1). The majority of sheep 212 (54.4%) were infested with adult ticks, and 57 (14.6 %) had elevated rectal temperatures > 40o C. An enlargement of lymph nodes was observed in 255 sheep (65.4%), either unilateral (32.6%, n = 127) or bilateral (32.8%, n = 128). In addition, pale mucus membrane was recorded in 56 animals (14.4%).
Theileria spp were detected in 75 (19.2%) of the examined animals; 8 (10.6%) carried single T. lestoquardi, 2 (2.7%) had single T. ovis and 65 (86.7%) harbored mixed species infections with T. lestoquardi and T. ovis. There was a great variation in the prevalence of Theileria spp, in the examined farms, ranging between 5.9% and 53.5%.
Table 1
Prevalence of risk factors of Theileria spp infection among sheep in Barka, Oman
Variables | Number (%) | PCR | P-value |
|---|
Positive n = 75 (19.2%) | Negative n = 315 (80.8%) |
|---|
Sex | | | | |
Male | 64 (16.4) | 18 (28.1) | 46 (71.9) | 0.05 |
Female | 326 (83.6) | 57 (17.5) | 269 (82.5) | |
Age | | | | |
Less than year | 90 ( 23.3) | 15 (16.7) | 75 (83.3) | 0.81 |
1–2 years | 134 (34.7) | 27 (20.2) | 107 (79.8) | |
More than 2 years | 162 (42) | 30 (18.5) | 132 (81.5) | |
Breed* | | | | |
Exotic | 75 (19.2) | 27 (36) | 48 (64) | 0.001 |
Cross-bred | 24 (6.2) | 1 (4.2) | 23 (95.8) | |
Indigenous | 291( 64.6) | 47 (16.2) | 244 (83.8) | |
Presence of ticks | | | | |
Yes | 178 (45.6) | 37 (20.8) | 141 (79.2) | 0.48 |
No | 212 (54.4) | 38 (17.9) | 174 (82.1) | |
Lymph node | | | | |
Normal | 135 (34.6) | 30 (22.2) | 105 (77.8) | 0.28 |
Enlarged | 255 (65.4) | 45 (17.6) | 210 (82.4) | |
Mucous membrane colour | | | | |
Normal | 334 (85.6) | 63 (18.9) | 271 (81.1) | 0.65 |
Pale | 56 (14.4) | 12 (21.4) | 44 (78.6) | |
| *Significant difference |
Clinical and hematological indices among sheep with differentTheileriaspecies
Theileria spp prevalence was not associated with age or sex of the animals across the region (p > 0.05). Similarly, no differences were observed between sheep infested with ticks and tick-free sheep, (p = 0.48) (Table 1) as well as animals with enlarged or non-enlarged lymph node (p = 0.49). However, the infection rate was significantly higher among exotic breeds (36%,27/75) (Odds ratio 12.9, CI) compared to indigenous (16.2%, 47/291) and cross breeds (4.2%, 1/24) (Odd ratio 2.9 CI 1.66–5.14) (Table 1).
Hematological indices including hematocrit, RBC counts, Hb, MCV, MCHC, WBC, eosinophils and lymphocytes were not correlated with detection of Theileria infection (p > 0.05) (Table 2). Nonetheless, compared to animals with mixed infections (T. lestoquardi plus T. ovis), sheep with single T. lestoquardi infections showed a trend of exhibiting lower total WBCs (8.22 + 2.6 vs 9.89 + 3.05, p > 0.05), lymphocytes (3.79 ± 1.24 vs 4.47 + 1.4), monocytes (0.69 ± 0.19 vs 0.81 ± 0.28), eosinophils (0.93 ± 0.68 vs 1.37 ± 0.94) and neutrophils (2.88 ± 1.1 vs 3.25 ± 1.35, p > 0.05). However, all counts were within our normal clinical reference ranges (Table 2).
Table 2
Hematological indices among sheep (n = 75) infected with different types of Theileria species and un-infected sheep (n = 310)
Blood indices | Expected range | T. lestoquardi (n = 8 [%]) Mean ± SD | Mixed infection (n = 63 [%]) Mean ± SD | Un-infected (n = 310 [%]) Mean ± SD | P value |
|---|
RBC | (9–15) × 106 /µL | 10.49 ± 1.70 | 9.71 ± 1.33 | 9.93 ± 1.70 | 0.187 |
HCT | (27–45) % | 31.69 ± 4.12 | 29.74 ± 4.30 | 29.66 ± 4.72 | 0.268 |
Hb | (9–15) g/dL | 10.89 ± 1.47 | 10.19 ± 1.42 | 10.28 ± 1.79 | 0.209 |
WBC | (4–8) × 103µL | 8.22 ± 2.61 | 9.89 ± 3.05 | 10.15 ± 3.26 | 0.439 |
Lymphocyte | (2–9) × 103µL | 3.79 ± 1.24 | 4.47 ± 1.42 | 4.40 ± 1.47 | 0.535 |
Monocytes | (0–0.75) × 103µL | 0.69 ± 0.19 | 0.81 ± 0.28 | 0.80 ± 0.28 | 0.499 |
Neutrophils | (0.7–6.0) × 103µL | 2.88 ± 1.10 | 3.25 ± 1.35 | 3.56 ± 1.74 | 0.350 |
Eosinophils | (0–1.0)× 103µL | 0.93 ± 0.68 | 1.37 ± 0.94 | 1.38 ± 1.01 | 0.465 |
Platelets | (800–1100) ×103µL | 388.71 ± 189.09 | 338 ± 152.81 | 372.86 ± 169.91 | 0.300 |
Parasite Density And Clinical And Hematological Indices
Total T. lestoquardi density among infected sheep, as judged by results of the PCR assay on blood samples, varied widely, between 1.03 and 5.99 log1018s rRNA copies/µl. The estimated mean density in single T. lestoquardi infection was higher (4.77 log1018s rRNA copies/µl blood, 95% CI 4.5–5.1 log10) than mixed infection (4.2 log1018s rRNA copies/µl blood, 95% CI 3.9–3.5 log10), but this difference was not significant (p = 0.12). Similarly, T. ovis density among the infected sheep varied widely, between 1.06 and 5.30 log10 18s rRNA copies/µl (mean = 4.03). Single T. ovis, detected in only two samples, had a higher average density of 4.3 log1018s rRNA copies/µl blood (95% CI 3.21–5.37 log10), than the mean density of T. ovis among mixed infection (4.02, log1018s rRNA copies/µl, 95% CI 3.84–4.22 log10).
In mixed infections, T. lestoquardi was present at a slightly higher density (4.2 log1018s rRNA copies/µl blood, 95% CI 3.9–4.5 log10) than T. ovis (4.02 log1018s rRNA copies/µl blood, 95% CI 3.8–4.2 log10) (p = 0.184). Nonetheless, there was a highly significant association between the densities of the two species in mixed infection in individual animals (p < 0.0001).
Density of both T. lestoquardi and T. ovis was not associated with gender (p > 0.25), breed (p > 0.47), presence of ticks (p > 0.25) or enlargement of lymph nodes (p > 0.45). Moreover, T. lestoquardi, when present as a single infection, had no significant effect on any of the examined hematological indices (p > 0.05).
Genetic diversity and structure ofT. lestoquardi
Seventy-three T. lestoquardi isolates, from Barka were successfully genotyped for ten species-specific microsatellites. Eight carried T. lestoquardi but not T. ovis and 65 harbored mixed species (T. lestoquardi plus T. ovis).
The total number of alleles detected for each of the T. lestoquardi loci ranged from 5 for TL_MS25 to 22 for TL_MS280, and the number of alleles per locus within a single sample ranged from 1 to 6. A high-level of polymorphism was observed among six loci (TL_MS205, TL_MS281, TL_MS280, TL_MS07, TL_MS13 and TL_MS19) while a moderate level of diversity was observed for a further 4 loci (TL_MS04, TL_MS16, TL_MS18 and TL_MS25) (Table 3). The average heterozygosity among single T. lestoquardi infections was significantly lower (He = 0.685), ranging from 0.00 to 0.893, than that in mixed (T. lestoquardi/T. ovis) infections (He = 0.76), ranging from 0.590 to 0.933 (p = 0.0001).
Table 3
Allelic diversity and unbiased heterozygosity (He) at 10 micro- and mini-satellite loci among 73 T. lestoquardi isolates collected in Barka in 2019 and 190 isolates examined in 2014 in different regions in Oman
Population | TL_ MS05 | TL_ MS281 | TL_ MS04 | TL_ MS07 | TL_ MS13 | TL_ MS16 | TL_ MS19 | TL_ MS280 | TL_ MS25 | TL_ MS18 | Average |
|---|
2019 (n = 73) | 0.861 | 0.737 | 0.673 | 0.857 | 0.925 | 0.594 | 0.831 | 0.893 | 0.579 | 0.662 | 0.772 |
2014 (n = 190) | 0.867 | 0.839 | 0.359 | 0.705 | 0.796 | 0.441 | 0.665 | 0.760 | 0.121 | 0.548 | 0.582 |
Multiplicity Of Infection
Seventy-two (98.7 %) of the above 73 T. lestoquardi samples carried multiple parasite genotypes. The high prevalence of genotype multiplicity in Barka (98.7 %) is consistent with that seen in other sites, in 2014 (96 %), in Oman. The extent of multiplicity, the number of genotypes per sample, was slightly lower among single T. lestoquardi infection, ranging between 2 and 5, mean 3.4 (SD ± 0.92), compared to mixed (T. lestoquardi/T. ovis) infection, ranging between 1 to 6, mean 3.59 (SD ± 1.04).
Linkage Disequilibrium
LD was estimated using the standard index of association to investigate whether the high diversity observed in T. lestoquardi in Barka could be explained by a panmictic population structure and high rates of recombination in the tick vector. When all samples collected in all farms were treated as a single population, an ISA value of (0.027) and a VD value (2.06) greater than L (1.97) was obtained, indicating LD.
Population Sub-structuring
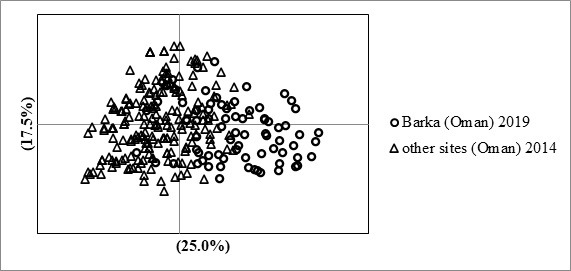
FST values (G′ST and θ) were estimated to measure the level of genetic relatedness of T. lestoquardi in Barka in 2019 compared to a previous dataset from parasites isolated in different sites in Oman in 2014, employing the same panel of markers [6].
No differentiation was observed between the T. lestoquardi population samples collected in different sites in Oman in 2014 (G′ST = 0.024 and θ = 0.024). However, a moderate level of differentiation (G′ST = 0.096 and θ = 0.04) was observed between parasite populations in Oman in 2014 and Barka in 2019. The estimated differentiation is supported by Principal Coordinate Analysis (PCoA) (Fig. 2). PCoA demonstrated evidence of structuring, with some haplotypes distributed independent of year of collection. Haplotypes from 2014 and 2019 are overlapped, however, a few lineages from 2019 diverge from the rest of individuals.