Heterostructured TiO2/Co nanoparticles/N-doped carbon nanotubes (TiO2/Co/NCNTs) nanomaterial had been derived from ZIF-67@TiO2 by calcination at high temperature in an Ar/H2 atmosphere. The obtained TiO2/Co/NCNTs composites was made up of numerous dodecahedron-like boxes with twisting nanotubes on surfaces, modified on glassy carbon electrode (GCE) for the electrochemical determination of tert-butylhydroquinone (TBHQ). The excellent electrocatalytic performance for TBHQ could be owing to the combination of multi-phase composition, fast electron transfer and the constructed Co/Ti multi-active sites. TiO2/Co/NCNTs sensor held broad linearity from 0.04 to 100 µM with a low detection limit of 4 nM, and possessed stability, anti-interfering ability and reproducibility. Finally, the analytical utility of the TiO2/Co/NCNTs sensor was checked by detecting TBHQ in the edible oil.
Research Article
Electrochemical determination of tert-butylhydroquinone by ZIF- 67@TiO 2 derived hierarchical TiO 2 /Co/NCNTs
https://doi.org/10.21203/rs.3.rs-2785661/v1
This work is licensed under a CC BY 4.0 License
Version 1
posted
You are reading this latest preprint version
TiO2
N-doped carbon nanotubes
Co nanoparticles
tert-butylhydroquinone
sensor
Tert-butylhydroquinone (TBHQ) is an important synthetic phenolic antioxidant to prevent oxidative degradation and rancidity of oils, thus plays a significant role in the food safety (Yue et al. 2019; Li et al. 2015). Nevertheless, excessive addition of TBHQ leads to an upsurge in toxicological and mutagenic effects on animals and humans (Medeiros et al. 2010). Accordingly, TBHQ is banned in Japan and the European union (Ye et al. 2018). According to the regulations of the U. S. Food and Drug Administration (U.S. FDA) and national standards of China (GB2760-2011), the maximum limit of TBHQ is 200 mg/kg in oil and other food commodities (Ng et al. 2017). Thus, it is vital to develop a sensitive and selective analytical method to the determination of TBHQ in food samples to ensure food safety and human health.
Currently, several traditional methods, including gas chromatography-mass spectrometry (GC-MS) (Cacho et al. 2016), cloud point extraction and reverse-phase high-performance liquid chromatography (HPLC) (Liu et al. 2018), capillary chromatography electrophoresis (CE) (Delgado-Zamarreno et al. 2007), ultraviolet visible spectrophotometry (UV–vis) (Ammawath et al. 2004), have been reported for monitoring TBHQ. The above methods usually have some disadvantages of time-consuming, expensive apparatus and high requirements. In contrast, the electrochemical technique has been proven to be favorable for TBHQ fast detection due to its exceptional accuracy, convenient portability and easy miniaturization (Wang et al. 2017; Kokulnathan et al. 2021; Wang et al. 2023; Tang et al. 2022). However, the weak electrochemical signal at the bare glassy carbon electrode (GCE) for TBHQ detection is still challenging. Consequently, various nanomaterials to form modified electrode plays a key role in amplifying the electrochemical signal of the sensor toward TBHQ (Priscillal and Wang, 2022).
Among a series of nanomaterials, transition metal and nitrogen-doped carbon nanotubes composites (M/NCNTs) have the merit of high electrocatalytic activity and excellent stability because of the stable carbonaceous structure and numerous metal–nitrogen–carbon active sites (Wang et al. 2018; Meng et al. 2023). Generally, metal–organic frameworks (MOFs) have emerged as the new platform to achieve favorable M/NCNTs electrocatalysts with numerous active sites and stable micromesoporous structures (Liu et al. 2008; Wang et al. 2013). Co-based zeolitic imidazolate framework material (ZIF-67) with the high N content of imidazole is considered to be promising sacrificial templates to prepare N-doped carbon-based materials with high electrocatalytic performance (Zanon and Verpoort, 2017). MOFs with the regular crystal structure always possess large surface area and adjustable pores structure, which is a good candidate for electron transfer (Zhao et al. 2016; Xu et al. 2018). As previously reported, some studies report the promising strategy on enhancing the electrochemical activity of N-doped ordered carbon nanotubes with magnetic cobalt nanoparticles composites, which prepared by thermal pyrolysis of N-rich ZIF-67 (Xia et al. 2016; Tang et al. 2021).
In addition, among the modifiers being used for electrochemical sensors, nanometric transition-metal oxides (Fe3O4, TiO2 etc.) have received increasing attention because of their electrocatalytic properties, good electrical conductivity and large surface area (Mashhadizadeh and Afshar, 2013; Lotfi et al. 2019; Tammari et al. 2017). TiO2 is broadly considered in functional materials of electrode modification owing to its superior physical and chemical properties, favorable conduction band edge, high stability and facile electron transfer (Mahadik et al. 2017; Lotfi et al. 2021; Zhang et al. 2020). Consequently, a high surface area nanocomposite of TiO2 and M/NCNTs electrocatalysts being fabricated over modified electrode is hoped to demonstrate enhanced electrocatalytic performance and improved sensor sensitivity towards TBHQ detection.
In this contribution, a nanostructured electrocatalyst (TiO2/Co/NCNTs) with TiO2 and cobalt nanoparticles (Co NPs) anchored in N-doped carbon nanotubes (NCNTs) is fabricated via the hydrolysis of TBOT on ZIF-67 surface and the subsequent pyrolysis under an Ar/H2 atmosphere (Scheme 1), which not only retains the uniform dodecahedron morphology of ZIF-67 framework but also forms the component-tunable hierarchical structure with Ti elements at the head of NCNTs and Co at the center of the dodecahedron. The obtained TiO2/Co/NCNTs composites were modified on the bare GCE and showed the excellent electrochemical performance of TBHQ, which can be attribute to the enhanced surface area, shortened electron/ion transport pathways, improved conductivity and abundant active sites.
2.1. Reagents
Co(NO3)2·6H2O (≥98.5%), tetrabutyl titanate (TBOT, ≥98.5%), 2-Methylimidazole (2-MeIm, ≥98.5%), tertbutyl-hydroquinone (TBHQ, ≥99%), butylated hydroxyanisole (BHA, ≥99%) and other chemicals were obtained from Aladdin Industrial Co. Ltd. (China).
2.2. Apparatus
The morphology of ZIF-67@TiO2 and TiO2/Co/NCNTs composites were examined by scanning electron microscopy (SEM, Hitachi SU8020, Japan) and transmission electron microscopy (TEM, JEOL JEM-2010, Japan). The crystal phase of prepared samples was verified via powder X-ray diffraction (XRD, Bruker D8, Germany). X-ray photoelectron spectroscopy (XPS) data were carried out at a K-Alpha spectrometer (Thermo Fisher Scientific Inc., UK). The surface area of Brunauer-Emmett-Teller (BET) was measured on a gas sorption analyzer (NOVATouch LX2, Quantachrome, USA). The electrochemical experiments were obtained on a CHI 660E electrochemical workstation (Shanghai, China) with a conventional electrode cell, in which the bare or modified GCE (diameter 3 mm) was the work electrode, a counter electrode was served as a platinum wire and a reference electrode was a saturated calomel electrode (SCE, China).
2.3. Synthesis of ZIF-67@TiO2 and TiO2/Co/NCNTs
In a typical synthesis (Tang et al. 2018), 2.63 g of Co(NO3)2·6H2O was dissolved in 100 mL of methanol and 6.37 g of 2-MeIm was dissolved in 150 mL of methanol. The above two solutions were mixed together under magnetic stirring for 24 h at the RT. The purple precipitate was centrifuged (8000 rpm), washed 3 times with methanol and then dried at 60 ℃ for 12 h to obtain ZIF-67.
The obtained ZIF-67 was dispersed into the mixture solution of 100 mL of ethanol and 300 µL of ammonia. 1.5 mL of TBOT dispersed in 20 mL of ethanol added dropwise into the above ZIF-67 solution under the condition of water bath heating (45 ℃) and stirring. Afterwards, the solution was filtered and washed with ethanol for several times, then placed in an oven at 60°C for drying. The samples were donated as ZIF-67@TiO2. At the end, under an Ar/H2 flow (95:5 in volume ratio), the ZIF-67@TiO2 precursor was pre-pyrolyzed at 350°C for 1 h and the heating rate was 5°C/min, then increased to 800°C for 1 h to obtain TiO2/Co/NCNTs product.
2.4. Preparation of the TiO2/Co/NCNTs modified electrode
Carefully polished the bare GCE (diameter of 3.0 mm) on a chamois with alumina power (0.05 µm) and completely washed by dilute nitric acid, ethanol and ultra-pure water. 4 µL of TiO2/Co/NCNTs suspension in DMF (1.0 mg·mL− 1) was dropped on the polished electrode surface and dried in RT. The prepared electrode was denoted as TiO2/Co/NCNTs/GCE. ZIF-67@TiO2/GCE was also fabricated for comparison.
3.1. Characterization of TiO2/Co/NCNTs, ZIF-67@TiO2 composites
Morphological features of TiO2/Co/NCNTs and ZIF-67@TiO2 have been well characterized by scanning electron microscopy (SEM) and transmission electron microscopy (TEM) in Fig. 1. As shown in Fig. 1a and b, the SEM and TEM images exhibit the rough surface of dodecahedral shapes with the average size of 500 nm after hydrolysis process, displaying the coating of TiO2 via TBOT hydrolyzes on the surface of rhombic dodecahedral ZIF-67. Figure 1c and d shows the morphology of TiO2/Co/NCNTs by carbonization of ZIF-67@TiO2 precursor at 800°C. SEM image (Fig. 1c) exhibits the structure shrinkage and inner-invaginated surface of polyhedral compared to ZIF-67@TiO2 owing to the pyrolysis of organic ligand. TEM (Fig. 1d) of TiO2/Co/NCNTs dodecahedron reveals that Co nanoparticles (black dots) are uniformly embedded in the carbon framework (gray matrix). Notably, a typical in-situ growth of N-doped CNTs with adjustable size were found wrapped the polyhedra.
Figure 2 display the high-resolution transmission electron microscope (HRTEM) images. The NCNTs were distributed on the edge of the composites and Ti elements at the head of NCNTs and Co at the center of the dodecahedron. As displayed in Fig. 2b and c, the inter plane fringes distance of Co nanoparticles is 0.205 nm consistent with the (111) crystal plane of the Co crystal (Jin et al. 2015). The lattice fringe of the head of NCNTs is consistent with rutile TiO2 having (110) lattice fringes with an interspacing of 0.325 nm (Xu et al. 2018). The energy dispersive spectrometer (EDS) mappings (Fig. 1e − k) reveal the existence of C, N, O, Co and Ti elements in as-prepared TiO2/Co/NCNTs composites. These results confirmed that carbonized ZIF-67@TiO2 consists of the N-doped nanotubes with TiO2 and CoNPs located at the upper and lower ends around the surface of the rhombohedral dodecahedron, respectively.
The phase composition of ZIF-67@TiO2 and TiO2/Co/NCNTs are investigated by X-ray diffraction (XRD) patterns (Fig. 3a). All diffraction peaks of ZIF-67@TiO2 ranging from 5–80° are indexed to the simulated ZIF-67 and rutile TiO2 phase (JCPDS No. 21-1276), respectively, proving the successfully synthesis of ZIF-67@TiO2. Furthermore, the diffraction peaks of TiO2/Co/NCNTs composites situate at 44.2°, 51.5° and 75.8° corresponding to (111), (200) and (220) planes match well with a cubic body-centered structure of Co (JCPDS 15–0806). Correspondingly, the XRD peaks at 27°, 36°, 41°, and 54° correspond to rutile TiO2 with the JCPDS card no. 21-1276, which corresponds to (110), (101), (111) and (211) planes of rutile TiO2.
The quantitative atomic composition of the TiO2/Co/NCNTs material surface is typically investigated by XPS. The XPS survey spectrum depicted in Fig. 3b shows the elemental compositions of cobalt (Co, ~ 780 eV), titanium (Ti, ~ 458 eV), carbon (C, ~ 284 eV), nitrogen (N, ~ 400 eV) and oxygen (O, ~ 530 eV), which are matched with the EDS mappings in Fig. 1. Figure 2c
depicts the high-resolution spectrum of Co 2p. The core-level Co 2p3/2 spectrum consists of five peaks centered at 778.8, 781.5, 793.3 and 796.5 eV, which is assigned to Co metal (Yin et al. 2016). As shown in Fig. 3d, the Ti spectrum of the TiO2/Co/NCNTs can be fitted into the Ti4+ (456.9 eV, 456.9 eV, 458.3 eV, 458.7 eV and 464.3 eV) (Erdem et al. 2001).
N2 adsorption/desorption isotherm of TiO2/Co/NCNTs belong to type-IV isotherm with a slight hysteresis loops, manifesting mesoporous structure of this material (Fig. 3e). The Brunauer-Emmett-Teller (BET) surface area is 283.2 m2·g− 1 of TiO2/Co/NCNTs. The high surface area of the TiO2/Co/NCNTs composites would facilitate electron transfer and expose more active sites to improve electrocatalysis performance. In addition, the pore size distribution curve (Fig. 3f) illustrate that TiO2/Co/NCNTs have abundant mesopores with an average pore size of ~ 4.7 nm, which are formed during pyrolysis.
3.2. Electrochemical Impedance Spectroscopy (EIS) and electroactive surface area
The electron transfer resistance (Rct) is the measurement standard to investigate electron transport characteristics. Diameter of the semicircle represents Rct. As shown in Fig. 4a, ZIF-67@TiO2/GCE, bare GCE, TiO2/Co/NCNTs/GCE demonstrate gradually decreasing in semicircle part. Compared to bare GCE, the Rct value of ZIF-67@TiO2 is much larger, it might be due to the poor conductivity of ZIF-67 although TiO2 is a semiconductor. After carbonization of ZIF-67@TiO2, TiO2/Co/NCNTs has the smaller Rct value, revealed that TiO2/Co/NCNTs possess a smaller charge transfer resistance and higher charge transfer rate. This result mainly attributes to the special structure that Ti exists in the NCNTs head and Co presents in the central dodecahedron, and superior conductivity of NCNTs.
The electroactive surface area of the modified electrode is another important parameter for electrochemical performance. Further cyclic voltammetry (CV) of bare GCE, ZIF-67@TiO2/GCE and TiO2/Co/NCNTs/GCE in 5.0 mM [Fe(CN)6]3−/4− were studied, and depicted in Fig. 4b. A pair of redox peaks observe at TiO2/Co/NCNTs/GCE with anodic peak currents of 2.6 and 1.6 times larger than those of bare GCE, and ZIF-67@TiO2/GCE, respectively. The TiO2/Co/NCNTs sensor has a faster electron transfer velocity due to the synergistic effect of enhance active sites, large electroactive surface area and high conductivity.
According to inset of Fig. 4b, anodic peak currents of the probe have a good linear relationship with v1/2, the electrode effective area was achieved by Randles–Sevcik equation. According to equation:

1
where Ip, n, v, A, D0, C0 refer to the anode peak current, the number of electron transfer, the scanning rate, the surface area of the electrode, the diffusion coefficient (7.6×10− 6 cm2·s− 1) and the concentration of the probe, respectively. From the slope of Ip vs ν1/2 curves, the electroactive areas are calculated as 0.016 (bare GCE), 0.026 (ZIF-67@TiO2/GCE) and 0.062 cm2 (TiO2/Co/NCNTs/GCE), respectively. The highly efficient surface in terms of available surface area at the fabricated sensor manifest that TiO2/Co/NCNTs is an ideal material towards TBHQ detection.
3.3. Electrochemical behaviors of TBHQ at TiO2/Co/NCNTs/GCE
The electrochemical parameter of GCE on modification with ZIF-67@TiO2 and TiO2/Co/NCNTs is investigated through cyclic voltammetry technique (CV) in 0.1 M phosphate buffer solution (PBS, pH 7.0) with 100 µM TBHQ. CV profiles are displayed in Fig. 5a, exhibits a pair of distinct redox peaks for all the electrodes due to the electro-oxidation of tert-butylhydroquinone (TBHQ) to tert-butylquinone (TBQ). Analyzing Fig. 5a, bare GCE shows small current response towards TBHQ with oxidation and reduction peaks at 0.281 and − 0.262 V. However, the CV of ZIF-67@TiO2/GCE resulted in well-defined redox peaks at 0.155 (EOx) and − 0.159 V (ERed), respectively, and the current response is almost 4.5-fold than that of bare GCE. Because of the synergistic catalysis effect between TiO2, Co nanoparticles and NCNTs, TiO2/Co/NCNTs/GCE displays prominent increase in redox peak current response with minimum peak-to-peak separation (ΔEp=60 mV). The results demonstrated that the fabricated TiO2/Co/NCNTs/GCE could provide a sensitive and accurate way for TBHQ detection.
Additionally, the electrochemical response of TBHQ (100 µM) at the different electrodes was examined by DPV technique (Fig. 5b). On bare GCE, an oxidation peak of TBHQ is observed at around 0.152 V with slight current signal of 0.464 µA. On ZIF-67@TiO2/GCE, the anodic current value of 7.789 µA is enhanced clearly and the potential is slightly sifted negative to -0.036 V. Interestingly, the response current of TiO2/Co/NCNTs/GCE is the largest (57.84 µA), which is almost 124-fold than that of the bare GCE. This may be due to their unique structural and compositional features. The excellent performance of TBHQ may be due to: (1) TiO2 with superior physical and chemical properties could facile electron transfer. (2) Co nanoparticles exists in the central dodecahedron is beneficial for accelerating electron transfer and improving active sites (Wang et al. 2013). (3) NCNTs with good conductivity and large surface area are benefit to improve the mass transport of electrochemical reaction (Xiong et al. 2010).
3.4. Effect of sweep rate
The electron transfer kinetics in electrochemical detection of TBHQ based on TiO2/Co/NCNTs/GCE was examined by CV technique for analyzing the effect about scan rate variation vs. redox peak currents. Figure 6a depicts the CV curves of TiO2/Co/NCNTs/GCE containing 100 µM TBHQ by changing the sweep rate from 20 mV/s to 400 mV/s. Clearly, the CV profile displays the gradual linear increase in anodic and cathodic peak currents with scan rate. The proportionality of the peak currents against the root of scan rates is plotted in Fig. 6b. The respective regression equations are obtained as: Ipa (µA) = 4.522v1/2 (mV1/2·s− 1/2) − 5.001 (R2 = 0.998) and Ipc (µA) = − 4.655v1/2 (mV1/2·s− 1/2) + 5.947 (R2 = 0.997), respectively. Based on this evaluation, the redox behavior of TBHQ at the TiO2/Co/NCNTs sensor is a typical diffusion-controlled (Karthikeyan et al. 2019).
Moreover, it is noteworthy that the redox peak potential of TBHQ progressively shift to the positive direction with the rise scanning rate (Fig. 6c). The oxidation peak potential (Epa) and reduction peak potential (Epc) are linear to the logarithm of scan rate (lgv) ranging from 200–400 mV s− 1, which are expressed as Epa (V) = 0.1693 lgv (mV s− 1) – 0.3121 (R2 = 0.995) and Epc (V) =–0.1642 lgv (mV s− 1) − 0.2520 (R2 = 0.988), respectively. Based on the Laviron's equation, the relationship between the redox peak potentials (Ep) and scan rate (v) is described as the following equations (Laviron E, 1979).
$${E_{{\text{pa}}}}{\text{=}}{E^{0'}}+\frac{{2.3RT}}{{\left( {1 - \alpha } \right)nF}}\lg \nu$$
2
$${E_{{\text{pc}}}}{\text{=}}{E^{0'}} - \frac{{2.3RT}}{{\alpha nF}}\lg \nu$$
3
$$\lg {k_s}=\alpha \lg (1 - \alpha )+(1 - \alpha )\lg \alpha - \lg \frac{{RT}}{{nF\nu }} - \alpha (1 - \alpha )\frac{{nF\Delta {E_{\text{p}}}}}{{{\text{2}}{\text{.303}}RT}}$$
4
wherein v, R, T, F, ks, α and n represent the scan rate, gas constant, thermodynamic temperature, Faraday’s constant, electron transfer rate constant, electron transfer coefficient, electron transfer number. The calculate values of α, n and ks for TBHQ are 0.51, 1.69 (approximate 2) and 0.76 s− 1, respectively, implying that TBHQ at TiO2/Co/NCNTs/GCE undergoes a two-electron electrochemical redox process (see Scheme 1) (Fan et al. 2018). The higher ks value obtained at TiO2/Co/NCNTs sensor conform that the electron transfer is faster than other electrodes (Ma et al. 2021).
3.5. Effect of pH and TiO2/Co/NCNTs amount
The influence of buffer solution pH for TBHQ detection in various pH ranges from 4.0 to 8.0 are depicted in Fig. 6d. The anodic peak potential gradually shifts to the negative potential with the pH increases, suggesting that the redox reaction of TBHQ is influenced by proton. A good linear relationship is observed between buffer solution pH and peak potential (Fig. 6e), and the fitted regression equation is Epa (V) = − 0.050 pH + 0.255 (R2 = 0.997). Obviously, the slope of the equation is − 50 mV/pH, close to the theoretical slope of − 59 mV per pH at 298K, indicating that the ratio of protons to electrons is equal for TBHQ on the TiO2/Co/NCNTs/GCE surface. Furthermore, TiO2/Co/NCNTs has the high current response as the pH value is 7.0. At high pH, the electrochemical reaction of TBHQ becomes more difficult because of the lack of protons. At low pH, the electrode might be unstable. Thus, 7.0 was set as the optimized pH for the determination of TBHQ in this experiment.
The TiO2/Co/NCNTs amount on the GCE, as a vital parameter for the electrochemical signal of detecting TBHQ, is investigated by DPV ranging from 3 µL to 11 µL (Fig. 6f). It can be clearly seen that, when 7 µL is dripped, the anodic peak current for TBHQ reached largest value. The higher amounts may hinder electron transfer, resulting in prolong the electron diffusion time, thus reducing the electrocatalytic activity of TBHQ on TiO2/Co/NCNTs film. Therefore, the optimal TiO2/Co/NCNTs amount could be selected as 7 µL.
3.6. TBHQ detection at TiO2/Co/NCNTs/GCE
Under optimal experimental conditions, the current responses of the TiO2/Co/NCNTs for TBHQ quantitative detection was examined by DPV with the higher sensitivity and lower background signal. Apparently, Fig. 7a displays that as the TBHQ concentration increases, the anodic current responses also increase linearly with no significant shift in potential. The dynamic linear range is 0.04–10.0 µM and 10.0–100.0 µM, respectively (Fig. 7b). The two linear regression equation of the equivalent plots are obtained for Ipa (µA) = 1.526C (µM) – 0.083 (R2 = 0.993, 0.04–10.0 µM) and Ipa (µA) = 0.486C (µM) + 13.01 (R2 = 0.997, 10.0–100.0 µM), respectively. The limit of detection (LOD) at TiO2/Co/NCNTs/GCE is given by 4 nM (signal-to-noise (S/N) of 3). Table 1 states other reported TBHQ sensor, and the as-prepared sensor outperforms them in terms of wider linear range and lower LOD.
| Sensor | Linear range(µM) | LOD(µM) | Ref. |
|---|---|---|---|
| ZIF-8/MWCNTs- COOH/GCE | 0.01–0.1; 0.1–2.5 | 0.009 | Wang et al. 2023 |
| MIP/AuNPs/GCE | 0.08–100 | 0.07 | Fan et al. 2018 |
| MIP/ZC/GCE | 1–75 | 0.42 | Ma et al. 2021 |
| PEDOT/CNT/GCE | 0.5–820 | 0.12 | Wang et al. 2021 |
| Co3O4NRs/FCB/SPCE | 0.12–62.2 | 0.001 | Balram et al. 2022 |
| MnO2/ERGO/GCE | 1-300 | 0.8 | Cao et al. 2019 |
| TiO2/Co/NCNTs | 0.04-10; 10–100 | 0.004 | This work |
MIP: Molecularly imprinted polymer. PEDOT: poly(3,4-ethylene dioxythiophene). MIP/ZC: molecularly imprinted ZIF-8 derived nanoporous carbon. FCB: chemically oxidized carbon black. ERGO: reduced graphene oxide.
3.7. Interferences, repeatability, reproducibility and stability
In order to assess the selectivity of TiO2/Co/NCNTs-based sensor for TBHQ detection, the DPV current signal of TBHQ was applied to analyze in existence of interferents. A few organic and inorganic interfering chemicals (including structural analogues) were selected as potential interferents for detection. Figure 8a. compared peak response of TBHQ (20 µM) and other compounds (20 µM of butylated hydroxytoluene (BHT), butylated hydroxyanisole (BHA), propyl gallate (PG), ascorbic acid, hydroquinone (HQ) and 100 µM of glucose, 1000 µM of K+, Mg2+, NO3− and Ca2+) in 0.1 M PBS buffer (pH 7.0). And the interferences have barely influence on the current response, the oxidation peak current of TBHQ don’t vary largely, indicating that this TiO2/Co/NCNTs sensor has strong anti-interference ability for TBHQ detection.
Six different TiO2/Co/NCNTs-based sensors were fabricated in parallel and examined in 0.1 M PBS buffer with 20 µM TBHQ. As illustrated in Fig. 8b, the relative standard deviation (RSD, n = 3) of DPV current of six paralleled TiO2/Co/NCNTs/GCE is just 2.3%, proving the proposed sensor have sustained reactivity in preparation. As repeatability is a vital factor to be considered especially in sensing applications, DPV response of TiO2/Co/NCNTs/GCE in existence of TBHQ (20 µM) was measured 10 times consecutively. As depicted in Fig. 8c, one TiO2/Co/NCNTs/GCE electrode has an RSD of 2.6%, approving outstanding repeatability property at this electrode. After storing at room temperature for 20 days, the oxidation current at the TBHQ concentration of 20 µM shows above 92% retention (Fig. 8d). All the interpretations from the above measurements demonstrated that the constructed TiO2/Co/NCNTs/GCE had favorable selectivity, reproducibility, repeatability and stability.
3.8. Analysis in real sample
To verify the validity of TiO2/Co/NCNTs/GCE, TBHQ in the edible oil (corn oil, rapeseed oil and blend oil) samples was detected via the standard addition method. In brief, the oil samples (5 mL) was mixed with alcohol and stirred continuously for 1.5 hour. Then, the mixture was centrifugation at 5000 rpm for 30 min, and the supernatant was extracted for 3 times as extract solvent. Typically, 400 µL of oil samples were respectively diluted to 20 mL with 0.1 M PBS by DPV. Good recovery results were obtained in Table 2, displaying the recovery range of 98.0–103.4%. The values evaluated from the provided method match with the HPLC method, demonstrating that the TiO2/Co/NCNTs/GCE sensor can supply an available analysis method for TBHQ in food samples.
| Sample | Detected (µM) | Spiked (µM) | Found (µM) | Recovery (%) | RSDb (%) | HPLC (µM) | ||
|---|---|---|---|---|---|---|---|---|
| 1a | 1.7 | 5 | 6.87 ± 0.18 | 103.4b | 2.62 | 6.94 ± 0.22 | ||
| 1.7 | 10 | 11.5 ± 0.12 | 98.0 | 1.04 | 11.2 ± 0.37 | |||
| 2 | 0 | 5 | 4.92 ± 0.14 | 98.4 | 2.84 | 5.05 ± 0.21 | ||
| 0 | 10 | 9.93 ± 0.29 | 99.3 | 2.92 | 9.86 ± 0.34 | |||
| 3 | 2.3 | 5 | 7.41 ± 0.30 | 102.2 | 4.05 | 7.27 ± 0.28 | ||
| 2.3 | 10 | 12.1 ± 0.47 | 98.0 | 3.89 | 12.6 ± 0.38 | |||
a Samples: 1, Corn oil; 2, Rapeseed oil; 3, Blend oil.
b %Recovery = 100×(cFound −cDetected) / cSpiked
In summary, TiO2/Co/NCNTs composites were successfully synthesized via ZIF-67@TiO2 composites as precursors and direct carbonization under Ar/H2 atmosphere. The formed TiO2/Co/NCNTs nanocomposite was used for the electrochemical detection of TBHQ with linear ranges of 40 nM-100 µM, a low detection limit of 4 nM, as well as good sensitivity, stability and excellent selectivity, which could mainly because of the abundant active sites at different positions, the unique microstructure and chemical composition, superior conductivity and large surface area of the composites. Moreover, the real sample analysis with good recovery proves the promising practical application of TiO2/Co/NCNTs sensor for TBHQ. It provides valuable references for the design of novel electrode materials in the future.
Author Contribution statement Shengbiao Zheng: methodology, validation and visualization. Jialong Fan: validation and investigation. Feilong Yin: formal analysis. Jie Chen: validation and data curation. Zhenzhen Hui: data curation and writing—review and editing. Jing Tang: Conceptualization, methodology, formal analysis, resources, writing—original draft preparation, writing—review and editing, supervision, project administration and funding acquisition. Xuchun Wang: methodology, formal analysis, resources. Jiahao Guo: Conceptualization, writing—review and editing, visualization, supervision, project administration and funding acquisition.
Funding This work was supported by National Natural Science Foundation of China (21904004), the Project of Education Department of Anhui Province (2022AH020088, 2022AH040237), the Top-Notch Talent Program for Outstanding Young Talents of Anhui Province (gxbjZD2021070), and the stable talent program of Anhui Science and Technology University.
Data availability The data used in the current study are available from the corresponding author on reasonable request.
Competing Interests The authors declare that they have no known competing financial interests or personal relationships that could have appeared to influence the work reported in this paper.
Conflict of Interest Shengbiao Zheng declares no competing interests. Jialong Fan declares no competing interests. Feilong Yin declares no competing interests. Jie Chen declares no competing interests. Zhenzhen Hui declares no competing interests. Jing Tang declares no competing interests. Xuchun Wang declares no competing interests. Jiahao Guo declares no competing interests.
- Ammawath W, Che Man Y, Baharin B, Abdul Rahman R (2004) A new method for determination of tert-butylhydroquinone (TBHQ) in RBD palm olein with FTIR spectroscopy. J Food Lipids 11 (4): 266−277. https://doi.org/10.1111/j.1745-4522.2004.01142.x
- Balram D, Lian K, Sebastian N, Al-Mubaddel F S, Noman M T (2022) A sensitive and economical electrochemical platform for detection of food additive tert-butylhydroquinone based on porous Co3O4 nanorods embellished chemically oxidized carbon black. Food Control 136: 108844. https://doi.org/10.1016/j.foodcont.2022.108844
- Cacho J I, Campillo N, Vinas P, Hernandez-Cordoba M (2016) Determination of synthetic phenolic antioxidants in edible oils using microvial insert large volume injection gas-chromatography. Food Chem 200: 249−254. https://doi.org/10.1016/j.foodchem.2016.01.026
- Cao W, Wang Y, Zhuang Q F, Wang L Y, Ni Y N (2019) Developing an electrochemical sensor for the detection of tertbutylhydroquinone, Sens Actuators B 293: 321-328. https://doi.org/10.1016/j.snb.2019.05.012
- Delgado-Zamarreno M.M, Gonzalez-Maza I, Sanchez-Perez A, Carabias Martinez R (2007) Analysis of synthetic phenolic antioxidants in edible oils by micellar electrokinetic capillary chromatography. Food Chem 100 (4): 1722−1727. https://doi.org/10.1016/j.foodchem.2005.10.018
- Erdem B, Hunsicker R A, Simmons G W, Sudol E D, Dimonie V L, El-Aasser M S (2001) XPS and FTIR surface characterization of TiO2 particles used in polymer encapsulation. Langmuir 17(9):2664-2669. https://doi.org/10.1021/la0015213
- Fan L, Hao Q, Kan X (2018) Three-dimensional graphite paper based imprinted electrochemical sensor for tertiary butylhydroquinone selective recognition and sensitive detection. Sens Actuators B 256: 520-527. https://doi.org/10.1016/j.snb.2017.10.085
- Jin H, Wang J, Su D, Wei Z, Pang Z, Wang Y (2015) In situ cobalt–cobalt oxide/N-doped carbon hybrids as superior bifunctional electrocatalysts for hydrogen and oxygen evolution. J Am Chem Soc 137(7): 2688-2694. https://doi.org/10.1021/ja5127165
- Karthikeyan R, James Nelson D, Ajith A, Abraham John S (2019) Hetero atoms doped carbon dots modified electrodes for the sensitive and selective determination of phenolic anti-oxidant in coconut oil. J Electroanal Chem 848: 113297. https://doi.org/10.1016/j.jelechem.2019.113297
- Kokulnathan T, Ahmed F, Chen S, Chen T, Hasan P, Bilgrami A, Darwesh R (2021) Rational confinement of yttrium vanadate within three-dimensional graphene aerogel: electrochemical analysis of monoamine neurotransmitter (dopamine). ACS Appl Mater Interfaces 13(9): 10987-10995. https://doi.org/10.1021/acsami.0c22781
- Laviron E (1979) General expression of the linear potential sweep voltammogram in the case of diffusionless electrochemical systems. J Electroanal Chem Interf Electrochem 101(1):19-28. https://doi.org/10.1016/S0022-0728(79)80075-3
- Li C, Jia H, Shen M, Wang Y, Nie S, Chen Y, Zhou Y, Wang Y, Xie M (2015) Antioxidants inhibit formation of 3-monochloropropane-1,2-diol esters in model reactions. J Agric Food Chem 63 (44): 9850−9854. https://doi.org/10.1021/acs.jafc.5b03503
- Liu B, Shioyama H, Akita T, Xu Q (2008) Metal-organic framework as a template for porous carbon synthesis. J Am Chem Soc 130(16): 5390-5391. https://doi.org/10.1021/ja7106146
- Liu W, Zong B, Yu J, Bi Y L (2018) Ultrasonic-assisted liquid-liquid microextraction based on natural deep eutectic solvent for the HPLC-UV determination of tert-butylhydroquinone from soybean oils. Food Anal Methods 11(2): 1797–1803. https://doi.org/10.1007/s12161-018-1174-5
- Lotfi Sh, Veisi H (2019) Pd nanoparticles decorated poly-methyldopa@GO/Fe3O4 nanocomposite modified glassy carbon electrode as a new electrochemical sensor for simultaneous determination of acetaminophen and phenylephrine. Mater Sci Eng C 105: 110112. https://doi.org/10.1016/j.msec.2019.110112.
- Ma Y, Li J Y, Wang L S (2021) Porous carbon derived from ZIF-8 modified molecularly imprinted electrochemical sensor for the detection of tert-butyl hydroquinone (TBHQ) in edible oil. Food Chem 365: 130462. https://doi.org/10.1016/j.foodchem.2021.130462
- Mahadik M A, Woo A G, Selvaraj D, Choi S H, Cho M, Jang J S (2017) Fabrication of A/R-TiO2 composite for enhanced photoelectrochemical performance: solar hydrogen generation and dye degradation. Appl Surf Sci 42631: 833-843. https://doi.org/10.1016/j.apsusc.2017.07.179
- Mashhadizadeh M H, Afshar E (2013) Electrochemical investigation of clozapine at TiO2 nanoparticles modified carbon paste electrode and simultaneous adsorptive voltammetric determination of two antipsychotic drugs. Electrochim Acta 87: 816-823. https://doi.org/10.1016/j.electacta.2012.09.004
- Medeiros R A, Rocha-Filho R C, Fatibello-Filho O (2010) Simultaneous voltammetric determination of phenolic antioxidants in food using a boron-doped diamond electrode. Food Chem 123 (3): 886−891. https://doi.org/10.1016/j.foodchem.2010.05.010
- Meng J, Miao Z C, Zhang J, Wang Z, Zhang R, Xu L L, Diao L C, Zhou J, Zhuo S P (2023) One-step synthesis of N-doped carbon nanotubes-encapsulated Ni nanoparticles for efficient electrochemical CO2 reduction to CO. J Alloy Compd 939: 168798. https://doi.org/10.1016/j.jallcom.2023.168798
- Ng K L, Tan G H, Khor S M (2017) Graphite nanocomposites sensor for multiplex detection of antioxidants in food. Food Chem 237: 912−920. https://doi.org/10.1016/j.foodchem.2017.06.029
- Priscillal I J D, Wang S F (2022) Hierarchically ordered tungsten antimonate nanoflowers anchored on carbon nanofibers for electrochemical detection of a food additive. ACS Appl Nano Mater 5(8): 10331-10340. https://doi.org/10.1021/acsanm.2c01509
- Tammari E, Nezhadali A, Lotfi Sh, Veisi H (2017) Fabrication of an electrochemical sensor based on magnetic nanocomposite Fe3O4/alanine/Pd modified glassy carbon electrode for determination of nanomolar level of clozapine in biological model and pharmaceutical samples. Sens Actuators B 241: 879-886. https://doi.org/10.1016/j.snb.2016.11.014
- Tang J, Jiang S X, Liu Y, Zheng S B, Bai L, Guo J H, Wang J F (2018) Electrochemical determination of dopamine and uric acid using a glassy carbon electrode modified with a composite consisting of a Co(II)-based metalorganic framework (ZIF-67) and graphene oxide. Microchim Acta 185: 486. https://doi.org/10.1007/s00604-018-3025-x
- Tang J, Li J, Liu T, Tang W J, Li N L, Zheng S B, Guo J H, Song C C (2022) N-doped TiO2–carbon composites derived from NH2-MIL-125(Ti) for electrochemical determination of tert-butylhydroquinone. Food Anal Methods 15(10): 2830–2839. https://doi.org/10.1007/s12161-022-02339-7
- Tang J, Zheng S B, Jiang S X, Li J, Guo T, Guo J H (2021) Metal organic framework (ZIF-67)-derived Co nanoparticles/N-doped carbon nanotubes composites for electrochemical detecting of tert-butyl hydroquinone. Rare Met 40(2): 478-488. https://doi.org/10.1007/s12598-020-01536-9
- Wang C, Liu D, Lin W (2013) Metal-organic frameworks as a tunable platform for designing functional molecular materials. J Am Chem Soc 135(36): 13222-13234. https://doi.org/10.1021/ja308229p
- Wang C L, Zhu F D, Yu Z, Zhou X, Cheng W J, Yang F C, Zhang X (2021) A poly(3,4-ethylenedioxythiophene)/carbon nanotube hybrid film for electrocatalytic determination of tertiary butylhydroquinone. Analyst 146: 6846-6851. https://doi.org/10.1039/d1an01342d
- Wang L, Ambrosi A, Pumera M (2013) `Metal-free' catalytic oxygen reduction reaction on heteroatom-doped graphene is caused by trace metal impurities. Angew Chem Int Ed 52(51): 13818-13821. https://doi.org/10.1002/anie.201309171
- Wang Y, Wang L, Huang W, Zhang T, Hu X, Perman A, Ma S (2017) A metal–organic framework and conducting polymer based electrochemical sensor for high performance cadmium ion detection. J Mater Chem A 5: 8385-8393. https://doi.org/10.1039/C7TA01066D
- Wang X X, Cullen D A, Pan Y T, Hwang S, Wang M, Feng Z, Wang J, Engelhard M H, Zhang H, He Y (2018) Nitrogen-coordinated single cobalt atom catalysts for oxygen reduction in proton exchange membrane fuel cells. Adv Mater 30(11): 1706758. https://doi.org/10.1002/adma.201706758
- Wang Z J, Han R, Li L, Sun J Q, Yang J Y, Pan M F, Wang S (2023) Electrochemical strategy based on the synergistic effect of ZIF-8 and MWCNTs for quantitation of tert-butylhydroquinone in oils and fried chips. Microchem Journal 185: 108286. https://doi.org/10.1016/j.microc.2022.108286
- Xia B Y, Yan Y, Li N, Wu H B, Lou X W (David), Wang X (2016) A metal–organic framework-derived bifunctional oxygen electrocatalyst. Nat Energy 1:15006. https://doi.org/10.1038/nenergy.2015.6
- Xiong W, Du F, Liu Y, Perez A, Supp M, Ramakrishnan T S, Dai L M, Jiang L (2010) 3-D carbon nanotube structures used as high performance catalyst for oxygen reduction reaction. J Am Chem Soc 132(45): 15839-15841. https://doi.org/10.1021/ja104425h
- Xu J, Qi X, Sun Y, Wang Z, Liu Y, Luo C, Li B, Zhong W, Fu Q, Pan C (2018) Tuning the electromagnetic synergistic effects for enhanced microwave absorption via magnetic nickel core encapsulated in hydrogenated anatase TiO2 shell. ACS Sustainable Chem. Eng. 6(9): 12046-12054. https://doi.org/10.1021/acssuschemeng.8b02350
- Xu Y, Li Q, Xue H, Pang H (2018) Metal-organic frameworks for direct electrochemical applications. Coord Chem Rev 376: 292–318. https://doi.org/10.1016/j.ccr.2018.08.010
- Ye Q, Meng X, Jiang L (2018) Identification and assessment of residual levels of the main oxidation product of tert-butylhydroquinone in frying oils after heating and its cytotoxicity to RAW 264.7 cells. Food Chem 264, 293−300. https://doi.org/10.1016/j.foodchem.2018.05.059
- Yin Y, Liu X, Wei X, Yu R, Shui J (2016) Porous CNTs/Co composite derived from zeolitic imidazolate framework: a lightweight, ultrathin, and highly efficient electromagnetic wave absorber. ACS Appl Mater Interfaces 8(50): 34686-34698. https://doi.org/10.1021/acsami.6b12178
- Yue X, Luo X, Zhou Z, Bai Y (2019) Selective electrochemical determination of tertiary butylhydroquinone in edible oils based on an in-situ assembly molecularly imprinted polymer sensor. Food Chem 289: 84−94. http://doi.10.1016/j.foodchem.2019.03.044
- Zanon A, Verpoort F (2017) Metals @ ZIFs: catalytic applications and size selective catalysis. Coord Chem Rev 353: 201-222. https://doi.org/10.1016/j.ccr.2017.09.030
- Zhang S L, Wen X, Long M, Xi J J, Hu J Q, Tang A D (2020) Fabrication of CuO/Cu/TiO2 nanotube arrays modified electrode for detection of formaldehyde. J Alloy Compd 829: 154568. https://doi.org/10.1016/j.jallcom.2020.154568
- Zhao S, Wang Y, Dong J, He C T, Yin H, An P, Zhao K, Zhang X, Gao C, Zhang L (2016) Ultrathin metal–organic framework nanosheets for electrocatalytic oxygen evolution. Nat Energy 1: 16184. https://doi.org/10.1038/nenergy.2016.184
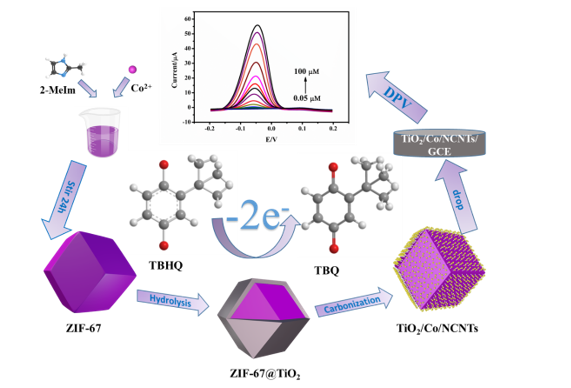
Scheme 1 is available in Supplementary Files section.
No competing interests reported.
- Scheme1.png
Scheme 1. Fabrication of TiO2/Co/NCNTs composites and electrochemical detection of TBHQ.