Features of the included studies
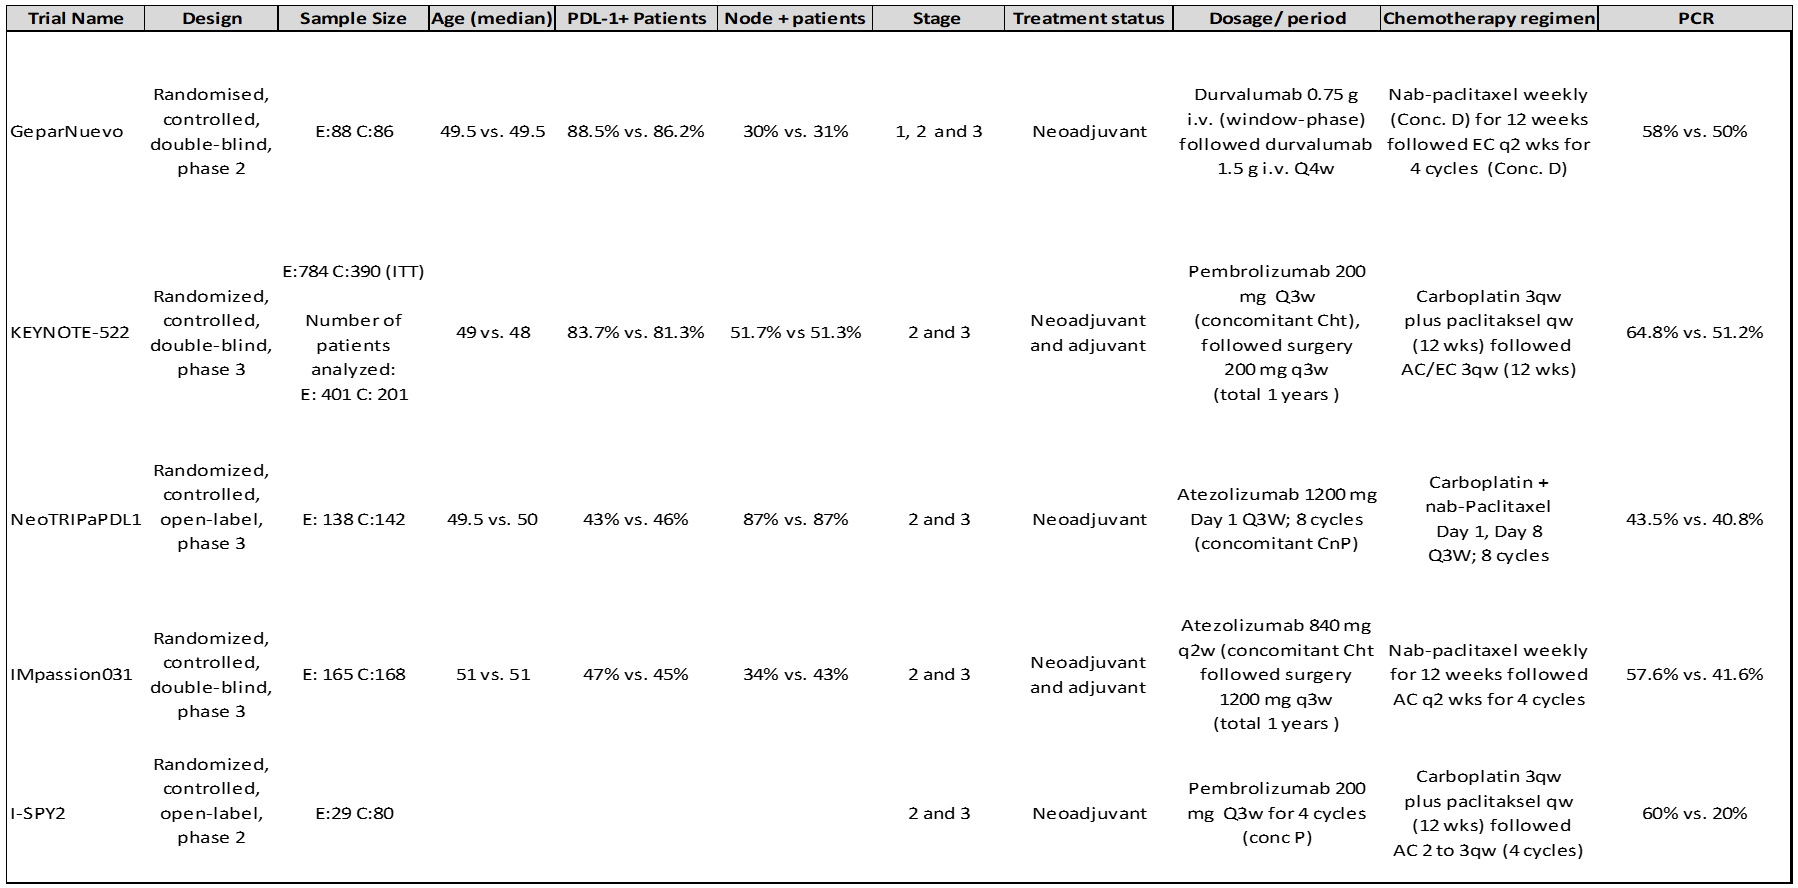
As a result of examining databases and congress papers, 423 studies were obtained. As a result of the evaluations made, it was seen that five studies were suitable for analysis.1-5 The flow chart of the literature review and selection/exclusion process is shown in Figure 1. There were 2070 patients in all of these studies, but 1498 results, whose results were shared, were evaluated. Of these patients, 821 were in the immunotherapy arm, and 677 were in the placebo arm. Three of the five studies included were phase 3 (IMpassion031, KEYNOTE-522, and NeoTRIPaPDL1 trials), and two were phase 2 (GeparNuevo and I-SPY2 trials).
NeoTRIPaPDL1 study was presented in 2019 SABCS, and its full text has not been published yet. The data of this study were taken from the congress presentation. It was available in patients with hormone receptors positive in study I-SPY2, but only data from patients with TNBC were used. In the IMpassion031 and KEYNOTE-522 studies, immunotherapy agents were also continued in the adjuvant setting, and it was completed for one year, and in the other three studies, immunotherapy was given only in the neoadjuvant environment. Detailed features of the included studies are presented in Table 1. Since the median survival results were not shared in any trial, survival analyzes were not performed.
Pathological complete response rates
In the pooled analysis of five studies (n: 1498), pCR was found to be 58.8% in the immunotherapy arm and 42.6% in the placebo arm, with the difference being statistically significant. According to the random-effects model, OR was found to be 1.77 (95% CI 1.23-2.56) (I2 = 62%; p =0.03). In the sensitivity analysis performed due to heterogeneity, the estimated absolute OR was 1.57 (95% CI 1.24-2.00) after the I-SPY2 study was excluded (n: 1389) (I2 = 15%; p =0.32) (Figure 2).
In the pooled analysis of 3 studies reporting ypT0 / TisN0 result according to PD-L1 level, immunotherapy significantly increased pCR in the PDL-1 positive group (67% vs. 49%, OR: 1.99, 95% CI 1.47-2.69). In the PDL1 negative group, although immunotherapy increased pCR numerically, it was not statistically significant (42% vs. 33%, OR: 1.44, 95% CI 0.97-2.14). No heterogeneity was observed in the included studies (I2 = 0%; p =0.51) (Figure 3).
According to lymph node status, results were shared in 2 studies. In the pooled analysis of these two studies, pCR significantly increased with immunotherapy in lymph node-positive patients (63% vs. 39%, OR: 2.52 95% CI 1.69-3.77), although immunotherapy increased pCR numerically in lymph node-negative patients, the difference was not significant (62% vs. 54%, OR: 1.36 95% 0.94-1.97). No significant heterogeneity was observed in studies included for lymph node status either (I2 = 43%; p = 0.15) (Figure 4).
Safety
In a pooled analysis of the three studies reporting grade 3-4 adverse event results, more grade 3-4 adverse events were observed in the immunotherapy arm (74% vs. 67%, RR: 1.07, 95% 1.01-1.14). There was no heterogeneity between studies (I2 = 0%; p =0.88). Analysis of 4 studies reporting the results of clinically serious adverse events revealed more serious adverse events in the immunotherapy arm (29% vs. 18%, RR: 1.52, 95% CI 1.04-2.23). High heterogeneity was found between studies (I2 = 70%; p =0.02). In the sensitivity analysis performed due to heterogeneity, the estimated absolute RR was found to be 1.74 (95% CI .29, 2.35) in the analysis of 3 phase 3 studies after the GeparNuevo study was removed (I2 = 35%; p =0.21). The discontinuation rate of any drug in the study due to an adverse event was greater in the immunotherapy arm (23% vs. 17%, OR: 1.45 [1.19, 1.76]). There was no significant heterogeneity between studies (I2 = 23%; p =0.28) (Figure 5). There are studies reporting death due to immune-related adverse events, albeit in a very low number.2
Quality of studies and Publication bias
Evaluation of the quality of the RCTs selected is presented in Figure 6. Since the number of randomized studies included in the study is small, bias assessment may not be appropriate. However, as there is asymmetry at the base of the funnel plot graph, bias cannot be ignored (Figure 7).