3.1. Optical behavior of probe NFC with Zn2+
UV-Vis absorption spectra of probe NFC (10 µM) with increasing content of Zn2+ (0–17 µM) were collected in CH3CN/HEPES (1/1, v/v, pH 7.2). The solution of probe NFC only showed three absorption bands, located at 262 nm, 325 nm and 362 nm, respectively (Fig. 1). Along with the addition of a series of Zn2+, the absorbance of the original three absorption bands gradually decreased. Meanwhile, the new bands at 337 nm and 428 nm became more and more prominent. And the color of the probe solution changed from colorless to light yellow (Fig. 1 inset). In addition, four isosbestic points at approximately 284 nm, 333 nm, 339 nm and 387 nm were appeared, which suggests that a new complex was formed between the probe molecule and Zn2+.
The fluorescence sensitivity of probe NFC was investigated by the titration experiment of Zn2+. With the increase of Zn2+ concentration (0–17 µM), the fluorescence intensity of the probe solution increased gradually (Fig. 2). The fluorescence signal transformation of probe NFC solution could be differentiated expediently under the UV light by the naked eye. Therefore, the probe provides a very handy tool for the easy monitoring of Zn2+ in water sample without expensive equipment. What’s more, a good linear relationship could be established between fluorescence intensity (486 nm) and the concentration of Zn2+ (0–9 µM): y = 27.97 x + 39.12 (R2 = 0.9912) (Fig. 2 inset). The detection limit (DL) could also be calculated as 11.8 nM using the equation DL = 3σ/S, where σ represents the relative standard deviation of the probe solution (σ = 0.11), and S represents the slope of the linear equation (S = 27.97). In addition, the complexation constant (K) between the fluorescent molecule and Zn2+ could also be obtained as 1.13 × 10⁵ M− 1 using the Benesi-Hildebrand equation between fluorescence intensity at 486 nm and the concentration of Zn2+ (Fig. 3) [36]. These results show that probe NFC can recognize Zn2+ with high sensitivity.
In order to investigate the detection performance of the probe, the selective experiment was also performed. The solution of probe NFC (10 µM) showed very weak fluorescence emission. After the addition of Zn2+ (17 µM), the fluorescence signal was significantly enhanced. Cd2+ ions (17 µM) only slightly increased the fluorescence intensity of the probe and in some cases may cause interference signal. However, the addition of other anlytes (17 µM), including common metal ions and anions, could not significantly change the fluorescence intensity of the probe solution except for Cd2+ ions (Fig. 4). Furthermore, compared with the fluorescence intensity at 486 nm of probe NFC with various analytes in the absence (black bar) and presence (red bar) Zn2+, the fluorescence intensity at 486 nm of probe NFC with Zn2+ was not significantly disturbed by other analytes (Fig. 5). Besides, the reversible fluorescence response of probe NFC to Zn2+ was done using EDTA-2Na to verify the reusability. The fluorescence intensity at 486 nm of probe NFC (10 µM) was greatly enhanced after the addition of Zn2+ (17 µM), and it was weaken under the complexation of EDTA-2Na (20 µM). What’s more, the probe remained responsive to Zn2+ when this reversible changes were repeated for 5 times (Fig. 6). Thus, this probe has excellent selectivity and efficient reusability for the detection of Zn2+.
The response time of the probe to Zn2+ and the effect of pH on the detection performance of the probe were investigated, respectively. The fluorescence intensity at 486 nm of the probe solution (10 µM) was very weak, while the fluorescence intensity increased rapidly and reached immediately the maximum value after the addition of Zn2+ (17 µM) (Fig. 7). This indicates that the probe can realize the real-time detection of Zn2+.
Additionally, the fluorescence intensity at 486 nm of probe NFC decreased markedly when pH was less than 5. This should be attributed to the fact that protons bind to probe molecules more easily than Zn2+, which hinders the interaction between Zn2+ and probe molecules. When pH was more than 9, the fluorescence intensity of the probe also reduced significantly, due to that the presence of a large number of hydroxide ions prevented Zn2+ from binding to the probe molecule. As a result, the appropriate pH should be in the range of 6–8 (Fig. 8).
The effect of solution composition between CH3CN and water on the performance of the probe was also investigated. When the volume fraction of CH3CN was less than 20%, the fluorescence intensity difference of the probe before and after the addition of Zn2+ was very small. This is mostly because that excessive water leads to the aggregation of probe molecules, which not only hinders the binding of probe molecules to Zn2+, but also causes fluorescence quenching. When the volume fraction of CH3CN was greater than 30%, the fluorescence intensities (486 nm) of the probe and probe with Zn2+ showed a significant difference (Fig. 9). Therefore, in the acetonitrile volume fraction greater than 30% water solutions, this probe could realize the detection of Zn2+.
3.2. Complexation model and detection mechanism
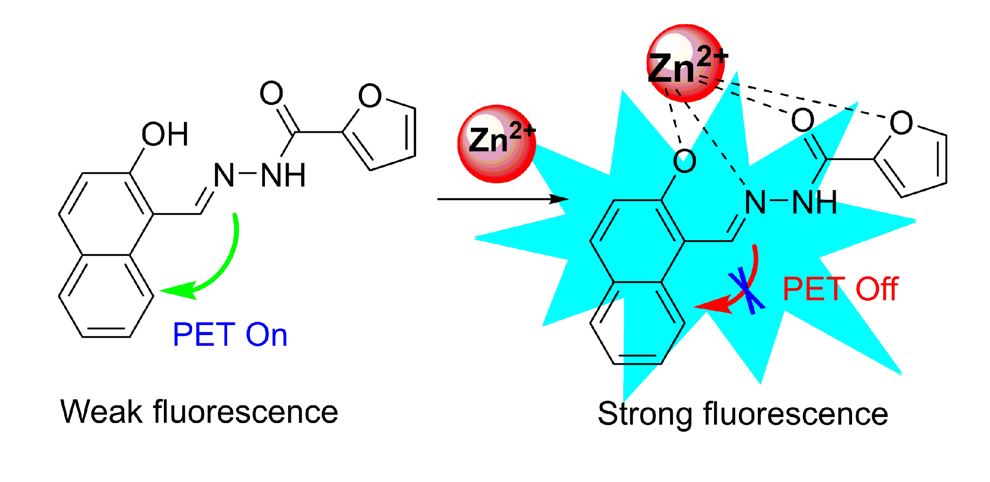
To explore the detection mechanism, Job’s plot was first used. The total concentration of probe NFC and Zn2+ was fixed at 30 µM, and the change of fluorescence intensity with the molar ratio of Zn2+ to probe NFC was recorded. The intersection point of the fitting curve was about 0.5, showing that probe NFC molecules bind to Zn2+ at a molar ratio of 1:1 (Fig. S4). This result was further confirmed by HRMS. After the addition of Zn2+, the molecular peak of probe NFC at 281.0928 disappeared. And a new peak at 343.0068 appeared (Fig. S5). It was consistent with the complex peak of probe NFC and Zn2+ with a molar ratio of 1:1. Moreover, the hydroxyl group peak of probe NFC in 1H NMR spectrum weakened after the interaction between the probe and Zn2+ (Fig. S6), indicating that hydroxyl group was involved in the coordination with Zn2+. Based on the above results, the complexation model of probe NFC and Zn2+ was recommended (Scheme 2). For probe NFC molecule only, the photo-induced electron transfer (PET) process from C = N double bond to the naphthalene group blocked the fluorescence of the naphthalene group. When the probe molecule bonded with Zn2+, the electrons of probe NFC molecule were occupied by Zn2+, the PET process was destroyed, and the fluorescence of the naphthalene group was restored. In order to better illustrate the fluorescent mechanism between probe NFC and Zn2+, density functional theory (DFT) was calculated using Gaussian 09 at DFT/B3LYP/6-31G (d, p) level (Fig. 10). The electron cloud of the highest occupied molecular orbital (HOMO) of the probe molecule was distributed mainly on the naphthalene group and C = N double bond, and the electron cloud of the lowest unoccupied molecular orbital (LUMO) scattered throughout the probe molecule, and their energy levels were − 5.56 eV and − 1.64 eV, respectively. However, when the probe molecule formed a complex with Zn2+, the electron cloud of HOMO were concentrated around Zn2+ because of the strong electron-withdrawing ability of Zn2+, the energy levels of HOMO and LUMO were − 3.86 eV and − 1.73 eV, respectively. Thus the PET process of probe NFC was off and the fluorescence became strong.
3.3. Application in water samples
The probe was first used for the detection of Zn2+ in actual water samples to evaluate its detection performance (Table 1). Zn2+ was not detected in the pond water and drinking water. After adding various concentrations of Zn2+ standard solutions, the recoveries were found to be in the range of 95.7–102.4%, and the relative standard deviation (RSD) values were in the range of 1.9–3.3%. Furthermore, this probe was used to detect Zn2+ contained in the commercial zinc supplement. A commercial zinc supplement solution (10 mL) contains Ca2+ (5.4 mg/mL), Zn2+ (0.43 mg/mL), lysine hydrochloride (10 mg/mL), and other excipients including NaOH, NaCl, lactic acid, saccharose and purified water. The content of Zn2+ contained in an oral liquid was estimated to be (0.38 ± 0.017 mg)/mL, which is close to the tagged value of 0.43 mg/mL. These results prove that this probe can be used as an effective tool for the precise and quantitative test of Zn2+ in real samples.
Table 1
The detection results of Zn2+ using probe NFC in water samples
| Sample | Spiked (µM) | Found (µM) | Recovery (%) | RSD (%) |
| Pond Water | 0 2 4 8 | no | no | - |
| 2.047 ± 0.044 | 102.4 | 2.2 |
| 4.048 ± 0.086 | 101.2 | 2.2 |
| 7.654 ± 0.153 | 95.7 | 1.9 |
| Drinking water | 0 | no | no | - |
| 2 | 2.038 ± 0.065 | 101.9 | 3.3 |
| 4 | 4.064 ± 0.098 | 101.6 | 2.5 |
| 8 | 7.831 ± 0.186 | 97.9 | 2.3 |