Ginger oleoresin (GOR) and Fenugreek oil was kindly gifted from Sunpure Extracts Pvt Ltd, Delhi, India. Lipid guggul extract (LGE) was received as a gift sample from Arjuna Naturals Pvt Ltd, Kerala, India. Castor oil and Capmul MCM was gifted from Jayant Agro-Organic Ltd, Mumbai, India and Abitec Corporation, USA respectively. Tween 80 and Kolliphor EL was given as a gift sample from Mohini Organics, Ltd, India and BASF, Mumbai, India respectively. Carbopol Ultrez 10 NF was provided as a gift sample from Lubrizol Advanced Materials India Pvt Ltd. Oleic acid, Transcutol P and Propylene glycol was purchased from Otto Chemie Pvt Ltd, Mumbai. India.
Formulation development
Screening of oils, surfactants, and co-surfactants
As GOR and LGE are liquids, selection of oil phase and surfactant phase were determined on the miscibility of these phytoconstituents in numerous oils, surfactants, and co-surfactants. Castor oil and Fenugreek oil were selected as functional excipients as they are known for anti-inflammatory activity [21, 22]. However, these oils were not sufficient to form a clear and stable nanoemulsion. Therefore, various oils such as isopropyl myristate (IPM), oleic acid (OA), ethyl oleate (EO), Captex 200P(C-200P) and Capmul MCM(C-MCM) were screened to find the optimum ratio of oil mixture. Apart from this, other surfactants, and co-surfactants such as Transcutol P (TP), PEG-400, Tween 20 (T20), Tween 80(T80), Span 80(S80), Propylene glycol (PG), Kolliphor ELP (K-ELP) were examined for selection of an appropriate Smix ratio.
Selection of oil mixture
Miscibility studies were performed using the procedure mentioned in [23] with few modifications. Mixture of 2% wt GOR and 2% wt LGE (1:1) were added to individual oil and various oil mixture (1:1) ratio, vortexed and allowed to stand for 48 hours. After 48 hours, it was examined for color change, turbidity, and phase separation. Clear and uniphasic oil mixture was selected and further studied with different surfactant mixture. Castor oil and fenugreek oil was kept constant throughout the selection procedure as they are the functional excipients.
Selection of surfactant mixture
Mixture of 2% wt GOR and 2% wt LGE (1:1) was added to individual surfactant and surfactant mixture in 1:1 ratio and allowed to stand for 48 hours. After 48 hours, it was examined for colour change, turbidity and phase separation. Clear and uniphasic surfactant mixes were taken further for constructing pseudo-ternary phase diagrams.
Construction of pseudo-ternary phase diagram
The nanoemulsion area was identified by the construction of pseudo-ternary phase diagrams by water titration method [24]. Based on miscibility studies, different Oilmix and Smix were selected while purified water was used as an aqueous phase. The selected surfactants and co-surfactant were mixed (Smix) in three ratios such as 1:1 and 1:2 to identify the optimal ratio that can result in forming maximum nanoemulsion area. Briefly, the oilmix and Smix were vortexed in various ratios 9:1, 8:2, 7:3, 6:4, 5:5, 4:6, 3:7, 2:8 and 1:9 followed by drop wise water titration until phase separation or turbidity was observed. Further, the pseudoternary phase diagrams were constructed using Chemix school-Portable Chemistry software 7.0 by calculating the percent of Oilmix, Smix and water. Likewise other ratios of Smix and the zones for clear and stable nanoemulsion were identified.
Formulation of oil-in-water nanoemulsion
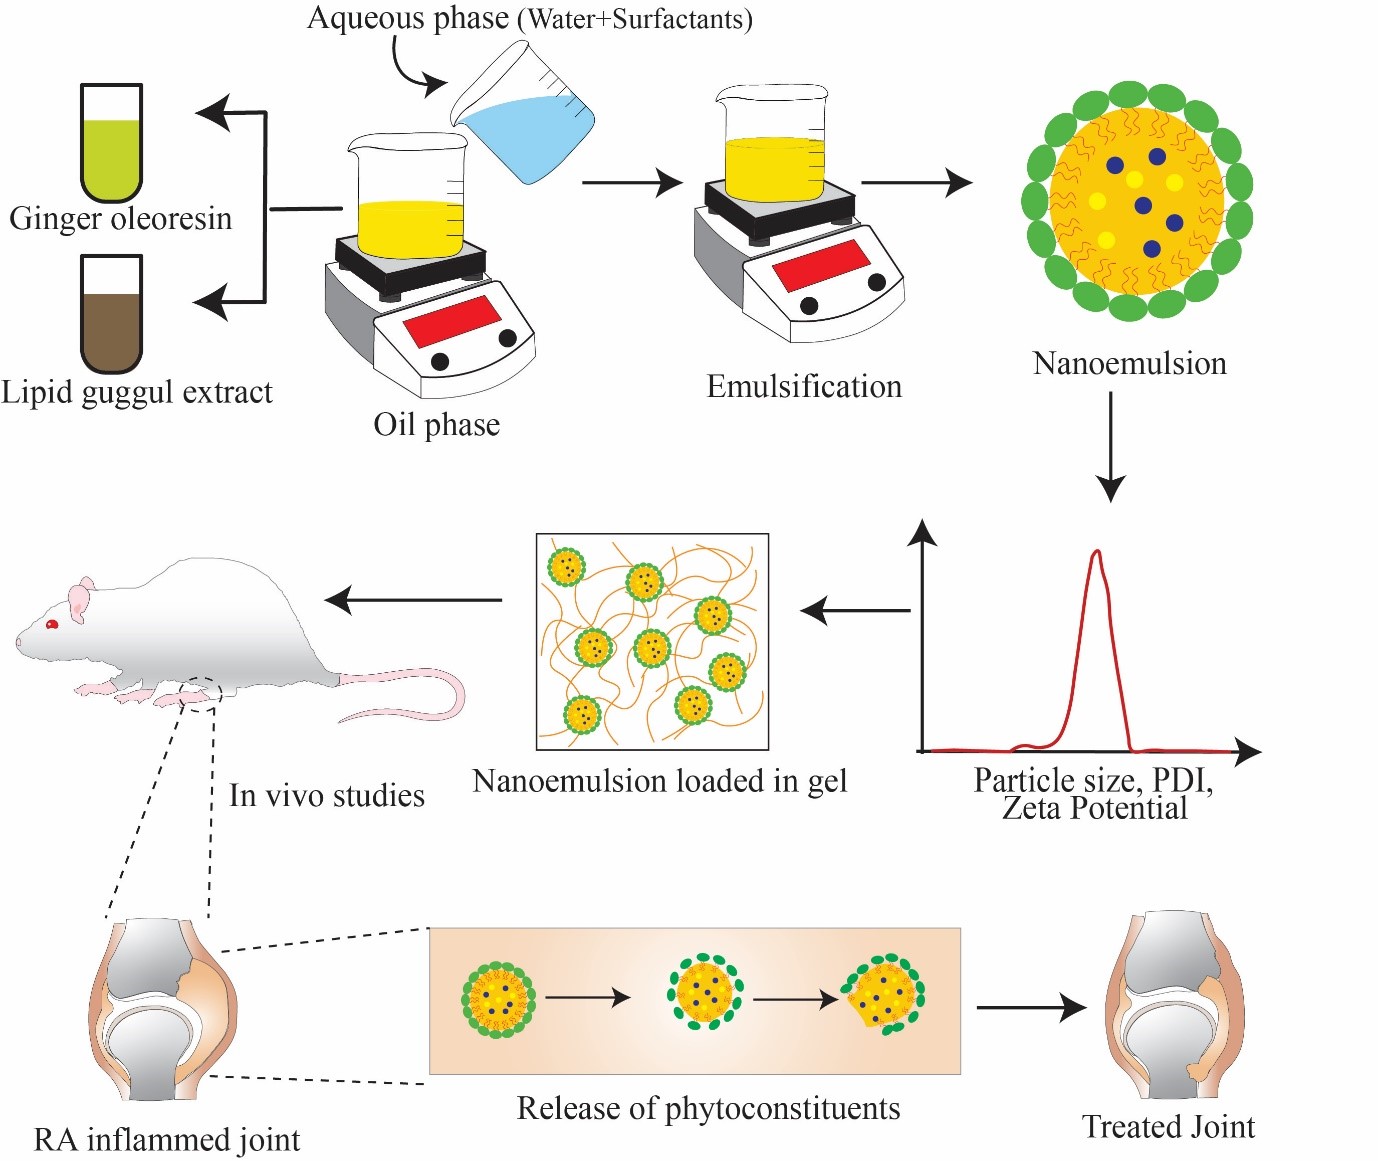
Mixture of 1% wt GOR and 1% wt LGE was added to the selected oilmix and Smix ratios selected from the pseudo-ternary phase diagram of highest nanoemulsion region. The required amount of purified water was added dropwise with continuous stirring at ambient temperature. All the batches were stored at ambient temperature for further evaluation [25].
Characterization and evaluation of nanoemulsion
Physical appearance, surface morphology and micromeritics (Droplet size, and polydispersity index)
The nanoemulsion formulation was inspected visually for their colour, homogeneity and clarity. Surface morphology of nanoemulsion was studied by using Transmission Electron Microscope. The mean droplet size (MDS) is based on photon correlation spectroscopy principle, that determines the fluctuation in light scattering from Brownian movement of the particles. The MDS was determined using Zetasizer (Nano-ZS, Malvern) Instrument. The PDI ranges from 0 to 1, where 0 to 1 represents a monodisperse to polydisperse particle system. The test samples were diluted in the ratio of 1:100 using purified water. The measurements were made in 90°C angle at 25°C in triplicate, mean value and standard deviation were reported [26, 27].
Zeta potential
Zeta potential was determined based on the electrophoretic mobility using Zetasizer (Nano-ZS, Malvern) Instrument. It helps in predicting dispersion stability which is dependent on properties of drug, excipients concentration and presence of electrolytes. The test samples were diluted in the ratio of 1:100 using purified water [28].
Thermodynamic stability and Stress testing (Centrifugation, Heat-Cool cycle and Freeze-Thaw cycle)
The optimized batches based on pseudo-ternary plots were further subjected to thermodynamic stability. The interfacial film strength was determined by testing the stability of emulsion under centrifugation. Phase separation was observed after centrifugation of the optimized formulation at 4500rpm for 20minutes. Formulations that were stable in centrifugation test, were subjected to heat-cool cycle. In heat-cool cycle, the formulations were kept between 4°C and 45°C for six cycles for not less than 48hrs and observed visually for any physical changes. The stable formulations were further evaluated in freeze-thaw cycles. Three freeze-thaw cycles between − 21°C and + 25°C were performed at each temperature for not less than 48 hour and examined for changes in homogeneity and color [19, 29].
Viscosity measurements and rheological behaviour
The viscosity of the optimized nanoemulsion was determined using Brookfield Cup and Bob Viscometer at 25°C using small sample adapter and spindle no. 63 at 150 rpm [30].
Degree of transparency (% transmittance)
Transparency of nanoemulsion was evaluated by diluting at 100X and 250X with purified water and analysing the percent transmittance at 638.2 nm with purified water as blank [19].
Incorporation of nanoemulsion in gel system
LGE and GOR containing nanoemulsion was o/w type of emulsion, therefore aqueous gelling agents were screened. Gelling agents such as Pemulen TR-1 NF, Carbopol 974P NF and Ultrez 10 NF were selected for preparation of nanoemulgel. Nanoemulsion was loaded in 0.5%, 0.75% and 1% wt concentration of these gelling agents. Based on viscosity, texture, and appearance 0.75% wt Ultrez-10 NF was selected in formulation of nanoemulgel. To prepare NE loaded gel, weighed amount of Ultrez 10 NF was hydrated for 2 hours in purified water (in half quantity of the aqueous phase of nanoemulsion) by stirring it on magnetic stirrer. LGE and GOR were added to oil mix, followed by addition of Smix and remaining aqueous phase. Further, nanoemulsion was then gradually added to the gel with gentle mixing to avoid excessive air entrapment. Finally, triethanolamine (TEA) was used as a pH adjusting agent to adjust the pH in the range of 5–6 in order to achieve maximum viscosity and form a homogenous, clear gel [31].
Evaluation and characterization of nanoemulsion loaded gel
pH determination
Topical gel must be safe and non-irritating to avoid allergic reactions. Since, pH of the formulation plays a significant role leading to allergic reactions. Hence, pH measurement of nanoemulgels is essential. Nanoemulgel pH was measured by dispersing 5 grams of gel in 50 ml of purified water (10% w/w dispersion) at 25°C using a digital pH meter calibrated at pH 4.2, 7.0 and 9.4 buffers prior to use (Labman Instruments) [32].
Spreadability
1g of optimized nanoemulgel was sandwiched between two glass slides (i.e. ground slide and upper slide affixed with a hook). 200g of weight was kept for 5 min on the top to remove excess air and ensure uniform film of the nanoemulgel. A weighed quantity (30g) was kept on pan (38gm) that was attached to the pulley. The required time (in seconds) by the glass to slip off from the nanoemulgel in the direction of certain load was recorded. The spreadability of the nanoemulgel is inversely proportional to the time required for complete separation of glass slides [33, 34]. Spreading was calculated using the mathematical formula.
S=m*l/s
Where S is spreadability, m is the weight placed in the pan (40g), l is the length of glass slides (10cms) and t is time required in seconds.
Drug content determination
Ginger oleoresin consists of 6-gingerol (6-GIN) and lipid guggul extract consists of E-guggulsterone (E-GGS) and Z-guggulsterone (Z-GGS) as active drugs. The concentration of GOR and LGE in NE was determined by using RP-HPLC. 1g of NE was diluted with 10ml methanol. After appropriate dilutions with mobile phase (ACN: Methanol: water- 70:10:20) and the concentration of 6-gingerol (GOR), E and Z-guggulsterone (LGE) were determined using RP-HPLC [35].
In-vitro diffusion study
The in vitro drug diffusion of optimized gel batch was determined using Franz Diffusion cell on nylon membrane of 0.45µm. The membrane was pre-soaked in the release media and flanked by receptor and donor compartment. The receptor compartment was filled with phosphate buffer pH 7.4: Ethanol (1:1) + 3%w/w Tween 80 (release media) in isothermal condition (37ºC ± 2ºC) and stirred magnetically at 100rpm. The aliquots were withdrawn at predetermined time intervals and quantified by the developed RP-HPLC method. The samples were replenished with fresh media after removing the aliquots. Percent cumulative drug release was calculated and plotted against time [36].
Ex vivo diffusion study
The ex vivo drug diffusion of with optimized gel batch was performed using Franz Diffusion cell on porcine ear skin. No animals were harmed during procurement of the porcine ear skin as it was collected from a government approved abattoir. After sacrificing the animal, the membrane was pre-soaked in the release media and flanked by receptor and donor compartment. The receptor compartment was filled with release media in isothermal condition (37ºC ± 2ºC) and stirred magnetically at 100rpm. The aliquots were removed at predetermined time intervals and quantified by the developed RP-HPLC method. The samples were replenished with fresh media after removing the aliquots. Percent cumulative drug release was calculated and plotted against time. The permeation profile was constructed by calculating the quantity of drug permeated per square centimeter of skin (mcg/cm2) versus time (h). The steady state flux (Jss, mcg/cm2h) was calculated from the slope of the linear portion of the plot using linear regression analysis [36–38].
Release kinetics model
Based on the in vitro and ex vivo diffusion studies various mathematical models were applied to determine the release kinetics of the active compounds from the optimized formulation. The release data was fitted into various equation for zero order release, first order release, higuchi release and Korsemeyer Peppas release [37].
Differential scanning colorimetry
The change in physical properties and temperature of the optimized nanoemulsion was determined using DSC method. The sample was heated in the range of 30–500°C in an aluminum pan that was sealed with perforated lids.
Hen’s Egg Test-Chorioallantonic Membrane (HET-CAM) study
HET-CAM is a rapid and sensitive procedure to predict skin irritancy by evaluation of the changes in the CAM of the fertilized eggs. CAM comprises of complete laminate vascular system with arteries, veins and capillaries that are sensitive to harmful and corrosive substances with an inflammatory process. As per the ICCVAM-Recommended Test Method Protocol, the irritation potential of LGE + GOR formulations were evaluated by the HET- CAM assay [39]. Fertile White Leghorn chicken eggs weighing 50 to 60 grams were obtained from Central Poultry Development Organization, Mumbai. Nine-day old, fertilized eggs which were incubated in an automatic rotating machine at 37.5 ± 0.5℃ and 62.5 ± 7.5% RH were utilized for the experimentation. The experimentation method was validated using 0.1 N NaOH (negative control), 0.9% NaCl (positive control and 0.75% w/w Ultrez-10 NF (gelling agent). The skin irritant property of LGE + GOR NEG was compared to LGE, GOR, LGE + GOR mixture, LGE + GOR NE and a commercial product (1.16%w/w Diclofenac emulgel). The irritating impact was observed visually for 5 minutes after 0.3ml of test solutions were applied to the CAM. The irritation score (IS) was determined using the following equation after recording the length of time and extent of injuries following the addition of each sample:
$$IS=\frac{\left(301-tH\right)\text{*}5}{300}+\frac{\left(301-tL\right)\text{*}7}{300}+\frac{\left(301-tC\right)\text{*}9}{300}$$
Where tH, tL and tC are time (in seconds) required for the occurrence of haemolysis, lysis and coagulation, respectively. Depending on the IS values, formulations were classified as mentioned below non-irritating (IS < 0.9), mildly irritating (1.0 ≤ IS ≤ 4.9), moderately irritating (5.0 ≤ IS ≤ 8.9) or severely irritating (9.0 ≤ IS ≤ 21.0). The experimentation was performed in triplicate [40, 41].
Cytotoxicity study on RAW 264.7 cells
The in-vitro cytotoxicity study was determined by performing MTT assay in RAW 264.7 cell lines. Cells at a density of 2×10⁴ were seeded into 96-well microtiter plates (Sigma, Germany) in complete RPMI medium (200 µL per well) and incubated at 37ºC under an atmosphere of 5% CO2 overnight. Cells were treated with the test compounds (GOR, LGE and LGE + GOR (1:1)) and diclofenac at 0.5 µg/ml, 1 µg/ml, 2 µg/ml, 10 µg/ml, 20 µg/ml and 40 µg/ml for 72hrs. This was followed by addition of 0.5 mg/mL MTT solution in each well and incubated for 3hrs at 37°C. Later, MTT solution was replaced with 100 µL of dimethyl sulfoxide (DMSO) (Millipore sigma) for solubilizing the purple formazan crystals. The absorbance was recorded using an ELISA microplate reader ( BioTek Synergy H1 Multimode Reader, USA) at λ max = 570 nm and 630 nm [33, 42].
LPS mediated anti-inflammatory study on RAW 264.7 cells
The RAW cells were seeded at 5x10⁵ in a 6-well plate with a volume of 2ml complete RPMI 1640 medium, further it was incubated at 37ºC under an atmosphere of 5% CO2. Cells were than incubated with LPS (1 µg/ml) for 3hrs and treated with the test compounds (5% GOR, 5% LGE, 50 µg/ml extract, 5 µg/ml diclofenac and 2.5% each of GOR and LGE followed by incubation for 72hrs at 37ºC under an atmosphere of 5% CO2. The cells were harvested in polystyrene tubes and centrifuged at 300g x g at 25°C. Cell pellets obtained by centrifugation were washed with PBS after decanting the supernatant. Cells fixation was performed by adding 1ml of cold 70% ethanol and incubated for 30min at -20°C freezer. This was followed by centrifugation and washing with PBS. 10 µL of antibodies were added and incubated for 30min at room temperature in dark condition. 500 µL of D-PBS was mixed thoroughly and analyzed by flow cytometer (FACS-BD Cell quest pro software) [43, 44].
Stability study
Stress studies were performed by subjecting the optimized formulation at numerous temperature conditions. Formulation was packed in sealed glass containers and stored in different temperature zones at 4 ± 3ºC, 25 ± 2ºC/ 60 ± 5% RH and 40 ± 2ºC/ 75 ± 5% RH for 3 months. At the end of each month the samples were aliquoted for evaluation of any physical change (such as clarity, phase separation, precipitation of API, and colour change), drug content, gelling capacity and pH [45, 46].
In vivo animal study
Complete freund’s adjuvant induced arthritic model.
The study was carried out in the Department of Pharmacology after the approval of the protocol by the Institutional Animal Ethics Committee (IAEC) (Approval number – CPCSEA/IAEC/P-4/2020). Male Wistar Rats of 180-200g were procured from National Institute of Biosciences, Pune. Before the commencement of study, animals were acclimatized in laboratory for 2 weeks. Animals were fed with commercial pelleted diet and water ad libitum throughout the experimentation. Complete Freund’s adjuvant (CFA) model was opted for studying the efficacy of formulated gel against anti-inflammatory condition [19].
Skin irritation study
Skin irritation was performed by applying LGE + GOR NEG on wistar rats and evaluated by skin irritation. The dorsal surface of the rats were shaved without damaging the skin surface, 4 hours before the application of the respective formulation. The rats were divided into groups each containing six rats. Group1: Positive control; animals were treated as healthy controls; Group 2: animals were treated with 0.8% v/v aqueous solution of formalin; Group 3: 1.16% w/w Diclofenac emulgel; animals were treated with a commercial product; Group 4: Placebo NEG; animals were treated with nanoemulgel without drugs and Group 5: LGE + GOR NEG; animals were treated with nanoemulgel containing drugs. After application of respective formulation, they were inspected at 24, 48 and 72 hours for dermal reactions such as edema or erythema. The mean scores for recorded on the basis of severity caused by application of these formulation. 0-no erythema/edema, 1-slight erythema/edema, 2-moderate erythema/edema and 3-severe erythema/edema.
Paw edema measurement
The paw edema was measured using digital Vernier caliper on day 0, 7th, 14th, 21st and 28th day. Paw edema changes were determined by measuring the difference in paw (in mm) between the initial day and the predetermined days (0, 7th, 14th, 21st and 28th day).
X ray analysis
Animals were euthanized on the 28th day and the left hind paws were cut and stored in neutral buffer containing 10% formalin solution. Later, the severity joint and bone deformation were analyzed.
Histopathological analysis
After euthanizing animals, left hind paw was stored in neutral buffer with 10% formalin solution. Joint tissue section were sliced into 5 µm segments and placed on a glass slide followed by staining using haematoxylin and eosin (H&E) sections. Further the sections were analyzed for cell infiltration, cartilage damage and bone erosion.
Plasma and synovium IL-6, IL-10 and TNF-α measurements
Blood serum and synovial fluid were collected after the last administration of formulation. Cytokines level of TNF-α, IL-6 and IL-10 were determined using ELIZA kit [47, 48].
Statistical analysis
One-way analysis of variance (ANOVA) was applied to determine the statistical difference. Cell cytotoxicity was analyzed using the student’s t-test with a 95% confidence interval. For all statistical analyses, Graph Pad Prism version 7.0 (GraphPad Software, San Diego, California USA) was used.