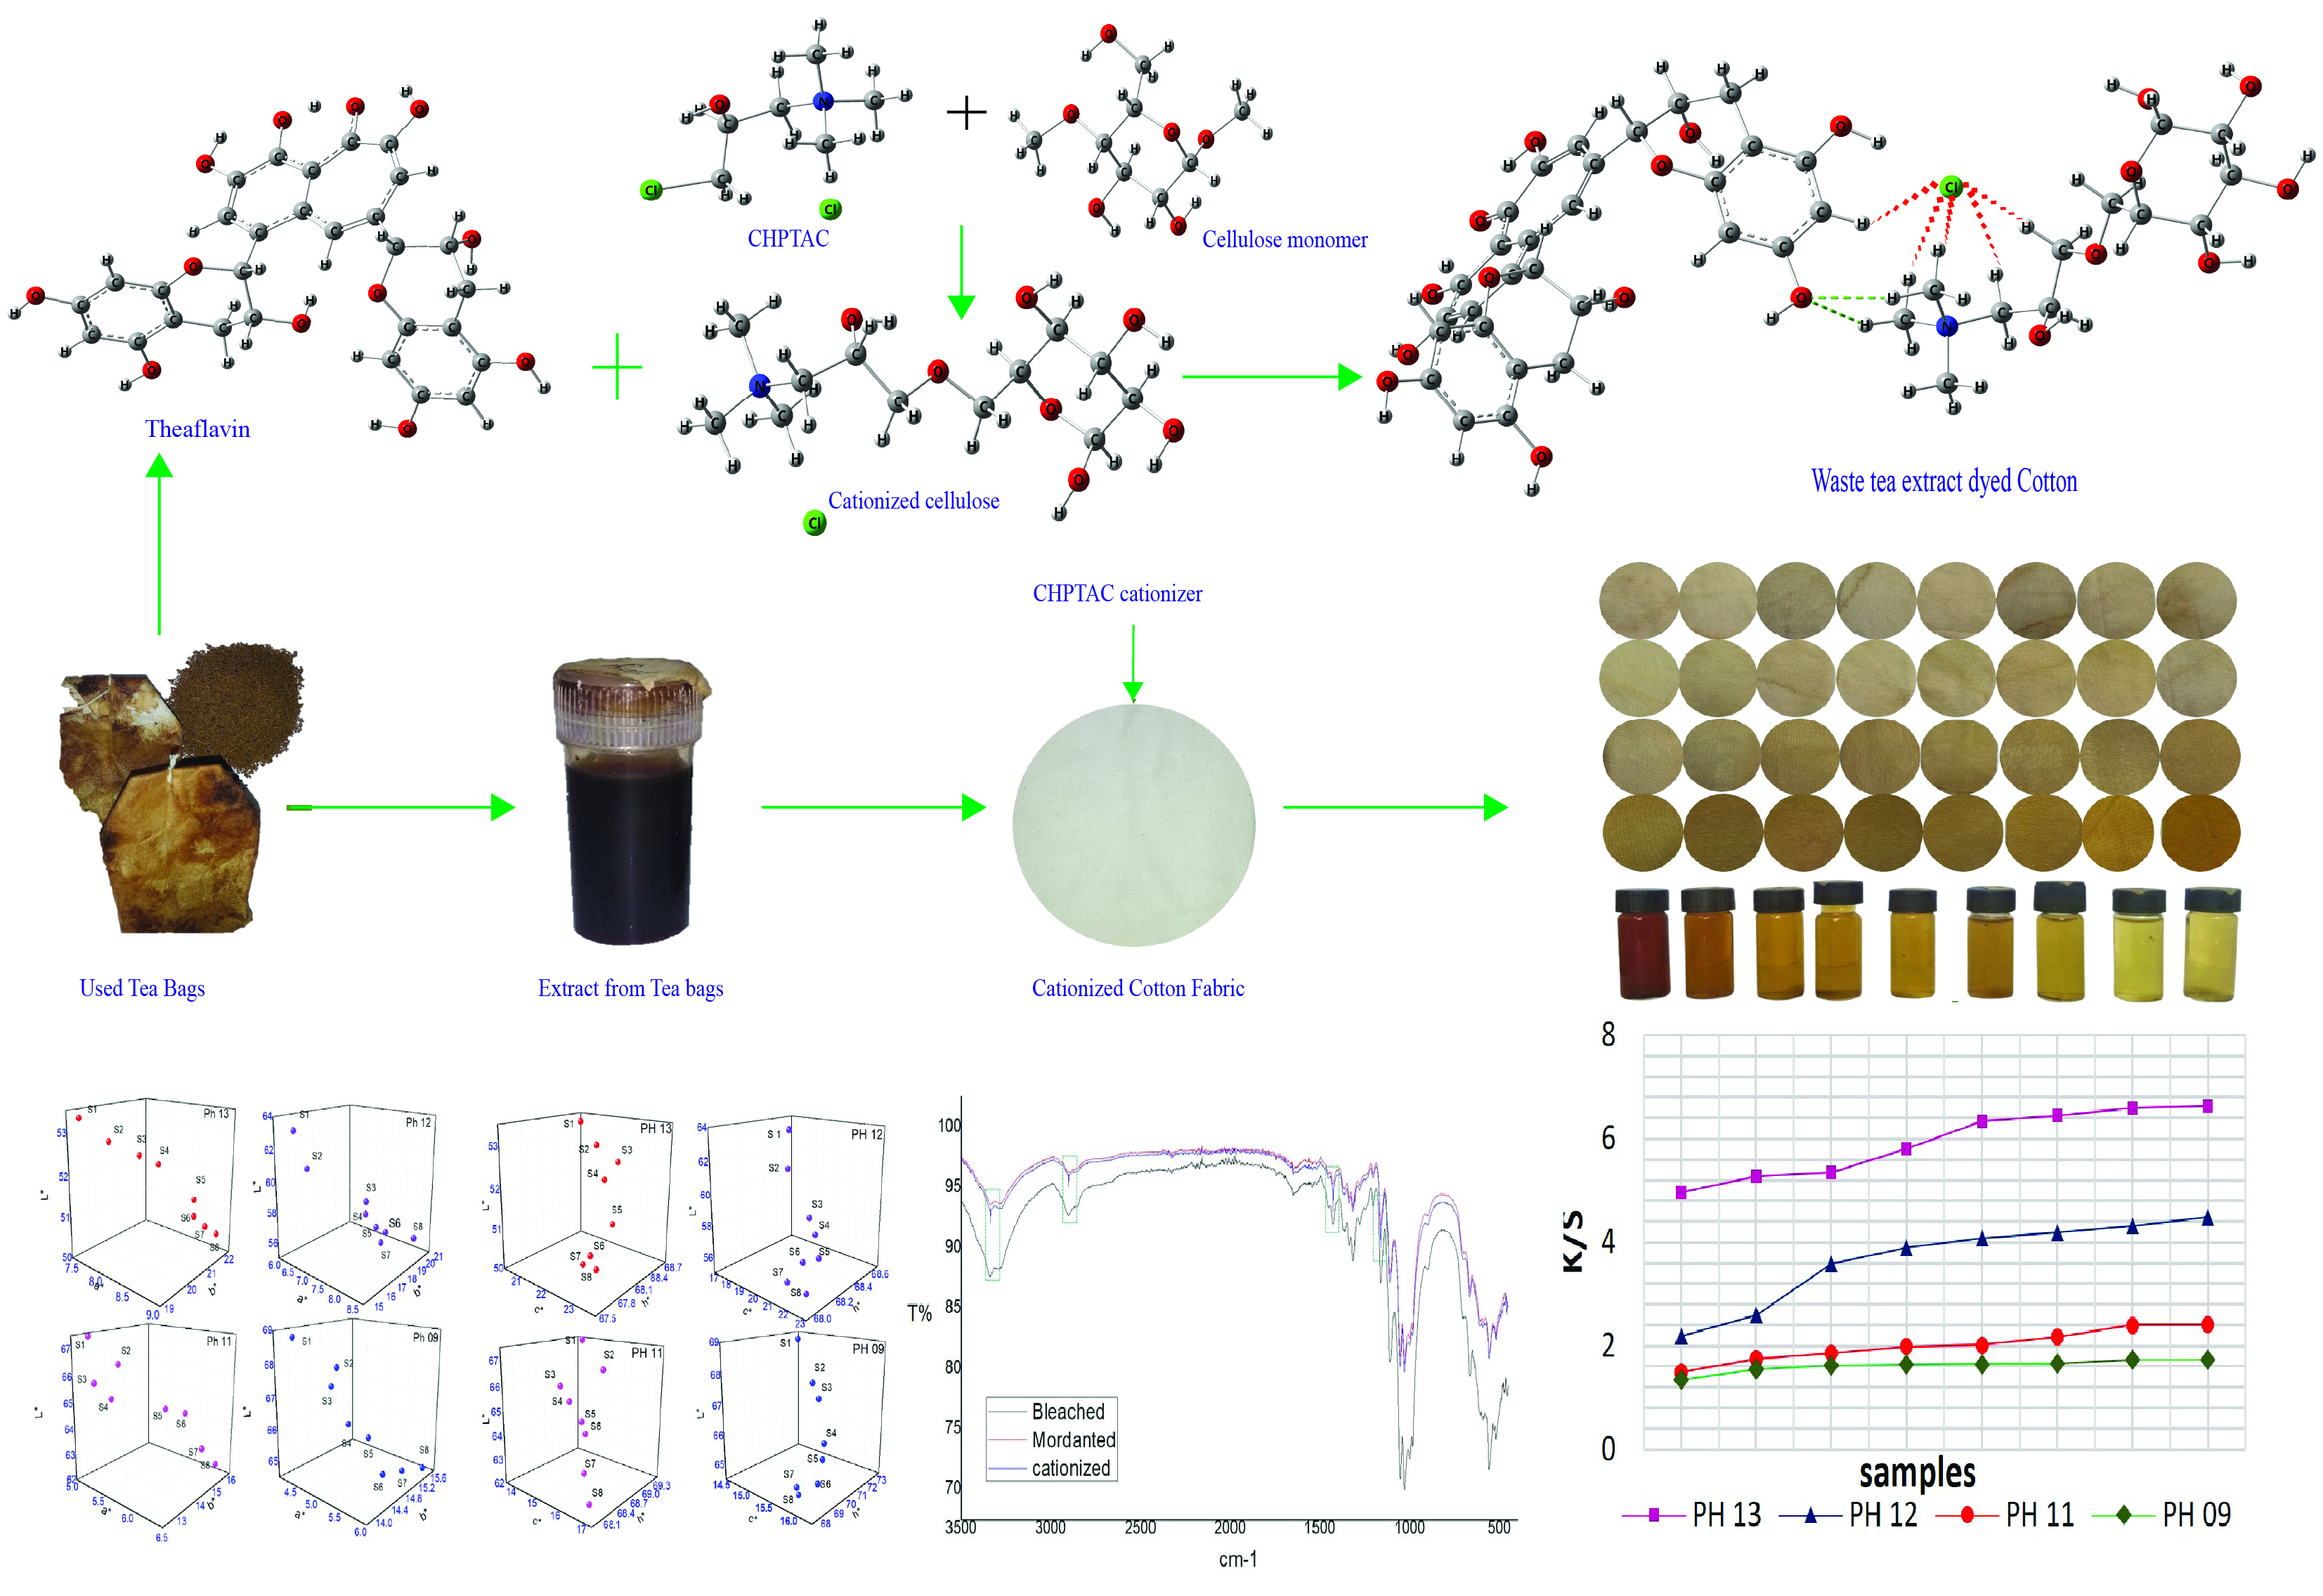
The study focuses on the eco-friendly dyeing of cotton fabric by extracts from used tea bag without any metal mordant and also on investigating the effect of pH and fabric cationization on the properties of that dyed cotton. Coloured liquor was collected from leftover tea bags using water in boiling. Prior to dyeing, the cotton fabric was cationised with 3-chloro-2-hydroxypropyl trimethyl ammonium chloride (CHPTAC) at different percentage, followed by dyeing with tea liquor at different concentrations and different pH. The colour fastness and colorimetric properties (CIELab, CIELch, ΔE and K/S) of dyed cotton fabrics were then investigated. UV-Vis spectroscopy was used to calcualte exhaustion and fixation percentages. FTIR analysis was also carried out. The best results were obtained for pH 13. At pH 13, the highest exhaustion percentage was 88.6% for cationised fabric with cationiser concentration 55 g/L whereas it was 0.75% for non-cationised fabric and 3.6% for mordanted (KAI(SO₄)₂.12H₂O) fabric. Also, the colour fastness to washing, rubbing and perspiration of cationised fabric were excellent (4–5) than those of non-cationised fabric; nevertheless, the former has lower light fastness. Their higher washing and rubbing fastness were attempted to explain within the framework of density functional theory (DFT) by their considerably strong interaction between theaflavins, one of the main colouring components of tea dye and cationised cellulose monomer. All findings from this study explicitly demonstrate the significance of pH and fabric cationisation on dyeing and the functional properties of dyed fabric.
Research Article
Influence of pH and fabric cationisation on functional properties of natural dyed cotton using extract from used tea bag
https://doi.org/10.21203/rs.3.rs-2938723/v1
This work is licensed under a CC BY 4.0 License
Version 1
posted
You are reading this latest preprint version
Waste tea dyeing
metal free dyeing
pH
Cationization
DFT
The negative impact of textile colourants on health and the environment has become a grave concern as the use of hazardous synthetic dyes is growing significantly in textile colouration [1], [2]. Synthetic dye works as an environmental pollutant with over 10,000 different types of dyes and chemicals used for textile application with more than 700,000 tons of synthetic dyes used globally [3], [4]. Cotton, a widely used cellulosic natural fiber, mostly dyed with reactive dyes, has a huge environmental impact as various synthetic dyes are used for various colours imparted on fabrics [5]. Countries like Bangladesh, where textile industries are almost solely dependent on cotton/cellulose based products suffer environmental havoc for the extensive use of such synthetic dyes [6]. Finding alternatives to synthetic dyes, although illusive, given the context and extent of synthetic dyes' reach, natural dyes from resources like plants, animals, minerals, or any other recycled sources could be an alternative option, however, to some extent. [7].
According to Bangladesh Tea Board, in 2019, 96.07 million kg tea was produced of which 99% tea was consumed locally as beverage. It ultimately results a huge amount of waste tea in form of used tea leaves or tea bags. To reduce this large amount of waste tea and also to meet the growing need of natural dyes, waste tea can be reused as a cheap and readily available source of natural dye especially for dyeing cotton fabrics.
One of the varieties of tea leaves is Camellia Sinensis which is a good option for the natural dyeing of cotton fabric [8], particularly with mordant. It provides good fastness properties [9]–[12]. It naturally contains tannin, which could also work as a mordant [13]–[15], although it may not be enough for the required fastness properties. Tea leaves contain amino acids, caffeine, carbohydrates, carotenoids, chlorophyll, lipids, minerals, nucleotides, organic acids, polyphenols, saponins, unsaponifiable compounds and various volatile compounds [16]. Among them, theaflavins and thearubigins are the two main pigments, especially found in black tea are derived from the fermentation of the polyphenols, present in tea. The polyphenols in tea extract have very poor natural affinity towards the cotton fibers. These two components: theaflavins and thearubigins have hydroxyl groups in their structures, which form bonds with metal ions [17]. Thus, different heavy metals like alum, copper sulfate (CuSO4), and ferrous sulfate (FeSO4) have been used as pre-, meta-, and post-mordanting agent for enhancement of colour fastness of tea dyed cotton [8],[18]. Alum shows bright shade and it has good colour fastness to wash and rubbing, FeSO4 shows dark shade and CuSO4 has very low colour fastness and medium bright shade[11]. However, in most cases, metal based mordants pose hazards to both health and the environment [19]. Using cationiser to cotton materials prior to dyeing could be an option to make the process metal free. It was found that applying CHPTAC (3- chloro-2- hydroxy- propyl tri-methyl ammonium chloride) cationiser provides high pick-up percentage and good cationisation performance for cellulose fibers [20].
It is evident from several studies that using tea leaves as a natural colouring agent can be a benign and environmentally sustainable way to dye cellulosic fibers [8]. Dyeing of mordanted cotton fabric with tea extracted liquor has also been found to have good fastness properties.
Cationisation of cotton textile materials has been carried out extensively to provide low salt dyeing techniques [21]–[23]. A similar principle has been applied in this study, where cotton materials are cationised with CHPTAC, followed by dyeing with extracts from used tea bags. Thus, there is a scope to conduct a study to evaluate the role of CHPTAC in cotton dyeing with natural dye, instead of using metal mordants. The dyeing performance of cationised, mordanted and no treatment fabric was compared based on dye exhaustion, colour strength (K/S), and various fastness such as wash fastness, dry and wet rub fastness, light fastness. FTIR analysis was also performed to characterise cationised, mordanted and bleached cotton dyed with waste tea extract. Computational studies was carried out to investigate the bond nature and bond strength between dye molecules and cationiser molecules on cotton fabric.
2.1 Materials
100% cotton knit single jersey bleached fabric of 157 g/m2 has been used for dyeing. Waste tea bags were collected from local tea stalls at Dhaka, Bangladesh and dried by air dryer. The cationiser, CHPTAC was supplied by Dow Chemicals ltd. and potash alum (potassium aluminium sulfate (KAI(SO₄)₂.12H₂O)) as mordant was collected from local market of Dhaka, Bangladesh.
2.2 Methods
2.2.1 Fabric cationisation (Exhaust Method)
At fitrst, cationisation of the fabric was done using CHPTAC at eight different concentrations 20, 25, 30, 35, 40, 45, 50 and 55 g/L, at four different pH – 9, 11, 12 and 13. Material to liquor ratio (M:L) is maintained at 1:20, and pH is adjusted by adding the required amount of NaOH at 700C temperature for 50 minutes. To increase the wettability fabric, wetting agent was added 1g/L for better treatment. After that the fabric was consecutively rinsed with water, dilute acetic acid (1–2 g/L for neutralisation) and again water at room temperature [24].
2.2.2 Dye extraction
The collected waste tea was dried and 30 gm of it was added to 1 litre of water. The mixture was stirred, heated and kept at 100°C for 30 minutes and then filtered. PH of the extracted tea liquors was found to be around 5.17 ± 0.5.
2.2.3 Mordanting and Dyeing
To compare, a sample cotton fabric was pre-mordanted with 3% of alum with M:L ratio of 1:20 and treated for 60 min at 1000C [25] and then dried without washing. The dried pre-mordanted sample and a controlled sample without cationiser were then placed in a tea dye bath keeping M:L ratio 1:10 along with 1 g/L of wetting agent and 70 mL of waste tea extract liquor. Then the temperature was gradually raised to 90°C and allowed to simmer for 60 minutes. Finally dyed fabrics were removed, washed with water at room temperature with a 2g/L detergent solution and dried at room temperature.
2.2.4 Colorimetric properties
The CIELab, CIELch values and the K/S values of all dyed samples at pH 9, 11, 12 and 13 were determined with a spectrophotometer (Datacolour 650) with D65 illumination and 10° observer angle. 4 folds were used and an average of two readings of each sample was taken.
2.2.5 UV-Vis exhaution percentage
All the treated samples were evaluated with UV-Vis spectrophotometer machine to assess their colour strength, colour shade difference and other colour parameters. The UV − visible absorption spectroscopic concentration measurement of the tea extract both before and after dyeing was performed by PerkinElmer UV/VIS Lambda 365 (PerkinElmer, Inc., USA) at DCE Lab, BUTEX.
2.2.6 FTIR analysis
Fourier transform infrared (FTIR) spectra of the fabric samples at pH 12 and 13 were evaluated by FTIR spectrometer, Perkin Elmer, using LiTaO3 detector with resolution of 1 cm− 1, with a range of 4000 − 450 cm − 1 at DCE Lab, BUTEX.
2.2.7 Colour fastness
The wash fastness and rubbing fastness were conducted with the standard method ISO 105-C06 and ISO 105-X12:2001(E) with crockmeter (SDL ATLAS LTD, USA) for pH 12 and 13 at Harris & Menuk Lab, Dhaka.
The perspiration fastness and light fastness were conducted with the standard method ISO 105-E04:2013 and AATCC TM16 on Q-SUN XE-2 Xenon machine for 72 hours at WPE Lab, BUTEX. Finally, the evaluation had been done with gray scale (1–5) and blue scale (1–8) both for fading and staining.
2.2.8 Computational methods
To get an insight into the interaction between tea dye molecules and cotton fabric through CHPTAC, the structures of CHPTAC, cellulose monomer and theaflavin: one of the active dye component of tea extract, were optimised with density functional theory (DFT) [26] by using the B3LYP hybrid functional (Becke’s three-parameter hybrid function [27] and VWN3 [28] local correlation) with 3-21G basis set. The frequency calculation and natural bond orbital (NBO) analysis were performed to confirm them as stable structures and to know about the mechanism of bonding between theaflavin and CHPTAC molecules. NBO analysis reveals the donor acceptor interactions by the charge delocalisation from occupied Lewis orbital to anti-bonding Lewis orbital. It also determines the strength of interaction by the second order perturbation theory. All the calculations were carried out with Gaussian 09 suite of programs [29]. For visualisation of bond interactions and for further analysis, QTAIM (Atom in Molecules) was also performed with Avogadro [30].
3.1 Colorimetric properties
Figure 2 shows the colour difference of the dyed fabric which increases with the increase of pH as well as the concentrations of CHPTAC. The result is in agreement with the fact that the cationiser helps in the bonding between tea dye and cellulose. Although samples dyes in pH 9 and pH 11 showed uneven shade which improved in case of pH 12 and pH 13. Sample 8 at pH 13 showed the best result (ΔE = 46.27) among all the samples. However, the mordanted dyed fabric shows a slightly better value compared to that of bleached dyed fabric but all the cationized dyed fabric (sample 1-8) have much higher values of ΔE .
CIELab, CIELch values were illustrated in the Figure 3 and Figure 4. The illustrations show the effect of pH and concentration of CHPTAC on the values of CIE L*, a*, b*, and CIE L*, c* and h. In case of L (Light-dark), it was found that as the pH increases, lightness decreases, indicating a more uptake of dye resulting in deeper shade. The CIELch value also showed similar lightness values as well as the chroma and hue values of different samples. Sample 7 of pH 13 showed 23.45 chroma and 67.65 hue values where bleached cotton showed 3.58 chroma and 88.01 hue though hue did not affect the whiteness as the chroma was very less.
In Figure 5, a*-b* plot shows that all the values were between red (+a) and yellow (+b). The bleached sample was near to center values (towards white). Bleached dyed and 3% alum dyed samples also showed average values. Among all, pH 9 and pH 11 showed comparatively lower coordinates than pH 12 and 13. In every pH, there is an increase of coordinates with a few exceptions. The highest redness value was 8.92 for sample 7 at pH 13. However, the trend line illustrated the uniformity of the values.
From the reflectance value, the colour strength values were determined which is illustrated on the figure for different pH with respect to different cationiser concentrations. The figure 6 shows that the K/S values were highest for pH 13 (Sample 8: 6.63) and lowest for pH 9 (Sample 1: 1.26) which also increases with the increase of cationiser amount from sample 1(20 g/L) to sample 8 (55 g/L). Due to lower and non-uniform K/S values at pH 9 and pH 11, further characterisations of dyed samples were conducted only for pH 12-13.
3.2 Dye exhaustion percentage
Depending on the concentrations of before dyeing and after dyeing, the exhaustion% of two different pH had been evaluated. It was clear that the K/S value profoundly depends on pH of cationisation. The figure 7 shows that pH 13 has better exhaustion than pH 12. Where every specific sample in both pH shows proportional relation with cationiser amount from sample 1 (25g/L) to sample 8 (55 g/L). The highest amount of exhaustion was 88.61% for sample 8 at pH 13 which is in agreement with the discussion based on computational analysis in later section. The lowest value was 31.4 for sample 1 of pH 12. However, bleached dyed and 3% alum mordanted samples have very poor exhaustion% (0.7475% and 3.607% respectively). The result indicates that the pH and concentration of cationiser have great impact on dye exhaustion thus colouration of textiles. The higher the pH the higher the percentage of dye exhaustion and again the higher the concentration of cationiser, the higher the percentage of dye exhaustion to a certain limit.
The IR spectra of bleached, mordanted and cationised cotton fabric were shown in Figure 8. The bleached cotton showed the O-H spectrum of cotton fabric at 3334.98 cm-1 which is also showed by mordanted tea dyed and cationised tea dyed fabric with little left (3335.02 cm-1 ) and right shift (3334.97 cm-1) respectively. The peak of 2899.70 cm-1 showed the (alkane) C–H stretching vibration, 1314.39 cm-1 was assigned to O-H bending vibration, 1427.48 cm-1 showed C=O vibration, 1160.70 cm-1 showed S=O stretching sulfone, 1030.08 cm-1 and 1054.34 cm-1 showed S=O stretching sulfoxide, 558.59 cm-1 and 663.05 cm-1 showed halogen chloro compound.
The canonized fabric shows relatively narrow O–H stretching peaks at 3334.97 cm-1, aliphatic C–H stretching at 2899.29 cm-1 and C–N stretching vibration at 1160.98 cm-1 . Moreover, the sharp peak of 1427.76 cm-1 refers to the existence of quarternary ammonium groups.
3.4 Colour fastness
The Table 1 shows that cationised dyed fabric samples (2-8) have better colour fastness to washing, rubbing, perspiration and light than bleached dyed or mordanted dyed samples. Colour fastness to washing for samples dyed at pH 13 are better than that of samples at pH 12. Moreover, with the increasing amount of CHPTAC at every pH. The fastness to staining was mostly excellent where colour fastness was moderate to very good. Rubbing fastness for pH 12 and 13 was also shown in the Table 1. The dry rubbing fastness values were good to excellent for all the samples where wet rubbing fastness was average to good. Here wet rubbing fastness was poor due to moisture content present in both dyed fabric samples and crocking cloth which increases the frictional coefficient. However, the bleached dyed sample showed also good to excellent fastness due to lower depth of colour, as indicated by K/S value. The perspiration fastness in Table 1 was found from moderate to excellent and colour fastness to staining are mostly excellent, particularly at pH 13. The fastness values prove that with the increasing the amount of cationization, bonding between tea pigments and cotton fibers through CHPTAC also increases, which was explained with DFT calculation in later section.
The light fastness of the dyed fabrics was good to very good for the sample 6-8 of each pH where the other samples 1-5 were moderate to good. The outcome proves to relatively stable chromophore group of the tea extracts.
Table 1 Colour fastness to washing, perspiration, rubbing and light of dyed fabric at different pH of cationisation and different CHPTAC concentrations. Three types of sample fabrics are shown in the Table 1, they are bleached cotton sample, mordanted sample and cationized sample (1-8).
|
|
Wash fastness |
Rubbing fastness |
Perspiration fastness |
Light fastness |
||||||||||
|
Sample |
colour |
Staining |
colour |
Staining |
Dry |
Wet |
Dry |
Wet |
colour |
Staining |
colour |
Staining |
|
|
|
Bleached |
3-4 |
4-5 |
|
|
4-5 |
4-5 |
|
|
3-4 |
4 |
|
|
4-5 |
|
|
Mordanted |
3-4 |
4 |
|
|
4-5 |
4 |
|
|
3-4 |
4 |
|
|
5 |
|
|
|
pH 12 |
pH 13 |
pH 12 |
pH 13 |
pH 12 |
pH 13 |
pH 12 |
pH 13 |
||||||
|
1 |
3-4 |
4-5 |
3-4 |
4-5 |
4-5 |
4 |
4-5 |
3-4 |
3-4 |
4 |
3-4 |
3-4 |
4-5 |
5 |
|
2 |
3-4 |
4-5 |
4 |
4-5 |
4-5 |
4-5 |
4-5 |
4 |
4 |
4 |
3-4 |
3-4 |
4-5 |
5 |
|
3 |
4 |
4-5 |
4 |
4-5 |
4-5 |
4 |
4-5 |
4 |
4 |
4-5 |
4 |
4 |
4-5 |
5 |
|
4 |
4 |
4-5 |
4 |
4-5 |
4-5 |
4 |
4-5 |
3-4 |
3 |
4-5 |
4 |
4 |
4-5 |
5-6 |
|
5 |
4 |
4-5 |
4-5 |
4-5 |
4-5 |
4 |
4-5 |
3-4 |
4 |
4-5 |
3-4 |
3-4 |
4-5 |
5-6 |
|
6 |
4 |
4-5 |
4-5 |
4-5 |
4-5 |
3-4 |
4-5 |
3-4 |
3-4 |
4-5 |
3-4 |
3-4 |
5 |
5-6 |
|
7 |
3-4 |
4-5 |
4-5 |
4-5 |
4-5 |
3-4 |
4-5 |
3-4 |
3-4 |
4-5 |
4 |
4 |
5 |
5-6 |
|
8 |
3-4 |
4-5 |
4-5 |
4-5 |
4-5 |
4-5 |
4-5 |
3-4 |
4-5 |
4-5 |
4-5 |
4-5 |
5 |
5-6 |
3.4 pH of cationisation
As mentioned earlier, cationisation increases dyeability of cotton fabrics, although the appropriate pH for cationsation is the one of the most important factor, which is in agreement with the following computational study.
To reduce the computational cost, cellulose monomer (β-glucose) was used for calculation instead of cellulose. CHPTAC is bonded with β-glucose and this glucose-CHPTAC dimer then interacts with theaflavin at its two different positions to form a glucose-CHPTAC-theaflavin complex A and complex B (see Figure 9). To get insight into each type of the bonding with theaflavin in complex, the binding energies for glucose-CHPTAC-theaflavin complexes were calculated separately for A and B (see Figure 9) within DFT framework with B3LYP/3-21G basis sets, using the below equation.

From the above equations (1) and (2), it was found that the binding energy (BE) in between glucose-CHPTAC dimer and theaflavin in complex A is less, thus more stable than that in complex B. It can be explained by n-σ* hyperconjugation that is directly estimated using the second order perturbation energy from the NBO analysis. From QTAIM molecular graph of complex A and B, the strong interaction between glucose-CHPTAC dimers and theafalvin can be also understood. Although there are several interactions taking place between different donor and acceptor orbitals of CHPTAC and theaflavin, NBO shows that major channels for electron transfer in complex A is from lone pair orbital of chloride ion of CHPTAC to antibonding orbital of O1-H8 of theaflavin (nCl→σ*O1-H8) which initiate charge flows between two fragments (see Table 2). However the bonds between dimer and theaflavin were strengthened further by several other interaction like nO2→σ*C1-H2 and nO2→σ*C2-H4. Thus the electrostatic nature of bond between dimer and theaflavin in complex A is dominating (see Figure 9). But in case of complex B, no direct contribution of chloride ion was found, rather several interactions from lone pair orbitals of O3 and O4 of theaflavin to respective antibonding orbitals of σ*C2-H4, σ*C3-H6 and σ*C1-H2 of CHPTAC were significant (see Table 2) which is associated with covalent nature of bonds between dimer and theaflavin in complex B. Nevertheless, in both complexes A and B, the bonding between dimer and theaflavin are sufficiently strong which could be the possible reason for their higher colour fastness to washing and rubbing.
Table 2. The 2nd order perturbation energies from NBO analysis and binding energies (BE) in complexes A and B at the level of B3LYP/6-31G.
|
Complex, A |
|
Complex, B |
||
|
DE |
Kcal/mol |
|
DE |
Kcal/mol |
|
DE(nO2→σ*C1-H2) |
3.16 |
|
DE(nO4→σ*C3-H6) |
3.36 |
|
DE(nO2→σ*C2-H4) |
4.20 |
|
DE(nO4→σ*C1-H2) |
1.76 |
|
DE(nCl→σ*O1-H8) |
29.39 |
|
DE(nO3→σ*C2-H4) |
4.19 |
|
DE(nCl→σ*C5-H7) |
3.45 |
|
-- |
-- |
|
DETotal, NBO |
40.2 |
|
DETotal,NBO |
9.31 |
|
DEBE |
-24.30 |
|
DEBE |
-9.65 |
From aforementioned discussion, it can be suggested that more probable structure is complex A than that of complex B as the former has higher stability (DEBE = -24.3 Kcal/mol). It is because of electrostatic nature of bonds resulting from the reaction between theaflavin and cotton when it is cationised (See Figure 10). Hydrated cotton has a very weak negative charge that affords almost no affinity towards theaflavin. So, more cationisation of cotton indicates more bond formations with available theaflavin from tea extract which have higher bond strength as well. And enhanced cationisation is only possible when there will be adequate amount of epoxypropyl tri-methylammonium chloride (EPTAC) present to take part in reaction (Figure 10). The more NaOH reacts with CHPTAC, the more EPTAC is formed to react with cellulose [31] and later forms bond with the theaflavin [32], [33]. Karnik et. al [34] argued that at higher pH, cellulose is also more accessible to react with EPTAC. So, percentage of dye exhaustion can be expected higher in alkaline environment, i.e. higher pH of cationisation of cotton.
The extract from discarded tea is of great importance as a renewable, cheap but efficient source of natural dye for cotton dyeing. Based on our research findings from experimental and computational results, it is clear that the colour fastness of cationised cotton dyed with waste tea extract is good enough for textile applications. It shows even better results in terms of dye uptake and other colorimetric properties than mordanted cotton fabric. The reason is that the functionalisation of cotton surface is substantially improved through cationisation which is highly pH dependent. All cationised dyed fabric samples at pH 12 and 13 show good colour strength among cationiser concentration with 55 g/L shows the highest K/S value (6.63) at pH 13. The FTIR spectra ensures the presence of cationiser in the dyed fabric without changing the fabric’s general properties. Finally, it can be said that the performance of waste tea dyeing is satisfactory and ecofriendly considering no use of metal mordants. Thus, this eco-friendly, efficient and sustainable cotton dyeing process is believed to be practicable at industrial scale. It will also broaden the path to pollution free textile dyeing.
Availability of data and materials
The datasets used and/or analysed during the current study are available from the corresponding author on reasonable request.
Competing interests
The authors declare that they have no competing interests.
Funding
This project is funded by BUTEX Research Grants 2021-2022 (memo no BUTEX/2021/RNE/ 009). The authors sincerely acknowledge University Grants Commission of Bangladesh (UGC) and Bangladesh University of Textiles (BUTEX) for this grant.
Authors' contributions
TH carried out the experiments, interpreted results and proofread, SCD contributed to insightful discussion of results, prepared the figures, wrote the article and proofread. MA carried out a part of experiments and drafted article, MAU conceptualized the idea, improved the quality of the manuscript and supervised the project and SB* carried out the computational studies, interpreted computational results, proofread, substantively revised it and supervised the project. All authors read and approved the final manuscript.
Acknowledgements
Not applicable
- M. Ayele, T. Tesfaye, D. Alemu, M. Limeneh, and B. Sithole, “Natural dyeing of cotton fabric with extracts from mango tree: A step towards sustainable dyeing,” Sustain. Chem. Pharm., vol. 17, no. June, p. 100293, 2020, doi: 10.1016/j.scp.2020.100293.
- K. Kalapriya and H. Gurumallesh Prabu, “Eco-friendly dyeing of textile fabric by natural colorants,” AIP Conf. Proc., vol. 2270, no. November, 2020, doi: 10.1063/5.0019468.
- C. J. Ogugbue and T. Sawidis, “ Bioremediation and Detoxification of Synthetic Wastewater Containing Triarylmethane Dyes by Aeromonas hydrophila Isolated from Industrial Effluent,” Biotechnol. Res. Int., vol. 2011, pp. 1–11, 2011, doi: 10.4061/2011/967925.
- A. Gürses, M. Açıkyıldız, K. Güneş, and M. S. Gürses, “Colorants in Health and Environmental Aspects,” pp. 69–83, 2016, doi: 10.1007/978-3-319-33892-7_5.
- A. Khatri, M. H. Peerzada, M. Mohsin, and M. White, “A review on developments in dyeing cotton fabrics with reactive dyes for reducing effluent pollution,” J. Clean. Prod., vol. 87, no. 1, pp. 50–57, 2015, doi: 10.1016/j.jclepro.2014.09.017.
- M. M. Islam, K. Mahmud, O. Faruk, and S. Billah, “Assessment of environmetal impacts for textile dyeing industries in Bangladesh,” Proc. Int. Conf. Green Technol. Environ. Conserv. GTEC-2011, vol. 2, no. 6, pp. 173–181, 2011, doi: 10.1109/GTEC.2011.6167665.
- A. Kumar and A. Konar, “Dyeing of Textiles with Natural Dyes,” Nat. Dye., 2011, doi: 10.5772/21341.
- H. T. Deo and B. K. Desai, “Dyeing of cotton and jute with tea as a natural dye,” J. Soc. Dye. Colour., vol. 115, no. 7–8, pp. 224–227, 1999, doi: 10.1111/j.1478-4408.1999.tb00360.x.
- S. R. B. Hassan and N. A. B. C. A. Rahim, “Extraction of natural dye from black tea waste for cotton dyeing application,” J. Eng. Sci. Technol., vol. 16, no. 3, pp. 2562–2570, 2021.
- P. S. Vankar, “Low Temperature Optimised Dyeing of Cotton, Wool and Silk with Extract of Camellia Sinensis (Tea Leaves),” J. Text. Eng. Fash. Technol., vol. 2, no. 1, pp. 274–280, 2017, doi: 10.15406/jteft.2017.02.00045.
- M. Moniruzzaman, M. S. Mondal, and M. N. Hossain, “the Influence of Mordant and Mordanting Techniques on Ecofriendly Dyeing of Cotton Fabric By Extracted Used Tea,” Joural Eng. Sci. 09, vol. 09(1), no. 1, pp. 111–117, 2018.
- V. Kaur, A. Nagpal, K. Dhawan, K. Malhotra, and A. K. Bal, “Dyeing of wool with tea as a natural dye,” Colourage, vol. 59, no. 2, pp. 42–48, 2012.
- S. Adeel et al., “Eco-friendly dyeing of cotton fabric with waste tea leaves-based tannin natural dye,” Glob. Nest J., vol. 23, no. 3, pp. 365–369, 2021, doi: 10.30955/GNJ.003456.
- M. Triwiswara and L. Indrayani, “Utilisation of black tea waste as natural batik dyes on cotton and silk,” IOP Conf. Ser. Earth Environ. Sci., vol. 456, no. 1, 2020, doi: 10.1088/1755-1315/456/1/012051.
- K. Htay Win, T. Khaing, H. Htun Naing, and Y. Kay Khaing, “Extraction of Tannin as a Natural Mordant from Tea Leaf for Dyeing of Cotton Cloth”.
- “Viii. flavor of tea,” Food Rev. Int., vol. 11, no. 3, pp. 477–525, 1995, doi: 10.1080/87559129509541056.
- E. A. H. Roberts and R. F. Smith, “Spectrophotometric measurements of theaflavins and thearubigins in black tea liquors in assessments of quality in teas,” Analyst, vol. 86, no. 1019, pp. 94–98, 1961, doi: 10.1039/AN9618600094.
- M. Tutak and N. Ebru Korkmaz, “Environmentally friendly natural dyeing of organic cotton,” J. Nat. Fibers, vol. 9, no. 1, pp. 51–59, 2012, doi: 10.1080/15440478.2011.651830.
- Y. Ding and H. S. Freeman, “Mordant dye application on cotton: optimisation and combination with natural dyes,” Color. Technol., vol. 133, no. 5, pp. 369–375, 2017, doi: 10.1111/cote.12288.
- M. Hashem, P. Hauser, and B. Smith, “Reaction Efficiency for Cellulose Cationization Using 3-Chloro-2- Hydroxypropyl Trimethyl Ammonium Chloride,” Text. Res. J., vol. 73, no. 11, pp. 1017–1023, 2003, doi: 10.1177/004051750307301113.
- S. Acharya, N. Abidi, R. Rajbhandari, and F. Meulewaeter, “Chemical cationisation of cotton fabric for improved dye uptake,” Cellulose, vol. 21, no. 6, pp. 4693–4706, 2014, doi: 10.1007/s10570-014-0457-2.
- A. D. Wolela, “Fashion Technology & Textile Engineering An Overview on Surface Modification of Cotton using Cationic Reagents for Salt-Free or Low Salt Dyeing,” Curr. Trends Fash. Technol. Text. Curr. Trends Fash. Technol. Text. Eng., vol. 5, no. 1, pp. 37–46, 2019, doi: 10.19080/CTFTTE.2019.05.555655.
- M. Oktav Bulut and E. Akar, “Ecological dyeing with some plant pulps on woolen yarn and cationised cotton fabric,” J. Clean. Prod., vol. 32, pp. 1–9, 2012, doi: 10.1016/j.jclepro.2012.03.010.
- T. Note et al., “Formulation Guidelines for CR-2000 Cationic Reagent,” no. 123, pp. 1–2, 2000.
- S. Acharya and N. Abidi, “Chemical cationisation of cotton fabric for improved dye uptake,” pp. 4693–4706, 2014, doi: 10.1007/s10570-014-0457-2.
- S. Edition, W. Koch, and M. C. Holthausen, Wolfram Koch, Max C. Holthausen A Chemist ’ s Guide to, vol. 3. 2001. [Online]. Available: http://doi.wiley.com/10.1002/3527600043
- A. D. Becke, “Density-functional thermochemistry. III. The role of exact exchange,” J. Chem. Phys., vol. 98, no. 7, pp. 5648–5652, 1993, doi: 10.1063/1.464913.
- S. H. Vosko, L. Wilk, and M. Nusair, “Accurate spin-dependent electron liquid correlation energies for local spin density calculations: a critical analysis,” Can. J. Phys., vol. 58, no. 8, pp. 1200–1211, 1980, doi: 10.1139/p80-159.
- M. J. Frisch et al., “Gaussian 09, Revision B.01,” Gaussian 09, Revis. B.01, Gaussian, Inc., Wallingford CT, pp. 1–20, 2009, [Online]. Available: citeulike-article-id:9096580
- R. López, “Capillary surfaces with free boundary in a wedge,” Adv. Math. (N. Y)., vol. 262, pp. 476–483, 2014, doi: 10.1016/j.aim.2014.05.019.
- J. Correia, K. Thaise, R. Fernando, R. Oliveira, C. Valle, and A. B. Valle, “Cationisation of cotton fiber: an integrated view of cationic agents, processes variables, properties, market and future prospects,” vol. 0123456789, 2020, doi: 10.1007/s10570-020-03361-w.
- A. Rehman, M. Irfan, A. Hameed, M. J. Saif, M. A. Qayyum, and T. Farooq, “Chemical-Free Dyeing of Cotton With Functional Natural Dye: A Pollution-Free and Cleaner Production Approach,” vol. 10, no. March, pp. 1–9, 2022, doi: 10.3389/fenvs.2022.848245.
- E. Matyjas-zgondek and T. Design, “COMPARISON OF THE EFFECTS OF THE CATIONIZATION OF RAW, BIO- AND ALKALI-SCOURED COTTON KNITTED FABRIC WITH DIFFERENT SURFACE,” vol. 21, no. 2, 2021, doi: 10.2478/aut-2020-0049.
- Karnik, P.P. (2002). Use of cationised cotton for textile effluency color. Doctoral Thesis. North Carolina University State. Web site: https://repository.lib.ncsu.edu/bitstream/handle/1840.16/2856/etd.pdf?sequence=1.
No competing interests reported.