Item Generation
The water intake questionnaire for kidney stones patients was designed to evaluate cognitive determinants that explain water intake behavior among kidney stones patients. Items were at first generated according to the consulting with 38 kidney stones patients and 12 experts, such as health educator and promoter, nephrology, health policy maker, health care management, nurses, and renal dieticians. As well as, our items pool were developed from the questionnaires of socio-cognitive determinants related to the water intake. [16],[17],[18],[19],[20] Interviews with kidney stones patients and experts were collected by one MSc health education and promotion student in a face-to-face interview style (15–25 min). After explaining the study's subjects, the participants signed consent forms, were interviewed separately by the interviewer. Plus, the interviewers had been trained to ensure that the participants completely realized their words.
The socio-cognitive determinants related to the water intake including; 23 items that measured the five constructs of 1) severity, 2) attitude, 3) subjective norms, 4) self-efficacy, and 5) barriers. Specifically, three items measured the perceived severity (e.g. “Inadequate water intake increases the relapse of kidney stones.”). Four items were designed to measure a positive attitude towards water intake (e.g. “Water intake decreases the relapse of kidney stones.”). Five items were measured subjective norms encouraging for water intake (e.g. “My family encourages me to drinking water”). Five items measured self-efficacy towards water intake (e.g. “I can drink water before feeling thirsty.”). In addition, six items measured the perceived barriers (e.g. “I don't drink water if I don't feel thirsty.”). In order to facilitate subjects responses to the items, all items were scored based on a five-point Likert scale, ranging from 1 (strongly disagree) to 5 (strongly agree).
Validating the Questionnaire: Use of Face, Content and Construct Validities
The validity of the questionnaire has been evaluated using face validity, content validity, and constructs validity.
Face Validity
The qualitative method was used for evaluating face validity. In order to evaluate the face validity, a panel of 12 experts, such as health educator and promoter, nephrology, health policy maker, health care management, nurses, and renal dieticians were face-to-face interviewed to approve the difficulty, relevancy, clarity, and ambiguous of the questionnaire. Comments from the expert group were taken and minor modifications were made to some of the items based on expert opinions.
Content validity
Content Validity Ratio (CVR) and Content Validity Index (CVI) were used to assess content validity. [21] For this purpose, the questionnaire was given to a panel of 12 experts, including from six health educators, two health policymakers, two psychologists, and two urologists. Experts were asked to score each item by the following rankings as "completely necessary", "useful but unnecessary", and "unnecessary". So, the CVR was calculated using the “necessity” and “total item scores”. To assess CVI, experts were asked to answer the following question, "did the items measure what they were intended to measure?" using a 4-point Likert scale in order to evaluate relevancy. A CVI value of each item was computed by dividing the number of experts who rated it as content valid (a ranking of 3 or 4) to the total number of experts. The total CVI value was calculated by dividing the sum of the “3” and “4” scores from each expert to the total number of experts. According to the Lawshe table the minimum value for acceptable CVR and CVI were considered 0.62 and 0.79, respectively. [22]
Construct Validity
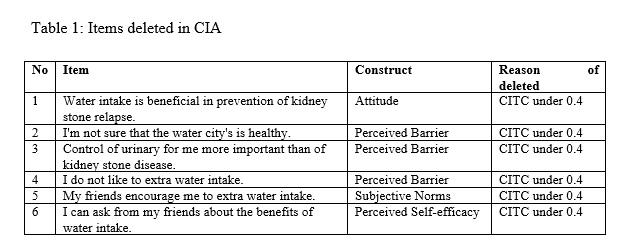
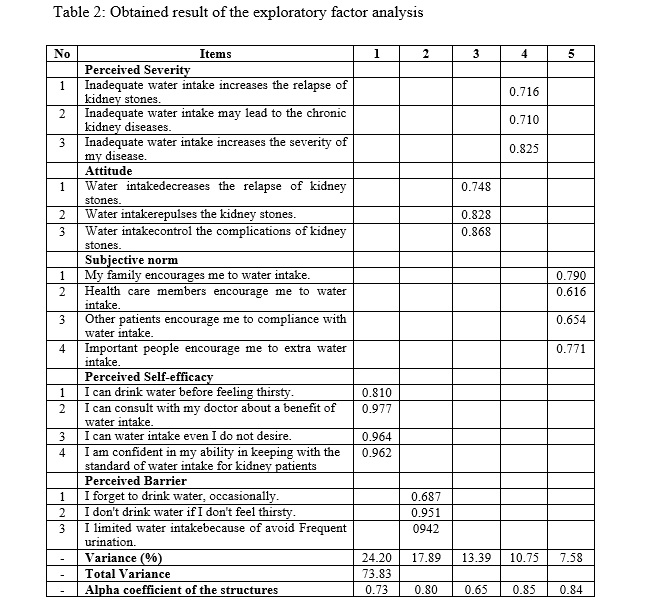
To assess the construct validity, firstly, the Classical Item Analysis (CIA) was used. In the CIA method, the mean, standard deviation, and Corrected Item-Total Correlation (CITC) of each item were calculated. Secondly, the Exploratory Factor Analysis (EFA) with VARIMAX rotation using factor loadings of 0.40 was used to allocate items and to determine the degree which this factor structure replicated the original. The Kaiser–Meyer–Olkin (KMO) measured the sampling adequacy. The factorability of items was evaluated using the Bartlett test. Scree plot was used to confirm the strengths of the exploratory agents. Likewise, to determine agents, the values were equal or greater than 1.3 was considered. [23] The EFA evaluated by conducting a cross-sectional study of 115 kidney stone patients during 2018. Participants selected based on a convenience sampling method among kidney stone patients who referred to Imam Reza Hospital (IRH) in the west of Iran. Only the subjects who diagnosed with the kidney stone were eligible to participate in this study. In addition, participants with incomplete personal or medical information and/or did not formally consent to participate, were excluded. Among the 115 kidney stone patients, 100 patients signed the consent form and voluntarily agreed to participate in our study. Therefore, the response rate was 86.9%.
Internal Consistency
The reliability of the questionnaire was assessed by examining its internal consistency via Cronbach’s alpha. Considering Cronbach’s alpha, a threshold of 0.70 was acceptable.
Statistical Analysis
All data analysis was performed using the statistical package for social sciences (SPSS) (Version 20.0; IBM Corporation, Chicago, USA). A probability value (p-value) of less than 0.05 was considered statistically significant.