The present study compares the pharmacokinetic parameters of the novel P-gp PET tracer [18F]MC225 and the gold standard P-gp tracer (R)-[11C]verapamil in non-human primates, under normal conditions as well as after P-gp inhibition. The data of both tracers were assessed using a 30-min scan duration, to avoid the presence of radio-metabolites. The 1-TCM was the model fitted to the data of both tracers, following the recommendations in previous publications [35, 36]. The kinetic parameters (K1, k2, and VT) of the two tracers in baseline and after-inhibition scans were compared.
We found that in baseline scans, the VT of [18F]MC225 was significantly higher than the VT of (R)-[11C]verapamil. This finding was expected because (R)-[11C]verapamil is considered as a strong substrate of P-gp and, consequently, is quickly transported from brain to blood, resulting in a low brain uptake. Meanwhile, [18F]MC225 is known as a weak substrate of P-gp transporter, thus the baseline concentration of [18F]MC225 inside the brain is higher. This finding is in line with previous studies performed in mice where the whole-brain SUV values of [18F]MC225 were higher than those of (R)-[11C]verapamil [34]. Nevertheless, our study showed that these differences in VT do not arise from differences in K1, since K1 values were not significantly different between tracers at baseline. They are caused by differences in k2 values, which were significantly lower for [18F]MC225 than for (R)-[11C]verapamil.
Administration of the P-gp inhibitor tariquidar increased the VT and K1 values of both tracers in all brain regions, while the efflux constant k2 was decreased for (R)-[11C]verapamil and remained unchanged for [18F]MC225. Since in 1-TCM, VT = K1/k2, the rise in VT after P-gp inhibition in [18F]MC225 scans is mainly caused by the increase in the K1. Based on the Fick principle and Renkin-Crone model [43, 44], K1 depends on the blood flow (F) and the extraction fraction (Eu) of the tracer (K1 = F * Eu). If K1 changes were caused by changes in the blood flow, then k2 values would also be increased (k2 = K1/VT). Since this was not the case, K1 changes seem to be caused by an increase in the extraction fraction of the tracer which can be related to increased permeability of the capillaries due to the P-gp inhibition. On the other hand, the increase in the (R)-[11C]verapamil VT is caused by the increase in K1 and decrease in k2 values. The changes in k2 are negligible (-32%) compared to changes observed in VT (+ 252%) and K1 (+ 136%). Thus, the increase in VT is mainly related to the increase in K1 which is caused by the P-gp inhibition. For this reason, previous publications support the use of K1 as the best parameter to measure the P-gp function at the BBB, confirming the ability of both tracers to detect decreases in the P-gp function at the BBB of non-human primates [35, 36].
Even though both tracers can detect decreases in the P-gp function, the low VT values of (R)-[11C]verapamil at baseline could hamper the quantification of increases in the P-gp function, which would be associated with a further decrease in tracer VT. [18F]MC225 does not show this limitation since it has a higher baseline VT than (R)-[11C]verapamil. Moreover, the ability of [18F]MC225 to measure increases in the P-gp function has been confirmed, since the administration of a P-gp inducer to healthy rats, decreased the VT and K1 values of [18F]MC225 compared to controls [45]. Since K1 values at baseline were similar for both tracers, it could be expected that the (R)-[11C]verapamil K1 may be able to reflect increases in the P-gp function. However, most studies have failed to measure increases in the P-gp function using this parameter. For instance, (R)-[11C]verapamil scans in patients with chronic schizophrenia and major depression did not show significant differences in K1 values compared to controls [46, 47]. Also, (R)-[11C]verapamil was used to detect increased P-gp function in epileptic patients, but the authors did not find any significant differences in the K1 and VT between epileptic brain tissue and its contralateral healthy tissue [48].
The present study also found that K1 and k2 values of (R)-[11C]verapamil were significantly higher than those of [18F]MC225, whereas VT values of both tracers after P-gp inhibition were not significantly different. Since the animals were injected with the same dose of tariquidar (8 mg/Kg) and the same injection protocol was used, similar after-inhibition kinetic values were expected for both tracers, in particular, for K1 and VT. It was expected that after the P-gp inhibition, both tracers could enter the brain regions reaching similar values, as was the case for VT. Thus, one could argue that the K1 of (R)-[11C]verapamil may not be an adequate parameter to measure the P-gp function. The higher K1 values of (R)-[11C]verapamil after P-gp inhibition together with the lack of sensitivity of (R)-[11C]verapamil K1 values to detect increases in P-gp function, may suggest that K1 of (R)-[11C]verapamil is affected by other non-specific factors. This conclusion is supported by in vitro studies which found that [18F]MC225 is more specific for P-gp than (R)-[11C]verapamil [34].
Our results also confirmed the presence of significant regional differences in the K1, VT, and k2 distributions for both tracers at baseline. Overall, the highest baseline VT and K1 values for both tracers were found in cortical regions such as occipital and orbitofrontal cortex, and in the case of [18F]MC225 higher VT and K1 values were also found in the cerebellum. These findings agree with previous publications where the highest uptake at baseline for both tracers in rats was found in frontal cortex and cerebellum [33, 49]. Since at baseline the P-gp function is working adequately, this may suggest that cerebellum and cortical regions display a lower P-gp function compared to other brain regions. However, after the P-gp inhibition, the regional differences between tracers were reduced, indicating that some regions were more affected by P-gp inhibition than others. In (R)-[11C]verapamil the most affected region was the midbrain whereas in [18F]MC225, it was the striatum. For both tracers, the regions less affected by P-gp inhibition were the cerebellum and orbitofrontal cortex. These results also suggest that subcortical areas may have a higher P-gp function than frontal cortex and cerebellum.
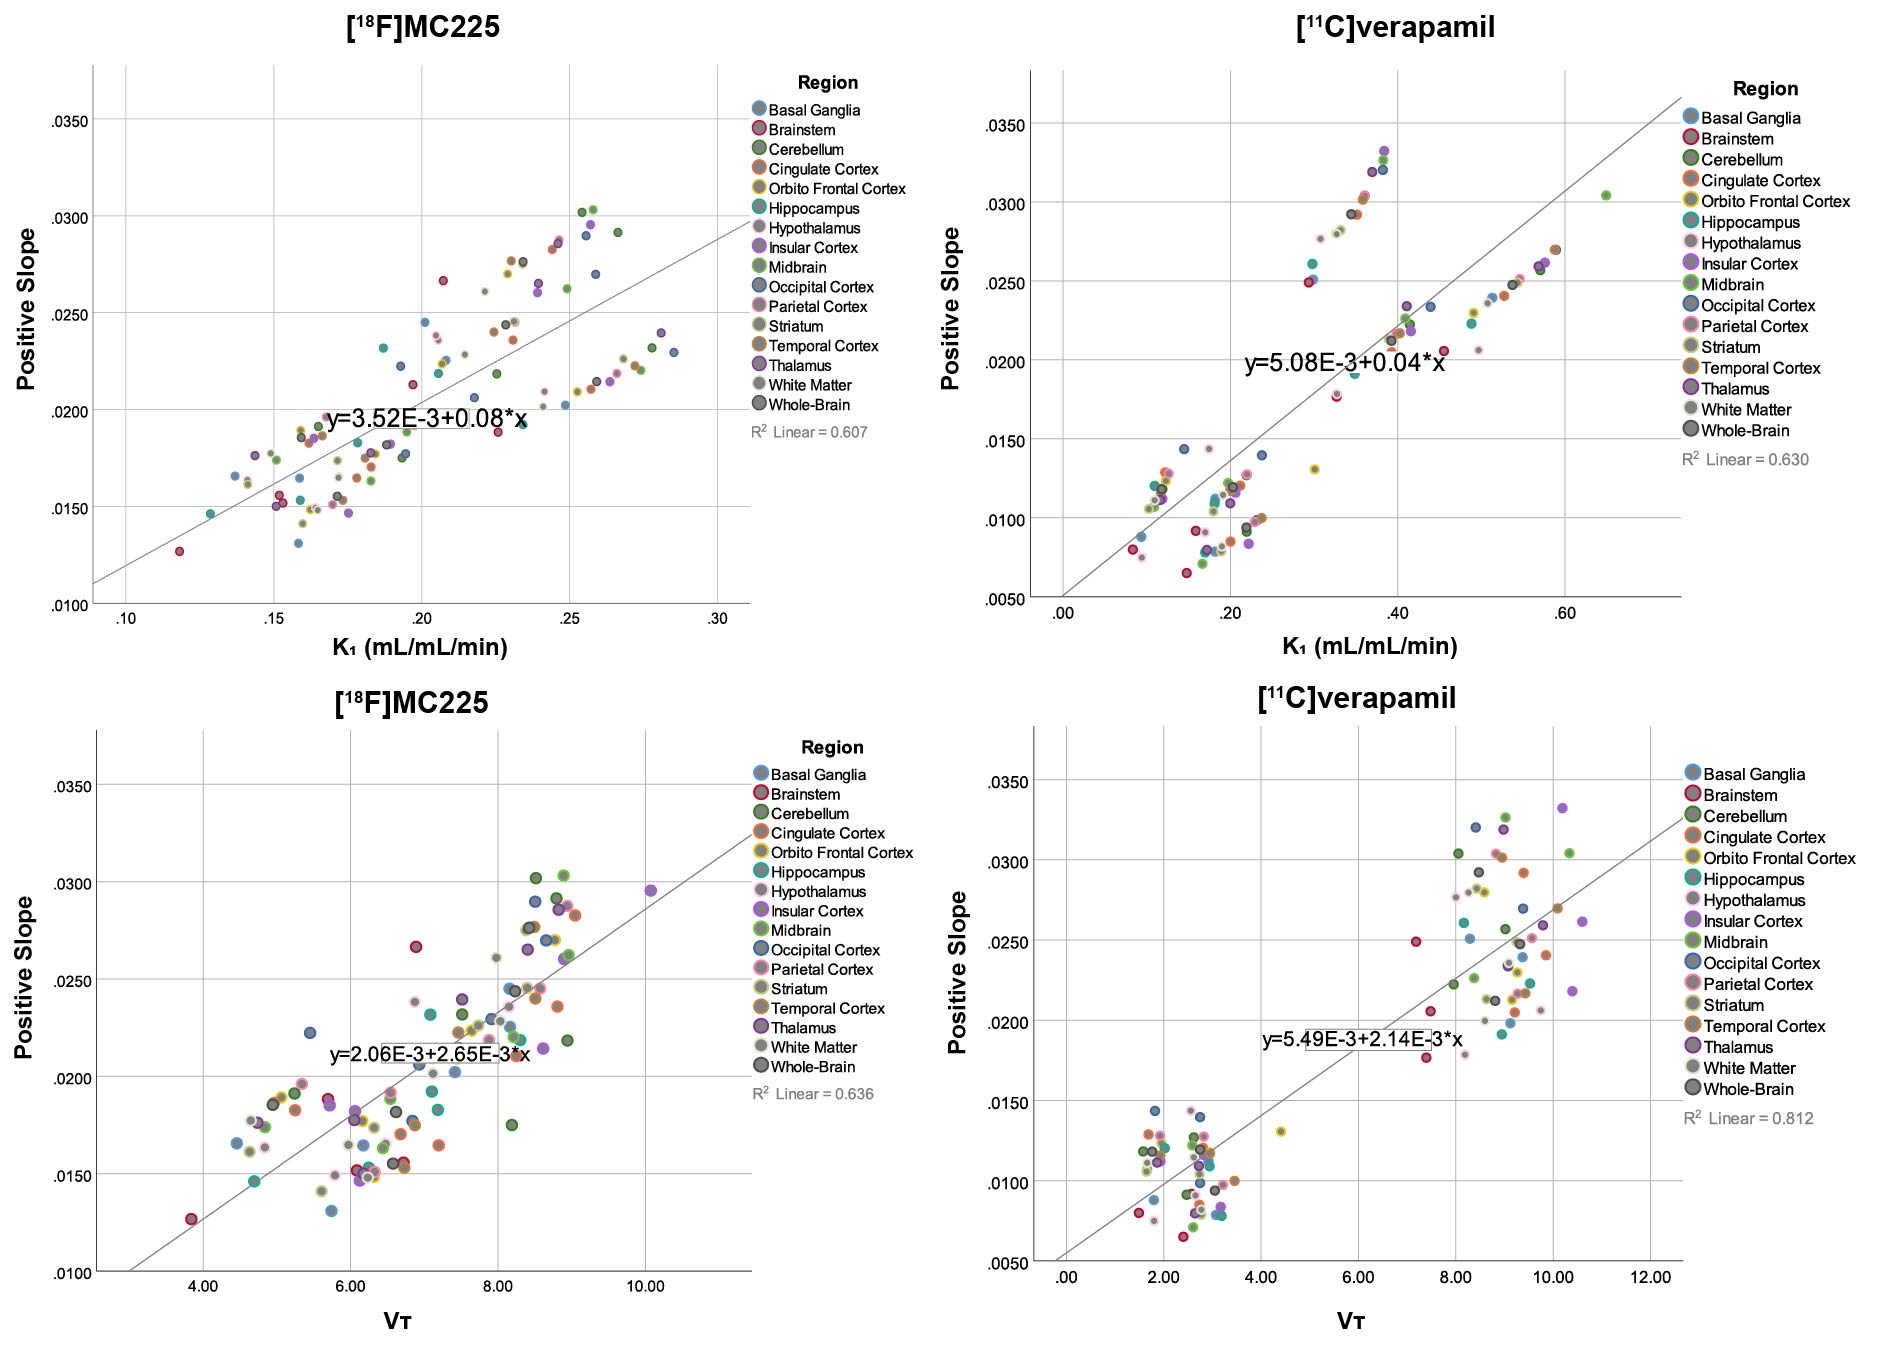
The study also described simplified quantification methods. SUV values do not reach a stable value during the 30-min-PET scan and therefore, they should not be used to estimate the P-gp function. Previous studies suggested the use of the negative slope of the whole-brain SUV-TAC as a simplified parameter to measure the P-gp function [39]. Since the 30-min SUV-TACs of both tracers did not show any washout, the negative slope could not be calculated. Instead, a positive slope using the first 75 seconds of the PET scan, which may be related to the entry of the tracer in the brain, was calculated and correlated to the kinetic parameters. The results showed a good correlation between the positive slope and the K1 and VT of both tracers. Thus, the positive slope may be used as a surrogate parameter to estimate the P-gp function, avoiding the blood sampling and full kinetic analysis. This method may facilitate the assessment of the P-gp function in clinical studies.