HF Doppler observation
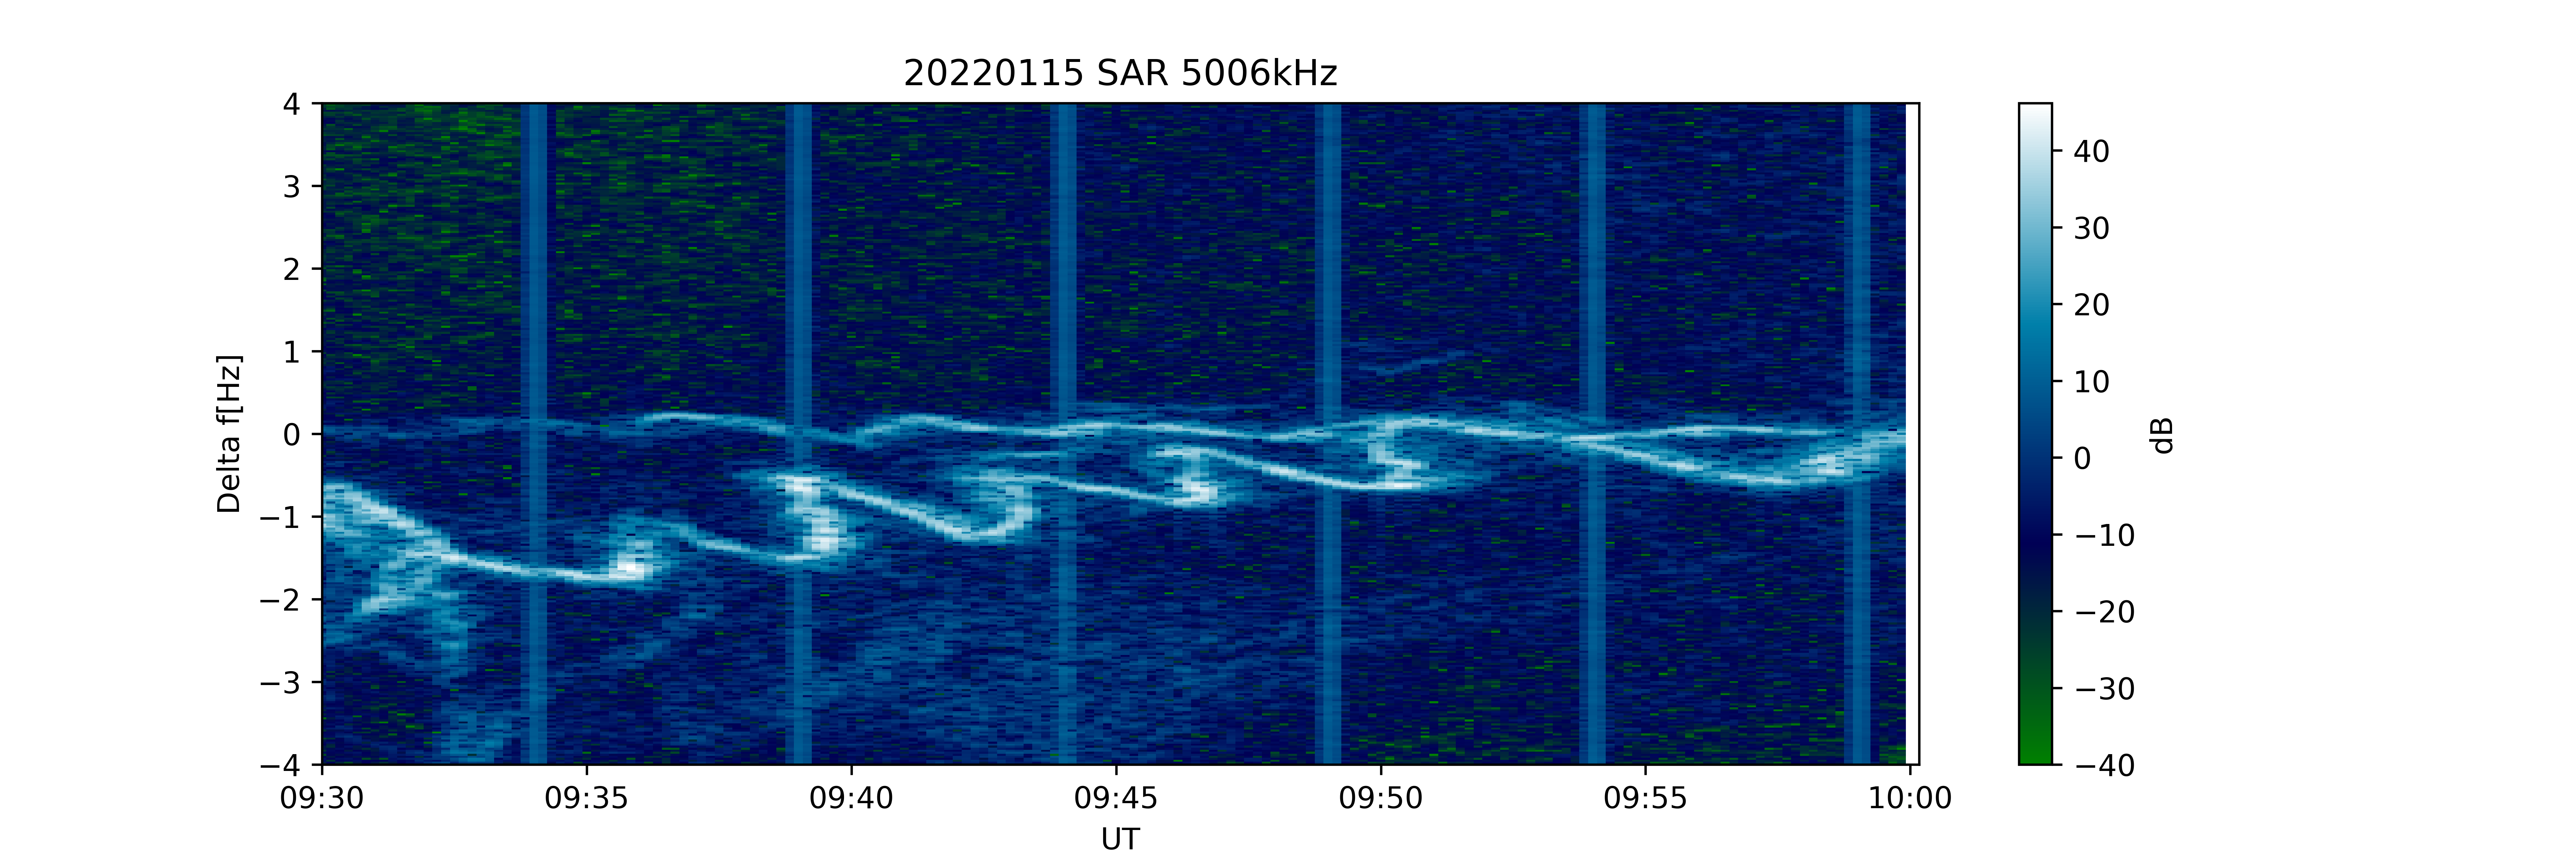
Figure 2(a) shows the dynamic spectrum of the radio wave at the frequency of 5.006 MHz received at Sarobetsu (SAR) observatory for 3 hours from 08:00 to 11:00 UT on January 15, 2022. The color bar shows the intensity of the radio wave. The white line in the plot traces the variation in the Doppler frequency. During two intervals, 08:40 − 09:10 UT and 09:30 − 10:20 UT, clear periodic oscillations of the Doppler frequency were observed. Figure 2(b) shows the enlarged figure of Fig. 2(a) during 09:30 − 10:00 UT, where S-shaped variations in the Doppler frequency were again recognized. Since the arrival time of the tropospheric Lamb wave excited by the eruption was ~ 11 UT in Japan (e.g., Chum et al. 2023), the periodic oscillations occurred prior to the direct arrival of the Lamb waves from the volcano. Figure 2(c) shows the 6.055 MHz data at Sarobetsu in the same format as Fig. 2(a). In this plot, the similar periodic variations in the Doppler frequency are detected during 08:40 − 09:00 UT. However, this observation was made near the local sunset when the electron density was decreasing. Therefore, after 09:15 UT, there was not enough electron density to reflect the radio wave at 6.055 MHz; thus, periodic oscillation was not seen in the second half of the interval. For the same reason, the radio wave at 8.006 MHz was not received at Sarobetsu during this period.
Several data from receiving stations other than Sarobetsu are summarized in Fig. 3. Although the Doppler frequencies were highly disturbed in all the panels, no clear indication of periodic oscillation was recognized. Figure 3(a) shows that the receiver at Oarai (ORI) captured several diffuse Doppler traces of the 3.925 MHz radio wave transmitted from Nemuro, Hokkaido. Although the propagation path between Nemuro and Oarai was close to the path between Chofu and Sarobetsu as depicted in Fig. 1(b), no periodic fluctuation was observed in the data from Oarai. The 5.006 MHz data from Kokura (KOK), Onna (ONA) and Awaji (AWJ), which are respectively plotted in the bottom three panels of Fig. 3, demonstrate that no periodic fluctuation was observed along the propagation path covering the western part of Japan. These results indicate that distinct periodic oscillations were observed only in the path between Chofu and Sarobetsu, where the propagation path was oriented in the north-south direction.
The data from Sarobetsu in Fig. 2 indicate that the periodic oscillations were seen at both the 5.006 MHz and 6.055 MHz frequencies. Since the altitudes of the reflection points of these two radio waves are different, the periodic oscillation was distributed in a certain range of altitude. This implies a possibility of detecting similar periodic variations in the TEC data; thus, TEC data over Japan and Australia have been analyzed and will be presented in the following subsection.
TEC Observation
A number of previous studies reported that TEC disturbances were observed in association with the Tonga eruption. Most of such previous studies, however, have investigated longer-period fluctuations, whose period was longer than 10 minutes (e.g., Lin et al. 2022; Shinbori et al. 2022). Behavior of relatively shorter variations, like the one seen in the HFD data, has not yet been examined. In this study, we have employed 1-Hz sampling TEC data to identify signatures of such short period fluctuations in both hemispheres.
First, we present the TEC data over Australia, which is the magnetically conjugate point of the sensing area of the HFD observation in Japan. Figure 4 shows the temporal variations of TEC data for a 2 hours interval from 08:00 to 10:00 UT, obtained from the BULA station (22.9135oS, 139.9031oE). These time-series data have been derived by applying a high-pass filter with a cutoff frequency of 2.5 mHz. Note that the TEC data shown in Figs. 4(b) (Beidou-04) and 4(c) (Beidou-59) are acquired by navigation signals transmitted from BeiDou satellites in geostationary orbit. The ionospheric pierce points (IPPs) of the ray paths between BULA and three satellites (GPS-31: G-31, BeiDou-04: C-04, and BeiDou-59: C-59) at an altitude of 300 km are plotted in Fig. 5. In this figure, the blue circle shows the geomagnetically conjugate point of the sensing area of the Sarobetsu data (i.e., the midpoint of the propagation path between Chofu and Sarobetsu), which is close to the IPPs of the TEC observations.
Figure 4 shows that 4-minute periodic disturbances occurred from 08:00 to 10:00 UT. In particular, the amplitudes of the periodic fluctuations increased twice in the Beidou-59 time-series, one from 08:30 to 08:50 UT and the other from 09:00 to 09:50 UT. Although the longitude of the IPP of C-59 is located slightly to the east of the conjugate point of the HFD sensing area, it is reasonable to consider that the variations of TEC in the southern hemisphere well correspond to the periodic oscillation of Doppler frequency in the northern hemisphere.
Next, we present the TEC data over Japan. Figure 6 shows plots of the temporal variations of TEC for the same 2 hours interval from the tracks of the IPPs shown in Fig. 7. These TEC time-series data have also been derived by applying a high-pass filter with a 2.5 mHz cutoff frequency. Navigation signals from geostationary satellites were not available for TEC data over Japan because the GEONET do not obtain the BeiDou data. Therefore, all the TEC data in Fig. 6 were obtained from signals of GPS satellites whose IPPs were passing through the sensing area of the HFD observation. The IPP of PRN 27 was located near the observation point between 08:30 and 09:10 UT. During this period, a 4-minute period variation is seen in the corresponding TEC data shown in Fig. 6(c). The IPP of PRN 8 passed near the observation points between 09:30 − 10:00 UT, during which similar TEC disturbances showing 4-minutes periodicity were observed (Fig. 6(a)). Although the amplitude of these TEC variation is rather small and the periodicity of the TEC variation is not always clear, the TEC data over Japan also showed some indications of similar 4-minute variations when the periodic oscillation was detected by HFD. The current comparison with the TEC data indicates that the ionospheric disturbances that caused the periodic oscillation in the HFD observation were also seen in the TEC data in both of the hemisphere. These conjugacy of TEC disturbances in this event has been reported by many previous studies that examined the longer-period fluctuations. The cause of this conjugacy is the propagation of the electric field driven by E-region dynamo along the magnetic field lines. Therefore, the shorter-period disturbances also show the same conjugacy as the longer-period fluctuations.