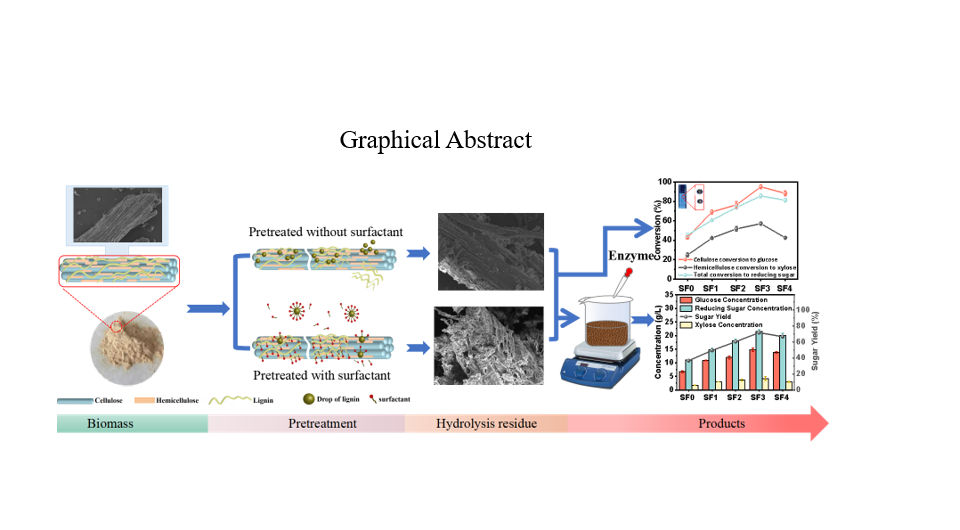
The effect of surfactant-assisted hydrothermal pretreatment on the reducing sugar yield
In hydrothermal pretreatment, the reducing sugars, glucose and xylose production of SF0 were 11.40 g/L, 6.68 g/L and 1.78 g/L, respectively (Fig. 1aI). Moreover, cellulose, hemicellulose and the total conversion of SF0 were just only 42.8%, 24.8% and 45.4%, respectively (Fig. 1aII). With the increase of surfactant concentration, the reducing sugars, glucose and xylose production of LCB increased firstly and then decreased. After adding the surfactants (Tween 40), the reducing sugars production of samples increased from 15.22 g/L to 21.49 g/L (Fig. 1aI), which glucose and xylose production of SF3 reached a maximum value of 14.81 g/L and 4.19 g/L, respectively. Compared to the sample with hydrothermal pretreatment, cellulose, hemicellulose and the total conversion of SF3 increased by 122.2%, 130.2% and 88.8%, respectively (Fig. 1aII). Compared with other pre-treatment conditions (solid-liquid ratio and temperature), the increase of 5-HMF and furfural was not significant with the amount of surfactants increasing, showing that the addition of surfactants had little effect on the production of 5-HMF and furfural (Fig. 1aIII). Besides, the concentration of 5-HMF and furfural increased and then decreased with the increase of surfactant concentration, implying that adding high concentrations of surfactants could effectively inhibit the formation of furfural and 5-HMF, which was considered that the sugar production by surfactant-assisted hydrothermal pretreatment were suitable for further biotransformation.
In surfactant-assisted hydrothermal pretreatment, the reducing sugars concentration increased firstly and then decreased when the solid-liquid ratio changed from 1:4 to 1:12 (Fig. 1bI), and the maximum value reached 21.47 g/L of SL8. The results indicated that suitable liquid phase in hydrolysis mixture was in favor of complete hydrolysis of hemicellulose and amorphous part of cellulose. The solid-liquid ratio decreased from SL4 to SL8 (Fig. 1bII), the concentration of glucose and xylose enhanced rapidly, with the conversion rate of cellulose to glucose increasing from 62.2–95.1% and hemicellulose to xylose from 27.4–57.2%. However, the relatively low solid-liquid ratio decreased the concentration of xylose and glucose (Potumarthi R et al., 2014). Compared with the hydrothermal pretreatment, surfactant-assisted hydrothermal pretreatment achieved the higher cellulose conversion rates at 1:8 solid-liquid ratio (Charnnok B et al., 2020; Yang H et al., 2020). The concentration of furfural and 5-HMF increased and reached maximum on SL6 (Fig. 1bIII), benefiting from the more inhibitors due to the adaptability of the reducing sugar molecule to a larger amount of solvent (Kassanov B et al., 2017). The inhibitors’ concentration of SL4 was less than SL6 owing to the poor hydrolysis efficiency effectively because of the high solid-liquid ratio. With the solid-liquid ratio further decreasing, the concentration of furfural and 5-HMF decreased, indicating that the excessive liquid phase decreased the concentration of reducing sugar produced by hydrolysis, which was limited the further degradation of the reducing sugars to furfural and 5-HMF under surfactant-assisted hydrothermal pretreatment.
The variation of the reducing sugars, glucose and xylose concentrations with temperature during LCB pretreatment was demonstrated in Fig. 1c. As shown in Fig. 1cI. It was observed that the reducing sugars and glucose concentrations increase rapidly from T14 to T18. The reducing sugars concentration reached the maximum value of 21.49 g/L at T18, indicating that the surfactant had a good effect on lignin removal in the temperature range of T14 ~ T18. Meanwhile, the high temperature also promoted the degradation of cellulose and the conversion rate of cellulose to glucose increased from 13.2–95.1% (Fig. 1cII). Glucose concentration decreased slowly from T18 to T22, while the concentration of xylose decreased significantly. At the same time, the concentration of 5-HMF increased rapidly in this interval (Fig. 1cIII). The results showed that excessive pretreatment temperature had a negative impact on surfactant-assisted hydrothermal pretreatment of LCB. In addition, the surfactants were inactivated due to the irreversible degradation of surfactant molecules at high temperatures( Kang X H et al., 2021; Muharja M et al., 2019), resulting in the weakened pre-treatment effect. Therefore, the high yield of the reducing sugar from LCB was obtained by adjusting the temperature around 180°C under surfactant-assisted hydrothermal pretreatment.
Based on the above results, the significant improvement of LCB hydrothermal pretreatment was realized. In hydrothermal pretreatment, high-temperature dissolved lignin droplets and pseudo-lignin droplets formed by the dehydration of partial xylose and glucose deposited on the surface of LCB, hindering the productive adsorption of enzymes and reducing the effectiveness of enzymatic hydrolysis (Nogueira et al., 2022; Wan et al., 2019; Schutyser et al., 2018; Selig et al., 2007). In surfactant-assisted hydrothermal pretreatment, the micelles generated by the surfactants could capture pseudo-lignin precursor substances and inhibit the redeposition of lignin ((Li X X et al., 2022; Nogueira et al., 2022). Moreover, the surfactant enhanced the removal of lignin in hydrothermal pretreatment by interacting with the hydrophobic side of lignin composed of phenyl, CH2, and CH3 through ether bonds. Based on the above results, Surfactant-assisted hydrothermal pretreatment decreased the lignin content and promoted the productive adsorption of more enzymes, which improved the dissociation degree and the conversion rate of cellulose and hemicellulose (Fig. 2).
The influence of surfactant-assisted hydrothermal pretreatment on the QY of by-product CQDs
Figure 3 shows fluorescence intensity and the QY of by-product CQDs under different surfactant-assisted hydrothermal conditions. With the increase of the solid-liquid ratio, the QY of by-product CQDs increased significantly at first and then remains basically flat. When the solid-liquid ratio was 1:6, the QY of by-product CQDs reached the maximum value of 1.9%. The QY of by-product CQDs slightly increased as the pretreatment temperature increased from 140 to 200°C, while the QY of by-product CQDs decreased due to the excessive temperature (220°C). Compared to the sample SF0, the QY of by-product CQDs from surfactant-assisted hydrothermal pretreatment increased significantly, and the QY of by-product CQDs at the surfactant concentration of 0.03g/g reached the maximum value. This was due to the fact that the surfactants facilitated the hydrolysis of LCB to produce reducing sugars, promoting the formation of more CQDs based on the mechanism of hydrolysis pretreatment. Moreover, the surface of CQDs was modified because of the addition of surfactants, which changed the content of functional groups such as carboxyl groups and generated more fluorescent emission groups, resulting in an increase in its fluorescence intensity. However, when the surfactants concentration further increased, the QY of CQDs slightly decreased due to the saturation of the catalytic effect of surfactants on the hydrolysis of LCB. In summary, surfactant-assisted hydrothermal pretreatment was an effective method for co-producing CQDs from LCB.
Response optimization of parameters
In order to obtain the optimal hydrolysis process conditions, response surface optimization was performed. Table 1 summarized the response surface experimental results for the sugars concentration.
Table 1
Response surface experiment design of surfactant-assisted pretreatment.
|
Samples
|
Solid-liquid ratio (g/mL)
|
Temperature (°C)
|
Surfactant concentration
(g/g)
|
Sugars concentration
(g/L)
|
|
1
|
1:8
|
180
|
3%
|
21.52
|
|
2
|
1:10
|
180
|
2%
|
19.44
|
|
3
|
1:8
|
180
|
3%
|
19.45
|
|
4
|
1:6
|
180
|
4%
|
18.61
|
|
5
|
1:8
|
180
|
3%
|
21.43
|
|
6
|
1:10
|
180
|
4%
|
19.08
|
|
7
|
1:8
|
160
|
2%
|
12.04
|
|
8
|
1:8
|
200
|
2%
|
12.86
|
|
9
|
1:8
|
180
|
3%
|
22.17
|
|
10
|
1:8
|
180
|
3%
|
20.62
|
|
11
|
1:6
|
160
|
3%
|
6.16
|
|
12
|
1:6
|
180
|
2%
|
18.32
|
|
13
|
1:8
|
160
|
4%
|
10.17
|
|
14
|
1:6
|
200
|
3%
|
14.84
|
|
15
|
1:8
|
200
|
4%
|
17.02
|
|
16
|
1:10
|
200
|
3%
|
16.44
|
|
17
|
1:10
|
160
|
3%
|
10.52
|
Based on the above results, the pretreatment temperature affected the sugars concentration significantly by surfactant-assisted hydrothermal pretreatment. The surface responses of combination influencing factors between temperature, solid-liquid ratio and surfactant concentration was analyzed (Fig. 4). Based on the analysis of regression model equation, the optimal saccharification conditions for pretreatment were set as follows: solid-liquid ratio of 8.4 g/mL, temperature of 184°C and surfactant concentration of 0.03 g/g. Further experiments were conducted to check the accuracy of the model prediction. The results showed that under the optimal conditions, the sugars concentration was 22.47 g/L, which was agree with the predicted value of the model. The surfactant-assisted hydrothermal pretreatment on rubber wood could obtain the high reducing sugars yield about 74.9% (749.0 mg·g− 1 of biomass), which was higher than that obtained by biomass pretreatment previously studied (Table 2).
Table 2
Comparison of previously study about pretreatment on biomass.
|
Materials
|
Pretreatment method
|
Pretreatment Conditions
|
Reducing sugars yields (%)
|
Ref.
|
|
Rubber wood
|
Hydrothermal Pretreatment
|
200 ℃, 30 min
|
62.1
|
Yin F et al., 2019
|
|
sugarcane tops
|
surfactant-assisted ultrasound pretreatment
|
0.2% Tween 40, 121°C, 60 min, 15 lb pressure for 60 min
|
66.1
|
Sindhu R et al., 2013
|
|
Stalk
|
Surfactant-assisted alkaline pretreatment
|
1% PEG2000, 1% NaOH, 121℃, 10min
|
45.7
|
Cheng X et al., 2022
|
|
oil palm empty fruit bunch
|
Surfactant-assisted pretreatment
|
3% SDS, 180 ℃, 60min
|
4.03
|
Rachmah A N L et al., 2022
|
|
Rubber wood
|
Surfactant-assisted Pretreatment
|
184 ℃, 30 min, 0.03 g/g surfactant
|
74.9
|
This work
|
Characterization of solid residue from LCB powder after pretreatment
The physicochemical structure of rubber wood and treated samples were determined by SEM, FTIR and XRD (Fig. 5). The SEM images show that the samples treated by hydrothermal pretreatment and surfactant-assisted pretreatment displayed swelling and destructive surfaces different from rigid and nonporous surface of control sample (Fig. 5a). Surfactant-assisted pretreatment sample emerged more porous (Fig. 5c), which opened up the fiber structure and facilitates the enzymatic hydrolysis efficiency. After surfactant-assisted pretreatment, the peak intensities at 3000–3800, 1740, 1510 and 1250 cm− 1 were significantly reducing or even disappeared (Fig. 5d), indicating the chemical structures of cellulose and hemicellulose were strongly degraded and lignin was removed (2019; Xingye An et al., 2022; Yin F et al., 2019). Compared with hydrothermal pretreatment, there were no new peaks observed after surfactant-assisted pretreatment, implying that the surfactant pretreatment had no significant influence on the crystal structure of cellulose (Fig. 5e). The CrI of surfactant-assisted pretreatment sample increased from 51.51–68.67%, demonstrating the removal of lignin and the degradation of hemicellulose after the addition of surfactant. Therefore, it was proved that the surfactant had a good effect on lignin removal during the hydrothermal pretreatment.
Mass balances analysis
Carbon mass balances obtained from rubber wood after enzymatic hydrolysis with two pretreatments has been explored, and as displayed in Fig. 6. The yield under two conditions was based on a 15 g of rubber wood, and the recovery of solid residue after pretreatment was based on drying weight. The reducing sugars yield under surfactant-assisted pretreatment contained 0.28 g of glucose, 0.94 g of xylose and 0.79 g of other sugars, and the conversion of cellulose to glucose was 3.6%, and hemicellulose to xylose was 44%. However, the yield of the reducing sugars contained 0.16 g of glucose, 0.65 g of xylose and 0.57 g of other sugars under the hydrothermal pretreatment, and the corresponding conversion was 2.05% and 35.0%, respectively. In the subsequent enzymatic hydrolysis process, rubber wood which pretreated with surfactant possessed a considerable yield of reducing sugars contained about 7.42 g glucose, 2.00 g xylose and 1.33 g other sugars that produced from 15 g rubber wood accompanied by the cellulose conversion rate of 95.1% and hemicellulose conversion rate of 95.4%, which was 122.2% and 41.1% higher than pretreatment without surfactant, respectively. The above results showed that surfactant-assisted pretreatment also had a strong promoting effect on the subsequent enzymatic hydrolysis of LCB.
The universality of the surfactant-assisted pretreatment to biomass
The surfactant pretreatment was utilized to other biomass for the purpose of exploring universal applicability. Polar, bamboo, straw, bagasse and Chinese fir were selected to measure the reducing sugar concentration after the same pretreatment and enzymatic as rubber wood. As shown in Fig. 7, all selected biomasses with surfactant-assisted pretreatment showed various improvements of sugar concentration. The rubber wood had the best lifting effect, and straw was the worst. The increasing effect of the reducing sugars yield of the six biomasses in descending order was rubber wood (36.9%) > polar (28.2%) > bamboo (21.2%) > bagasse (15.6%) > sorghum stalk (13.6%) > Chinese fir (12.9%). Figure 7 (b) shows that rubber wood had the highest total sugars conversion rate after the use of surfactants, while Chinese fir had the lowest total sugars conversion rate. Compare with hydrothermal pretreatment, the total sugars conversion rate of six samples with surfactant-assisted hydrothermal pretreatment increased by 48.2% (rubber wood), 37.5% (polar), 27.6% (bamboo), 25.0% (bagasse), 23.1% (straw) and 18.5% (Chinese fir), respectively. All the results showed that surfactant-assisted hydrothermal pretreatment was a promising method for removing lignin and increasing biomass sugars production.