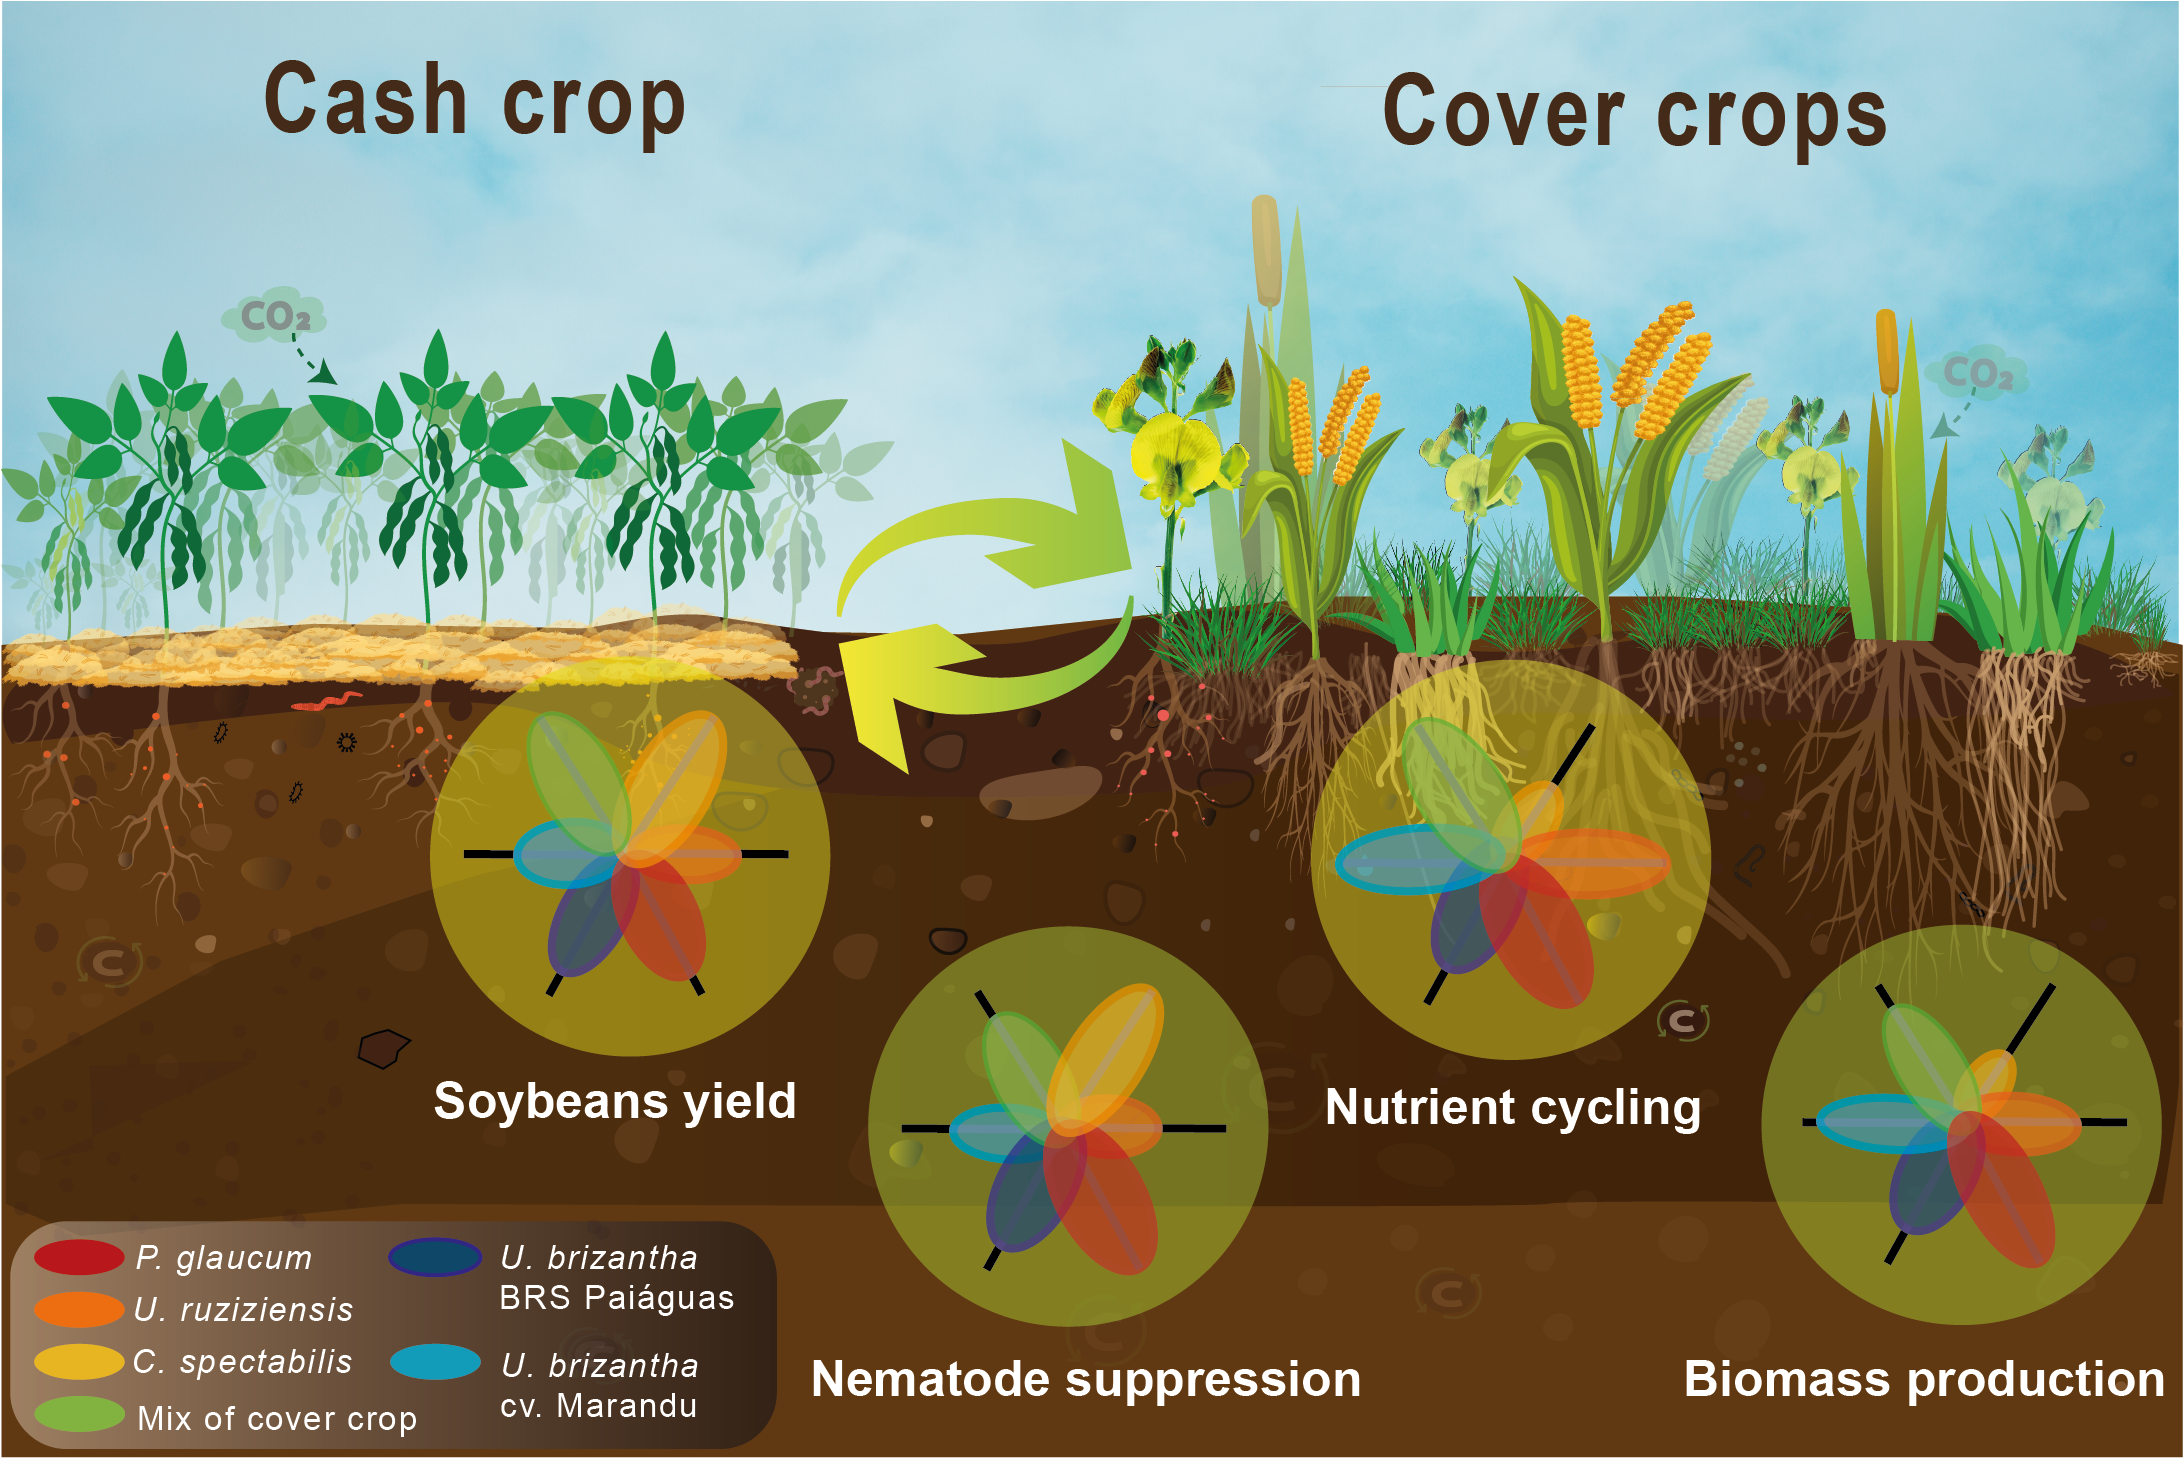
Soybean-maize succession is the main annual cropping system used in Brazilian cerrado. However, due to water restrictions, the cultivation of maize (off-season crop) is not viable after cultivation of late maturing soybean cultivars and/or when late soybean seeding occurs due adverse weather conditions. In this scenario, the use of cover crops can be a good option to benefit soil health and consequently the soybean yield in the next crop season. The objective is to evaluate the effects of cover crops on biomass inputs, nutrient cycling, and nematode control during the off-season in the Cerrado biome. The study was conducted for three years in two locations in the state of Goiás. We evaluated five options of cover crops after soybean cultivation: 1) Mix of cover crops (Pennisetum glaucum, Crotalaria spectabilis, and Urochloa ruziziensis), 2) P. glaucum, 3) C. spectabilis, 4) U. ruziziensis 5) U. brizantha cv. Marandu, and 6) U. brizantha BRS Paiaguás. The results revealed that Pennisetum glaucum (9633 and 6958 kg ha-1 in Montividiu and Rio Verde) and U. brizantha cv. Marandu (8015 kg ha-1 in Rio Verde) produced the highest amount of biomass on average over three years. The treatments soybean/Crotalaria spectabilis and soybean/Pennisetum glaucum reduce the population of the nematodes. However, the use of a more diversified system such as the mix of cover crops provided a greater soybean yield, soil coverage and a high concentration and release of nutrients during the soybean cycle. Being one important alternative for ensure agricultural sustainability in the Cerrado.
Research Article
Cover crop influence on nutrient cycling, nematode population and soybean yield in the Brazilian Cerrado
https://doi.org/10.21203/rs.3.rs-3059496/v1
This work is licensed under a CC BY 4.0 License
Version 1
posted
You are reading this latest preprint version
Brazilian savannah
crop rotation
crop residues
soil health
soybean yield
- The mix of cover crop (P. glaucum, U. ruziziensis and C. spectabilis) promoted nutrient cycling during the soybean cycle.
- The cover crop with the highest decomposition rate was Crotalaria spectabilis.
- The adoption mix of cover crop resulted in greater yield stability (4,023 kg ha-1 for Montividiu - GO and 5,635 kg ha-1 Rio Verde - GO average during 3 years).
- The treatments soybean/Crotalaria spectabilis and soybean/Pennisetum glaucum reduce the population of the nematodes Pratylenchus in the soil and Helicotylenchus in the root.
Soybean production in the Cerrado Biome starts in the 1970s, as a monocropping system (Batlle-Bayer et al. 2010). Since that, advances in crop breeding, liming, fertilization, phytosanitary management, machines, and other technologies transformed the tropical agriculture in the Cerrado region. It allows to move from soybean monoculture to the soybean-maize succession system, which become the predominant system in the region until today (Abrahão and Costa 2018; Spera et al. 2014). However, the continuous cropping system reduces the plant diversity in the system and the stability of soybean production, whereas a more diversified production system with cover crops makes more stable crop yields, better nutrient and water use efficiency, and higher profit margin compared to that of less diversified cropping systems (e.g. soybean-maize) (Liebig et al. 2014; Anghinoni et al. 2021).
Even the benefits of using cover crops are known, the cultivation of cover crops must be done in place of off-season maize, a highly profitable crop, so farmers give priority to maize in their cultivation.
Although it is a profitable system, it is not always possible to use it, because the Brazilian Cerrado has well-defined dry (March to October) and rainy (November to February) periods, and therefore, the maize crop when sown at the end of the rainy season becomes a risk crop. This risk makes the crop unviable when soybean sowing is delayed, or if long-cycle cultivars are used. In this context, the farmer has to search for alternatives to diversify the system and produce biomass to protect and improve the health of the soil for the next soybean crop. Among the possibilities are cover crops.
The use of cover crops increasing the rate of biomass input, nutrient cycling, and reducing nematode infestation (Canalli et al. 2020; Costa et al. 2021; Wang et al. 2022). Biomass acts as a reservoir of nutrients through the decomposition process, which are made available for next crops (Costa et al. 2021). Grasses such as Pennisetum glaucum, Urochloa ruziziensis, and Urochloa brizantha are species with fast establishment, high biomass production, low decomposition speed, and efficient nutrient cycling (Pereira et al. 2016). These factors make them potential crops to be used for biomass contribution (Baptistella et al. 2020), protection of soil surface against erosion, regulate soil temperature (Machiwal et al. 2021) and nutrient cycling (Tanaka et al. 2019). In addition, cover crops such as legumes (e.g. Crotalaria spectabilis) perform biological nitrogen fixation (Kaye et al. 2019) and have a high rate of decomposition and nutrients release (Pacheco et al. 2017). Also, some cover crops such as Pennisetum glaucum and Crotalaria spectabilis have a low nematode reproduction (Dias-Arieira et al. 2021) and therefore are important cultivation alternatives in areas with infestations of Meloidogyne javanica, M. incognita, and Pratylenchus brachyurus (Debiasi et al. 2016).
The benefits of using cover crops varies according to the biological characteristics of the plant species (e.g., high biomass production, N fixers, reduce of the nematode population) and, therefore, the association of more than one species is used within the concept of cover crops mix (Bybee-Finley et al. 2022) to enhance carbon fixation, soil covering, N supply, nutrients cycle, and nematodes control. Furthermore, the use of mix can also enhance soybean yields in the subsequent seasons compared to single cover crops (Volsi et al. 2021).
Therefore, there is a need to understand the potential benefits of cover crop species grown in monoculture or intercropped (mix) in situations where the off-season crop of maize is not viable. The hypothesis to be tested is that the mix of cover crops provides greater benefits to the production system in relation to the cultivation of a single cover specie, and that it can result in higher soybean yields in succession. To test this hypothesis, we conducted a field study in two locations for three years aiming to evaluate the benefits promoted by the mix of cover crops in terms of biomass production, nutrient cycling, and nematode control in comparison with species of cover crops cultivated in monoculture during the off-season in the Brazilian Cerrado.
2.1. Experimental areas
The study was conducted for three years (2018, 2019, and 2020) in two sites, Rio Verde and Montividiu, both in Goiás State, Brazil (Figure 1). The areas are located in the representative regions of highly intensified and technological agriculture in the Cerrado biome.
Figure 1.
Prior to the installation of experiments, samples were collected for soil characterization (Table 1). Soil liming was carried out according to the technical recommendations for the crops.
Table 1.
According to Alvarez et al. (2013), the climate is classified as tropical Savannah with dry winters and rainy summers (Aw), with an average annual precipitation higher than 1.600 mm. Detailed rainfall data of the field studies during the experimental time is showed in the Figure 2.
Figure 2.
2.2. Treatments
The treatments were arranged in randomized strips of 30 m x 50 m in Montividiu, GO, totaling an area of 1,500 m², and 12 m x 80 m in Rio Verde, GO, totaling an area of 960 m². Before the experiment started the areas were composed of conventional soybean-maize system in Montividiu and degraded pasture in Rio Verde, for ten years. The treatments evaluated were soybean production systems (first crop) followed by cover crops (second crop): 1) mix of cover crops (Pennisetum glaucum, Crotalaria spectabilis, and Urochloa ruziziensis), 2) P. glaucum, 3) C. spectabilis, 4) U. ruziziensis, 5) U. brizantha cv. Marandu, and 6) U. brizantha BRS Paiaguás.
Cover crops were always implanted in a crop season prior to soybean sowing. Cover crops were sowed in the following dates: 03/13/2018 (Year 1), 03/09/2019 (Year 2), and 03/17/2020 (Year 3) in Rio Verde and 02/22/2018 (Year 1), 03/08/2019 (Year 2), and 03/11/2020 (Year 3) in Montividiu. Soybean sowing was carried out on 10/19/2018 (Year 1), 11/04/2019 (Year 2), and 10/17/2020 (Year 3) in Rio Verde. In Montividiu, soybean sowing was carried out on 10/27/2018 (Year 1), 10/25/2019 (Year 2), and 11/05/2020 (Year 3). Soybean harvest was carried out on 02/07/2019 (Year 1), 03/12/2020 (Year 2), and 02/19/2021 (Year 3) in Rio Verde and 03/07/2019 (Year 1), 05/03/2020 (Year 2), and 03/16/2021 (Year 3) in Montividiu. In all years and locations, pest, disease and weed management was carried out in accordance with technical recommendations for soybean cultivation.
2.3. Crop management during the experiment
Cover crops species were sown with 8 kg of pure viable seeds per hectare for Urochloa, 20 kg ha-1 for Crotalaria spectabilis, and 20 kg ha-1 for Pennisetum glaucum. The mix of cover crops was sown with 4 kg of pure viable seeds per hectare for U. ruziziensis, 10 kg ha-1 for Pennisetum glaucum, and 10 kg ha-1 for Crotalaria spectabilis (Calegari, 2019).
A mowing management was carried out on cover crops in order to improve soybean sowing conditions. In Rio Verde, forage plants were cut in July 2018 and 2019; in July 2020, the management was carried out using a knife roller. In Montividiu, plants were cut in July 2018 and handled using a knife roller in July 2019 and 2020.
Cover plants were dried on 09/29/2018 (Year 1), 09/05/2019 (Year 2) and 08/14/2020 (Year 3) in Rio Verde and 09/26/2018 (Year 1), 20/09/2019 (Year 2), and 30/09/2020 (Year 3) in Montividiu. Desiccations were carried out with the application of the herbicide glyphosate at a dose of 2.5 liters per hectare.
The varieties used for soybeans were Syn15640 IPRO - 444,444 plants/ha (year 1), Brasmax Bônus IPRO - 288,888 plants/ha (year 2), and Brasmax Foco IPRO - 311,110 plants/ha in Rio Verde. In Montividiu, ST 797 IPRO - 311,110 plants/ha (year 1) and Brasmax Bônus IPRO - 288,888 plants/ha were used (year 1 and 2).
In Rio Verde, GO, fertilization was carried out every year during the cover crops seeding with 96 kg ha-1 of N, 40 kg ha-1 P2O5, and 40 kg ha-1 of K2O. In addition, a broadcast fertilization was carried out with 8 kg ha-1 of N, 80 kg ha-1 of P2O5, and 80 kg ha-1 of K2O, targeting the entire production system and always carried out before soybean sowing during the dry season. In Montividiu, GO, fertilization was carried out in all years during cover crops seeding with 108 kg ha-1 of N; in addition, a broadcast fertilization was carried out with 100 kg ha-1 of P2O5 and 120 kg ha-1 of K2O.
2.4. Plant and soil evaluations and analyses
The biomass was measured at 117 days, 121 days, and 113 days after sowing in 2018, 2019, and 2020, respectively, in Rio Verde. The same evaluation took place at 135 days, 121 days, and 116 days after sowing in 2018, 2019, and 2020, respectively, in Montividiu. Cover crops were cut close to the ground with a mechanical cutter in an area of 1 m², with 12 replications per treatment. Biomass was weighed to obtain fresh weight. Later, a subsample was removed and placed in a paper bag, weighed, and taken to a forced air circulation oven (55 °C) for 72 h. The dehydrated material was weighed to obtain the proportion of dry matter to later obtain the amount of biomass in kg of dry mass ha-1.
The speed of cover crops decomposition was evaluated after desiccation only in Rio Verde using the method of decomposition bags called “litter bags" (Silva et al. 1997; Espíndola et al. 1998). These bags are made of nylon with an internal area of 0.06 m² and filled with a known mass of cover crops at the time of desiccation. Eight bags were randomly distributed in each treatment for each collection during each time (30, 60, 90, and 120 days after desiccation - DAD). The material collected from litter bags, at each collection time, was dried in an oven with forced air circulation at 55 °C for 72 hours and weighed to determine the remaining biomass by the difference between initial and final mass. Afterwards, plant material samples were ground to determine the concentration of macronutrients (Malavolta et al. 1997).
The nematode population was evaluated 70 days after soybean sowing through soil and root collection following the methodology of Jenkins (1964) and Coolen (1972). In Montividiu, this assessment was carried out in the second and third years; in Rio Verde, in the first and third years.
The evaluation of soybean plant population was performed by counting plants at harvest in two three-meter-long soybean lines with 12 replications per treatment. Soybean productivity was determined by harvesting two lines of soybeans, three meters in length, also with 12 repetitions per treatment. A sample of grains from each replication was taken to determine the thousand-grain mass, and yield data were adjusted to a moisture content of 13%. The number of pods per plant was evaluated from five plants randomly collected in each sampled area.
2.5. Data analysis
All data analyses were performed using the R software v. 3.5.1 (R Core Team, 2018). Outliers were checked using function outlierTest from the package car (Lenth 2020). Normality of residuals and homogeneity of variance were verified using the Shapiro-Wilk and Bartlett tests, respectively.
Soybean grain yield data were analyzed using a linear model considering the effects of treatment, year, location, and the interaction between them. The significance of effects was determined by Analysis of Variance considering type 3 error. Means were obtained by least squares using the emmeans package (Lenth 2020) and compared by Tukey test (p<0.05).
For analysis of nematode population data, the function glm.nb from the MASS package (Venables and Ripley, 2002) was used due to the negative binomial distribution of nematode count values. The fixed effects of year, treatment, location, and the interaction between treatment and location were considered. Means were obtained using the least squares method and compared using Tukey test at 5% probability.
In order to analyze the speed of decomposition and understand the dynamics of nutrient release, data were submitted to analysis of non-linear models using the nlme package. The non-linear model used was: b = y - a * d, where b is a biomass at time d, y is the initial amount of biomass or nutrient, a is the rate of decomposition of the biomass, and d is the number of days (Thomas and Asakawa 1993). Treatments were considered as a random effect on the parameters y and a. Thus, the biomass half-life was calculated. It expresses the period required for half of the residues to decompose or for half of the nutrients contained in the residues to be released. The half-life was calculated using the formula: HL = 0.693/a (Thomas and Asakawa 1993). Analysis of variance was performed for the variables y, a, and HL considering the effects of treatment and year and their interaction and comparing means according to the other variables.
3.1. Biomass of cover crops
In Montividiu, the cover crop with the highest biomass production was P. glaucum with 9145 (first year), 12237 (second year) and 7517 kg ha-1 (third year) (Table 2). In Rio Verde, U. brizantha cv. Marandu presented the highest biomass values during the three years: 7527, 10619 and 5248 kg ha-1 (Table 2). C. spectabilis showed the lowest biomass values in both locations during the three years, with a biomass production around 3100 kg ha-1 in the average of years and locations (Table 2).
Table 2.
3.2. Plant population
Soybean plant population for the first and second year did not differ between treatments in Montividiu. In the third year, the highest soybean population was in the succession soybean/U. ruziziensis and soybean/C. spectabilis. In Rio Verde, the highest soybean population occurred in succession soja/C. spectabilis (440833 plants ha-1), without differing from the Mix of cover crops (423940 plants ha-1) in the first year. In the third year, the highest soybean population was obtained when sown over the biomass of P. glaucum (321945 plants ha-1).
In the three-year average, the largest soybean population was obtained over U. ruziziensis (224815 plants ha-1), without differing from C. spectabilis (221667 plants ha-1) and the Mix of cover crops (215759 plants ha-1) in Montividiu. In the case of Rio Verde, the highest soybean population was observed when sown in biomass of P. glaucum (318897 plants ha-1), without differing from the Mix of cover crops (307382 plants ha-1) (Table 3).
Table 3.
3.3. Grain yield
During the two cropping seasons studied, the soybean/mix of cover crop treatment maintained the highest soybean yields (3763 and 3926 kg ha-1) in Montividiu. In the first year in Rio Verde the highest soybean yield was in the soybean/C. spectabilis treatment (5720 kg ha-1), however, in the next two cropping seasons soybean (cash crop) maintained the highest yields in the soybean/mix of cover crop treatment (6259 and 5520 kg ha-1) (Table 4).
Crop succession (soybean/ mix of cover crop and soybean/C.spectabilis were characterized by the highest yields of soybean (cash crop). The soybean/mix of cover crop treatment accounted higher yield for 15% and 12% in Montividiu and 32% in the first and second cropping seasons. The soybean/C. spectabilis treatment accounted for higher yield 32% and 15% in the first and second cropping seasons and soybean/mix of cover crop 15% and 11% for the second and third cropping seasons. In the average at both locations, higher yields were also observed under the soybean/mix of cover crop treatment for all as growing season, compared to all other treatments.
Table 4.
3.4. Nematode population
In Rio Verde, the lowest soil Pratylenchus populations were in the treatments soybean/U. brizantha BRS Paiaguás, soybean/C. spectabilis and soybean/P. glaucum. In Montividiu, the lowest Helicotylenchus nematode populations in the root was for the soybean/P. glaucum treatment (Table 5).
Table 5.
3.5. Decomposition rate of cover crop biomass
The mix of cover crops presented the longest half-life (218 days) in the decomposition of biomass in Rio Verde. The other treatments did not differ among themselves. In the second year, there was no difference in the half-lives of cover crop biomass, which averaged 106 days. For the third year, the treatments with the longest half-life were P. glaucum (156 days) and U. brizantha BRS Paiaguás (169 days). The shortest half-life in biomass decomposition was for C. spectabilis (81 days) (Figure 3).
Figure 3.
3.5. Amount of N, P, and K contained in biomass of cover crops
The highest phosphorus (P) values were found in the initial biomass of U. brizantha cv. Marandu (2.58 kg ha-1), U. ruziziensis (2.67 kg ha-1) and the mix of cover crops (2.50 kg ha-1), and the smallest values were for C. spectabilis (1.73 kg ha-1). As for P release from biomass, the longest half-life was for the biomass of U. ruziziensis (437 days) and the shortest was for C. spectabilis (119 days).
The highest accumulation of nitrogen (N) in the initial biomass was for U. brizantha cv. Marandu (30 kg ha-1), not differing from C. spectabilis (27.5 kg ha-1). As for half-life, the cover crops showed no differences in the release of N from the biomass. For potassium (K), the highest amounts were for the biomass of U. ruziziensis (42.2 kg ha-1), U. brizantha cv. Marandu (37.6 kg ha-1), mix of cover crops (39.2 kg ha-1), and P. glaucum (38.8 kg ha-1). As for the half-life of K, the biomass of U. brizantha BRS Paiaguás presented the highest half-life values (18.6 days), and the lowest half-life value was for the biomass of C. spectabilis (12.5 days) (Figure 4).
Figure 4.
The peak of potassium release by cover crops occurred in the first 30 DAD (Figure 5), releasing about 35 to 50 kg ha-1 of K for the three years of the study. In the first year, the biomass of U. ruziziensis released the highest amount of K at 30 DAD: about 30 kg ha-1; the smallest amount of K released was 10 kg ha-1 at 30 DAD in the biomass of the mix.
In the second year, the mix of cover crops and P. glaucum biomasses released the most K: around 45 kg ha-1 in the first 30 DAD. In the third year, the mix of cover crops biomass still had with the highest K release at 30 DAD (35 kg ha-1). The lowest K release by cover crops for all treatments was during the first year of the study.
Figure 5.
4.1 Production of cover crop biomass, decomposition, and nutrient cycling
In the Cerrado region, the residual crop on the soil surface are between 2380 to 10640 kg ha− 1 (Soares et al. 2019). In the present study Pennisetum glaucum (9633 kg ha− 1) showed a biomass production close to the highest amount of crop residues on the soil surface. P. glaucum is commonly used cover crop in the Cerrado region due to its rapid growth and establishment and high biomass production. In addition, this plant is tolerant to water stress, which makes it promising for use in the Cerrado, particularly as a second crop, given the context of climate change, marked by rainfall instability and extreme temperatures (Oliveira et al. 2017).
The amount of precipitation after cover crop sowing (off-season), the length of the plant life cycle and permanence of the biomass on the soil are predominant factors for the production and maintenance of the soil cover. This is an advantage of the mix of cover crops, because, combining crop residues from different plant species can change the carbon and N content (Zeng et al. 2010). With the diversification of species, the plasticity of the system increases since the adversities of climate and management occur in a variable way in each season. This variation may favor a specie in detriment of another but always results in soil covering and protection with biomass production (Soares et al. 2019). Converging with the results of this study where the mix of cover crops produced 56% (Rio Verde) and 37% (Montividiu) higher biomass than C. spectabilis in monoculture.
C. spectabilis showed the lowest biomass production in both locations (3388 kg ha− 1 in Montividiu and 2939 kg ha− 1 in Rio Verde). This indicates that this cover crop does not provide a good soil cover when grown alone. However, this specie add other benefits to the system, such as nematode control, biological N fixation (34.10 kg ha− 1) (Mendonça et al. 2016), and faster nutrient cycling (T1/2 lifetimes shorter than 20 days for N, P, K, Ca and Mg) (Pacheco et al. 2017). The half-life values observed in this study differ from the values reported by Pacheco et al. (2017). This may be attributed to the high temperatures and precipitation that occurred in the state of Piauí (northern Cerrado region) after the desiccation of cover crops and the sowing of cash crops. These factors potentially enhance the activity of microorganisms involved in biomass decomposition and nutrient release.
The maintenance of biomass on the soil surface is mainly controlled by the decomposition rate will depend on biotic and abiotic factors such as plant composition (C/N ratio, cellulose, lignin, and hemicellulose content), soil biological activity, and the edaphoclimatic conditions, mainly temperature and rainfall (Carvalho et al. 2010). The low C/N ratio of legume crops (usually smaller than 20) favors rapid decomposition compared to grass crops (C/N ratio greater than 25) (Weiler et al. 2019). Thus, due to the higher decomposition of the legume residues (half-life time of 82 days), the soil will be unprotected at the beginning of the cash crop development, but the nutrients will be quickly released and become available for cash crop. On the other hand, as grasses have slow decomposition rates (half-life of 120 days on average), the residues remain longer in the soil, with a slower release of nutrients, which occurs over time as observed in this study and by Pereira et al. (2016).
In the first and third year, C. spectabilis decomposition was faster than the other plants and the mix of cover crops had 3200 kg ha− 1 up to 30 days after desiccation (DAD). The mix of cover crops showed high biomass persistence since, at 120 days, 25% (first year), 40% (second year), 50% (third year) of its biomass had been decomposed. Regardless of rainfall volumes that occurred after desiccation, the biomass of the mix of cover crops was efficient in covering the soil, persisting until the time of soybean harvest. The permanence of biomass residues in the soil is important for the consolidation and maintenance of no-tillage systems since a proper management of this system depends on the production and maintenance of residues on the soil surface (Macedo 2009). However, as Wanic et al. (2019) argued, one should consider the quality of the residue and not only its quantity and permanence in the soil, so much so that in our study, soybean over the biomass of C. spectabilis and the mix of cover crops (C. spectabilis, U. ruziziensis, and P. glaucum) stood out as for productivity in the two evaluated sites for having other benefits such as greater nutrient cycling (shorter half-life time of C. spectalibis) and biological N fixation of the legumes.
The highest release of potassium (K) by cover crops was in the second year of the study, coinciding with the highest rainfall (1,710 mm) during the cycle since K can easily be carried away by rainwater after the rupture of the plasma membranes of dried plants (Taiz et al. 2017). The K has a shorter half-life (average of 20 days) because it is not part of any organic structure or molecule in the plant, being mostly found as free cations with high mobility (Miguel et al. 2018). Mix of cover crops and P. glaucum accumulated the most K during the three years, releasing about 45 kg ha− 1 of K in the first 30 DAD. This fast release of K (75%) is in line with reports of authors such as Mendonça et al. (2015) and Xavier et al. (2017). Similar to the results found by Volf et al. (2023) in the Cerrado in Mato Grosso state, who found 35 kg ha− 1 in a soybeans/U. ruziziensis system and 41 kg ha− 1 pasture (30 moth)/soybean. The amount of K accumulated by the cover crops corresponds to about 60% of the recommended maintenance K fertilization for soybean (Sousa and Lobato 1996). During all three years, K was the nutrient in greatest quantity in the cover crop biomass, compared to N and P, showing that this is one of the nutrients most absorbed and accumulated in the plant tissue of the cover crops in the Cerrado region (Torres et al. 2005; Boer et al. 2007; Pariz et al. 2011; Pereira et al. 2016; Pacheco et al. 2017). The contribution of K released from residues is between 80 and 90% for grasses and legumes and, therefore, plays an important role in the cycling of this nutrient in the system (Santos et al. 2008). As observed in the results of this study, the mix of cover crops stood out for the release of K to the soil.
Among the cover crops studied, the mix treatment showed a longer half-life compared to the C. spectabilis biomass at 172, 282, and 15.5 DAD for N, P, and K, respectively. Since at 120 DAD, 34% of the N and 20% of the P of the biomass were released; thus, the mix of cover crops has the potential to provide nutrients for subsequent cultures.
4.2 Influence of cover crop biomass on the establishment and productivity of the soybean crop, and nematode population
The desiccation of cover crops must be carried out at least 25 days before soybean sowing to avoid sowing problems and ensure a good plant establishment (Constantin et al. 2009). In the first year in Rio Verde, the interval between desiccation and sowing was 20 days. Therefore, the largest soybean population occurred in the treatment with C. spectabilis, which produced less biomass (Tables 2 and 3). In other sowing situations, among different years and locations, the interval between desiccation and sowing was sufficient to avoid seeding problems in situations with greater amounts of biomass. In any case, the biomass heterogeneity of the mix cover crop, as it contains three species of plants, did not compromise the establishment of soybeans since the population of soybean plants was among the highest over the years in both locations (Table 3).
In addition, the mix of cover crop and C. spectabilis favored soybean yield increase (about 10.9% in Montividiu and 17.8% in Rio Verde). Pacheco et al. (2017) and Cordeiro et al. (2021), who reported an increase of 42.2% in soybean yield under biomass of C. spectabilis and 9.3% when using the biomass of the mix of cover crops. Despite the high efficiency in biological fixation of soybean, it may respond positively to the availability of N during the initial stages of growth (Brancalião et al. 2015).
According to Anghinoni et al. (2021), in the Cerrado region, a more diversified rotation system with soybeans (first crop) and cover crops (second crop) for two years and one year of U. ruziziensis resulted in higher soybean yields (28.2% higher) compared to the traditional soybean-maize cropping system. These results not only indicate the efficiency saved for growing soybeans under a diversified sequence, but also that crop rotations potentially reduce the inherent risks associated with production under conditions of stress or uncertainty, contributing to the stability of food production. Thus, soybeans grown after cover crop biomass have equal or greater profit, due to the better soil health provided by the cover crop biomass.
An important aspect to consider when choosing cover crops are plants that suppress the population of soil pests and diseases, in particular the presence of nematodes. Aquino (2021) found lower population densities of Helicotylenchus sp. on systems with C. spectabilis. In this study, the smallest population was on the biomass of P. glaucum. Debiasi et al. (2016) found that the cultivation of C. spectabilis in the off-season, in monoculture or intercropped with P. glaucum cultivar ADR 300, reduced the population of P. brachyurus by about 59.7% compared to with the treatment without cover crops. It also reduced damage to soybeans, increasing productivity by approximately 58.6%. However, in this study, there was no significant difference between treatments in relation to nematode control.
Based on the results found in this study, during the three years and in the two study sites, the mix of cover crop can be recommended as a cover crop option. Thus, plant species with different ecological functions can satisfy different system requirements, thus, attending most of the soil functions. The cover crops enhance soil health, sustaining its multi-functionality (Schipanski et al. 2014). The promotion of soil multifunctionality is linked to the production and maintenance of biomass of cover crops in the soil. Thus, cover crops play a crucial role in the Cerrado ecosystem, mainly in soil functions such as: water flow regulation, maintenance of soil structure, cycling of organic matter, nutrient cycling and habitat for soil organisms all these functions associated result in increased crop production.
Overall, cover crops can serve as a powerful management tool in preserving soil health in Brazilian agricultural systems, and their importance and potential are increasingly recognized by farmers. Despite the existing challenges, this topic has attracted the attention of researchers and companies. As a result, it is reasonable to expect that existing knowledge will expand exponentially through collaborative efforts involving academics, companies, consultants, and farmers. By disseminating information and promoting education, we remain optimistic that the adoption of cover crops will become a standard management practice on Brazilian farms.
The use of a more diversified system such as the mix of cover crops (Pennisetum glaucum, Crotalaria spectabilis and Urochloa ruziziensis) provided a greater soil coverage and a high concentration and release of nutrients during the soybean cycle.
P. glaucum presented the highest biomass contribution during the three years in Montividiu and the highest average soybeans yield, highlighting the potential use of this cover crop in the Cerrado. The mix of cover crops and P. glaucum are alternatives in situations of late sowing, as they ensure biomass input and consequently higher soybean (cash crop) yield.
Acknowledgements
To CAPES (Coordination for the Improvement of Higher Education Personnel) and 2022/16368-6, São Paulo Research Foundation (FAPESP) for granting the scholarship to the 1st author. To CNPq (National Council for Scientific and Technological Development) for supporting the research. MRC thanks the CNPq for his Research Productivity Fellowship (311787/2021-5). To GAPES (Grupo Associado de Pesquisa do Sudoeste Goiano) and to the Kompier Group for their total technical support in conducting the experiment. To the Instituto Federal Goiano for the financial support to conduct and publish this study.
- Alvares CA, Stape JL, Sentelhas PC, DE Moraes Goncalves JL, Sparovek G (2013) Köppen’s climate classification map for Brazil. Meteorologische Zeitschrift 6:711–728. 10.1127/0941–2948/2013/0507.
- Abrahão GM, Costa MH (2018) Evolution of rain and photoperiod limitations on the soybean growing season in Brazil: The rise (and possible fall) of double-cropping systems. Agricultural and Forest Meteorology 32–45. https://doi.org/10.1016/j.agrformet.2018.02.031
- Aquino NCR (2021) Cover crops and biocontrol agents in nematode management in corn. Dissertation, University of Instituto Federal Goiano.
- Anghinoni G, Anghinoni FBG, Tormena CA, Braccini AL, Mendes I de C, Zancanaro L, Lal (2021) Conservation agriculture strengthen sustainability of Brazilian grain production and food security. Land Use Policy 108. https://doi.org/10.1016/j.landusepol.2021.105591
- Anghinoni G, Anghinoni FBG, Tormena CA, Braccini AL, Mendes IC, Zancanaro L, Lal R (2021). Conservation agriculture strengthens sustainability of Brazilian grain production and food security. Land Use Policy 108.https://doi.org/10.1016/j.landusepol.2021.105591
- Batlle-Bayer L, Batjes NH, Bindraban PS (2010) Changes in organic carbon stocks upon land use conversion in the Brazilian Cerrado: A review. Agricultura, Ecossistemas e Meio Ambiente 137: 47–58. https://doi.org/10.1016/j.agee.2010.02.003
- Baptistella J.LC, Andrade SAL, Favarin JL, Mazzafera P (2020) Urochloa in Tropical Agroecosystems. Frontiers in Sustainable Food Systems 4. https://doi.org/10.3389/fsufs.2020.00119
- Bybee-Finley KA, Cordeau S, Yvoz S, Mirsky SB, Ryan MR (2022) Finding the right mix: a framestudy for selecting seeding rates for cover crop mixtures. Ecological Applications 32. https://doi.org/10.1002/eap.2484
- Calegari A (2019) Soil Alive - Technical guide to cover crops integrated soil management (in Portuguese). 5th edition, Uberaba, MG, pp 40
- Canalli LBS, Santos JB, Silva AA, Muchinski A, Feliciano E, Penteado D (2020) Residues Decomposition in Crop Rotations under No-till System. Brazilian Archives of Biology and Technology 63. http://dx.doi.org/10.1590/1678-4324-solo-2020190609
- Carvalho AM, Dantas RA, Coelho MC, Lima WM, Souza JPSP, Fonseca OP, Guimarães Júnior R (2010). Hemicellulosis, cellulose and lignin contents in cover crops with potential for no-tillage system in Cerrado, Brazil. Planaltina-DF, Brazil: Embrapa (15)
- Chieza ED, Guerra JGM, Araújo E da S, Espíndola JA, Fernandes RC (2017) Yield and economic aspects of corn and sunn hemp intercropped in different seeding intervals under organic management. Revista Ceres 64:189–196. https://doi.org/10.1590/0034-737x201764020012
- Constantin J, Oliveira JR, Inoue RSD, Arantes JGZD, Cavalieri SD (2009) Desiccation systems prior to no-till corn sowing and weed control. Ciência Rural 39: 971–976. 10.1590/S0103-84782009000400003
- Costa NR, Andreotti M, Crusciol CAC, Pariz CM, Bossolani JW, Pascoaloto IM, da Rocha Lima CG, dos Santos Batista Bonini C, de Castilhos AM, Calonego JC (2021) Soybean yield and nutrition after tropical forage grasses. Nutrient Cycling in Agroecosystems 121: 31–49. https://doi.org/10.1007/s10705-021-10157-2
- Costa RRGF, Costa KAP, Severiano EC, Santos CB, Rocha AFS, Souza WF, Brandstetter EV, Castro WA (2017) Nutrients cycling and accumulation in pearl millet and Paiaguas palisadegrass biomass in different forage systems and sowing periods. Revista Scientia Agraria 18:166–178. http://dx.doi.org/10.5380/rsa.v18i4.51955
- Cordeiro CFS, Echer FR, Araujo FF (2021) Cover crops impact crops yields by improving microbiological activity and fertility in sandy soil. Journal of Soil Science and Plant Nutrition 21:1968–1977. 10.1007/s42729-021-00494-0
- Darapuneni M., Idowu OJ, Sarihan B, DuBois D, Grover K, Sanogo S, Djaman K, Lauriault L, Omer M, Dodla S (2021) Growth characteristics of summer cover crop grasses and their relation to soil aggregate stability and wind erosion control in arid southwest. Applied Engineering in Agriculture 1:11–23. https://doi.org/10.13031/aea.13972
- Debiasi H et al (2016) Cultural practices during the soybean off-season for the control of Pratylenchus brachyurus (in Portuguese, with English abstract). Pesquisa Agropecuária Brasileira 51:1720–1728. 10.1590/S0100-204X2016001000003
- Dias-Arieira CR, Ceccato FJ, Marinelli EZ, Vecchi LB, Arieira G de O, Santana-Gomes SdeM (2021) Correlations between nematode numbers, chemical and physical soil properties, and soybean yield under different cropping systems. Rhizosphere 19:100386. https://doi.org/10.1016/j.rhisph.2021.100386.
- Kaye J, Finney D, White C, Bradley B, Schipanski M, Alonso-Ayuso M, et al (2019) Managing nitrogen through cover crop species selection in the U.S. mid-Atlantic. PLoS ONE 4:e0215448. https://doi.org/10.1371/journal. pone.0215448
- Liebig MA, Archer DW, Tanaka DL (2014) Crop diversity effects on near-surface soil condition under dryland agriculture. Applied and Environmental Soil Science. https://doi.org/10.1155/2014/703460
- Machiwal D, Kumar S, Islam A, Kumar S, Jat SR, Vaishnav M, Dayal D (2021). Evaluating effect of cover crops on runoff, soil loss and soil nutrients in an Indian arid region. Communication In Soil Science and Plant Analysis 52. 10.1080/00103624.2021.1892726
- Mendonça VZ, Mello LMM, Andreotti M, Pariz CM, Yano EH, Pereira FCBL (2015). Nutrient release from forage straw intercropped with maize and followed by soybean. Revista Brasileira de Ciência do Solo 39. https://doi.org/10.1590/01000683rbcs20150666
- Mendonça ES, Lima PC, Guimarães GP, Moura WM, Andrade FV (2017). Biological Nitrogen Fixation by Legumes and N Uptake by Coffee Plants. Rev Bras Cienc Solo. https://doi.org/10.1590/18069657rbcs20160178
- Miguel ASDCS, Pacheco LP, Carvalho IC, Souza ED, Feitosa PB, Petter FA (2018) Phytomass and nutrient release in soybean cultivation systems under no-tillage. Pesquisa Agropecuária Brasileira 53:1119–1131. 10.1590/s0100-204x2018001000005
- Mitchell JP, Sherestha A, Matheusis K, Scow KM, Southard RJ, Haney RL, Schimidt R, Munk DS, Hor wath WR (2017) Cover cropping and no-tillage improve soil health in an arid irrigated cropping system in California’s San Joaquin Valley, USA. Soil Tillage Res., 165:325. Doi: 10.1016/j.still.2016.09.001
- Holmes AA, Thompson AA, Wortman SE (2017) Species-specific contributions to productivity and weed suppression in cover crop mixtures. Agronomy Journal 6:2808–2819. https://doi.org/10.2134/agronj2017.06.0309
- Hunt ND, Hill JD, Liebman M (2019) Cropping System Diversity Effects on Nutrient Discharge, Soil Erosion, and Agronomic Performance. Environmental Science and Technology 53, 1344–1352. https://doi.org/10.1021/acs.est.8b02193
- Jayme-Oliveira A, Ribeiro Junior WQ, Ramos MLG, Ziviani AC, Jakelaitis A (2017) Amaranth quinoa, and millet growth and development under different water regimes in the Brazilian Cerrado. Pesq. Agropec. Bras. 52:561–571. 10.1590/s0100-204x2017000800001
- Ferreira PS, Torres JLR, Santos MAD, Parolini, RO, Lemes, EM (2020) Host suitability of cover crops for Meloidogyne javanica and M. incognita. Nematology 6:659–666. https://doi.org/10.1163/15685411-00003329
- Ferreira ACB, Borin ALDC, Lamas FM, Ferreira GB, Resende AV (2022) Exchangeable potassium reserve in a Brazilian savana Oxisol after nine years under different cotton production systems. Scientia Agricola 79:4. 10.1590/1678-992X-2020-0339
- Pacheco LP, Miguel ASDCS, Silva RG, Souza ED, Petter FA, Kappes C (2017) Biomass yield in production systems of soybean sown in succession to annual crops and cover crops. Pesquisa Agropecuária Brasileira, Brasília, 8:582–591. 10.1590/s0100-204x2017000800003
- Pacheco LP, Monteiro MMS, Petter FA, Nóbrega JCA, Santos AS (2017) Biomass and nutrient cycling by cover crops in Brazilian Cerrado in the State of Piaui. Rev. Caatinga 30:13–23. http://dx.doi.org/10.1590/1983-21252017v30n102rc
- Pereira FCBL, de Mello LMM, Pariz CM, de Mendonça VZ, Yano ÉH, de Miranda EEV, Crusciol CAC (2016) Autumn maize intercropped with tropical forages: Crop residues, nutrient cycling, subsequent soybean and soil quality. Revista Brasileira de Ciência do Solo 40: 1–20. https://doi.org/10.1590/18069657rbcs20150003
- Pinheiro J, Bates D, DebRoy S, Sarkar D (2021) R Core Team. _nlme: Linear and Nonlinear Mixed Effects Models_. R package version 3.1–152. <URL:https://CRAN.R-project.org/package=nlme>.
- Spera SA, Cohn AS, VanWey LK, Mustard JF, Rudorff BF, Risso J, Adami M (2014) Recent cropping frequency, expansion,and abandonment in Mato Grosso, Brazilhad selective land characteristics. Environmental Research Letters 9:6. https://iopscience.iop.org/article/10.1088/1748-9326/9/6/064010
- Schipanski ME, Barbercheck M, Douglas MR, Finney DM, Haider K, Kaye JP, Kermanian AR, Mortensen DA, Ryan MR, Tooker J et al (2014) A framework for evaluating ecosystem services provided by cover crops in agroecosystems. Agric. Syst. 125:12–22. https://doi.org/10.1016/j.agsy.2013.11.004
- Soares D dos S, Ramos MLG, Marchão RL, Maciel GA, Oliveira AD, Malaquias JV, Carvalho AM (2019) How diversity of crop residues in long-term no-tillage systems affect chemical and microbiological soil properties. Soil Till. Res. 194, 104316. 10.1016/j.still.2019.104316
- Sousa DMG, Lobato E (1996) Correção do solo e adubação da cultura da soja. Planaltina (in Portuguese)
- Taiz L, Zeiger E, Møller IM, Murphy A (2017) Fisiologia e desenvolvimento vegetal, 6th Edn. Porto Alegre: Artmed.
- Tanaka KS, Crusciol CAC, Soratto RP, Momesso L, Costa CHM, Franzluebbers AJ, Junior AO, Calonego JC (2019) Nutrients released by Urochloa cover crops prior to soybean. Nutr Cycl Agroecosyst 113:267–281. https://doi.org/10.1007/s10705-019-09980-5
- Venables WN, Ripley BD (2002) Modern Applied Statistics with S. Fourth Edition. Springer, New York. ISBN 0-387-95457-0
- Volsi B, Higashi GE, Bordin I, Telles TS (2021). Production and profitability of diversified agricultural systems. Anais da Academia Brasileira de Ciências 93. https://doi.org/10.1590/0001-3765202120191330
- Volf MR, Crusciol CAC, Kovar JL, Rosolem CA (2023) Unraveling the role of ruzigrass in soil K cycling in tropical cropping systems. Nutr Cycl Agroecosyst https://doi.org/10.1007/s10705-023-10283-z
- Xavier FAS, Oliveria JIA, Silva MR (2017). Decomposition and nutriente release dynamics of shoot phytomass of cover crops in the Recôncavo Baiano. Revista Brasileira de Ciência do Solo 41. https://doi.org/10.1590/18069657rbcs20160103
- Wang T, Jin, H, Kasu BB, Jacquet J, Kumar S (2019) Soil Conservation Practice Adoption in the Northern Great Plains: Economic versus Stewardship Motivations. Journal of Agricultural and Resource Economics 44:404–421. 10.22004/ag.econ.287989
- Wang KH, Waisen P, Leslie AW, Paudel R, Meyer SLF, Hooks CRR (2022) Relationships between Soil Tillage Systems, Nematode Communities and Weed Seed Predation. Horticulturae 8:425. https://doi.org/10.3390/horticulturae8050425
- Weiler DA, Giacomini SJ, Aita C, Schmatz R, Pilecco GE, Chaves B, Bastos LM (2019) Summer cover crops shoot decomposition and nitrogen release in a no-tilled sandy soil. Revista Brasileira de Ciência do Solo 43. 10.1590/18069657rbcs20190027
- Weil R, Kremen A (2007) Thinking across and beyond disciplines to make cover crops pay. Science of Food and Agriculture 87:551–557. 10.1002/jsfa.2742
- Zeng DH, Mao R, Chang SX, Li LJ, Yang D (2010) Carbon mineralization of tree leaf litter and crop residues from poplar-based agroforestry systems in Northeast China: a laboratory study. Agric. Ecosyst. Environ. Appl. Soil Ecol. 44:133–137. https://doi.org/10.1016/j.apsoil.2009.11.002.
Table 1. Initial chemical characteristics of the soil in the experimental of the two study site locations

P: Phosphorous (Melich I); H + Al: Potential acidity; K+: Potassium; Ca2+: Calcium; Mg2+ Magnesium; OM: organic matter; V: base saturation.
Table 2. Total biomass of cover crops (kg ha-1) evaluated at the time of pre-sowing desiccation of soybeans in Montividiu and Rio Verde
|
Year1 |
Treatment |
Location |
|
|
Montividiu |
Rio Verde |
||
|
1 |
Mix of cover crops 2 |
4845 bc |
6176 ab |
|
Pennisetum glaucum |
9145 a |
6470 ab |
|
|
Crotalaria spectabilis |
2899 c |
2451 c |
|
|
Urochloa ruziziensis |
5729 b |
5650 b |
|
|
Urochloa brizantha cv. Marandu |
5743 b |
7527 a |
|
|
Urochloa brizantha BRS Paiaguás |
5286 b |
6875 ab |
|
|
2 |
Mix of cover crops |
7938 bc |
9269 ab |
|
Pennisetum glaucum |
12237 a |
9563 ab |
|
|
Crotalaria spectabilis |
5992 c |
5544 c |
|
|
Urochloa ruziziensis |
8822 b |
8743 b |
|
|
Urochloa brizantha cv. Marandu |
8836 b |
10619 a |
|
|
Urochloa brizantha BRS Paiaguás |
8379 b |
9968 ab |
|
|
3 |
Mix of cover crops |
3217 bc |
4548 ab |
|
Pennisetum glaucum |
7517 a |
4842 ab |
|
|
Crotalaria spectabilis |
1271 c |
823 c |
|
|
Urochloa ruziziensis |
4101 b |
4022 b |
|
|
Urochloa brizantha cv. Marandu |
4115 b |
5899 a |
|
|
Urochloa brizantha BRS Paiaguás |
3658 b |
5248 ab |
|
|
Mean |
Mix of cover crops |
5334 bc |
6665 ab |
|
Pennisetum glaucum |
9633 a |
6958 ab |
|
|
Crotalaria spectabilis |
3388 c |
2939 c |
|
|
Urochloa ruziziensis |
6218 b |
6138 b |
|
|
Urochloa brizantha cv. Marandu |
6232 b |
8015 a |
|
|
Urochloa brizantha BRS Paiaguás |
5774 b |
7363 ab |
|
1Year 1= 2018; Year 2 = 2019; Year 3= 2020; 2 Mix of cover crops (Urochloa ruziziensis, Pennisetum glaucum, and Crotalaria spectabilis); means followed by the same letter in columns do not differ from each other by Tukey test at 5% probability; the comparison was performed between treatments within each year and location.
Table 3. Population of soybean plants (plants ha-1) sown on cover crop biomass for three years and in two locations (Montividiu and Rio Verde).
|
Year¹ |
Treatment |
Location |
|
|
Montividiu |
Rio Verde |
||
|
1 |
Mix of cover crops2 |
234722 |
423940 ab |
|
Pennisetum glaucum |
230556 |
411111 bc |
|
|
Crotalaria spectabilis |
235556 |
440833 a |
|
|
Urochloa ruziziensis |
243611 |
405278 bc |
|
|
Urochloa brizantha cv. Marandu |
219091 |
386667 cd |
|
|
Urochloa brizantha BRS Paiaguás |
235555 |
379722 d |
|
|
2 |
Mix of cover crops2 |
192000 |
215152 |
|
Pennisetum glaucum |
180833 |
223637 |
|
|
Crotalaria spectabilis |
173333 |
200556 |
|
|
Urochloa ruziziensis |
185000 |
213333 |
|
|
Urochloa brizantha cv. Marandu |
183889 |
221667 |
|
|
Urochloa brizantha BRS Paiaguás |
190556 |
217222 |
|
|
3 |
Mix of cover crops2 |
220556 b |
283056 bc |
|
Pennisetum glaucum |
215000 b |
321945 a |
|
|
Crotalaria spectabilis |
256111 a |
232500 c |
|
|
Urochloa ruziziensis |
245833 a |
286667 bc |
|
|
Urochloa brizantha cv. Marandu |
210278 b |
288056 b |
|
|
Urochloa brizantha BRS Paiaguás |
217500 b |
276667 bc |
|
|
Mean |
Mix of cover crops2 |
215759 abc |
307382 ab |
|
Pennisetum glaucum |
208796 bc |
318897 a |
|
|
Crotalaria spectabilis |
221667 ab |
301296 bc |
|
|
Urochloa ruziziensis |
224815 a |
301759 bc |
|
|
Urochloa brizantha cv. Marandu |
204419 c |
298796 bc |
|
|
Urochloa brizantha BRS Paiaguás |
214537 abc |
291204 c |
|
1Year 1= 2018; Year 2 = 2019; Year 3= 2020; 2Mix of cover crops (Urochloa ruziziensis, Pennisetum glaucum and Crotalaria spectabilis); means followed by the same capital letter in columns do not differ from each other by Tukey test at 5% probability; the comparison was performed between treatments within each year and location. Absence of letters means that there were no significant differences between treatments.
Table 4. Soybean yield (kg ha-1) on biomass of different cover crops during three years in two locations (Montividiu and Rio Verde).
|
Year¹ |
Treatment |
Location |
|
|
Montividiu |
Rio Verde |
||
|
1 |
Mix of cover crops2 |
3763 a |
5125 b |
|
Pennisetum glaucum |
3488 ab |
3469 c |
|
|
Crotalaria spectabilis |
3432 ab |
5720 a |
|
|
Urochloa ruziziensis |
3163 ab |
3938 c |
|
|
Urochloa brizantha cv. Marandu |
3290 ab |
3888 c |
|
|
Urochloa brizantha BRS Paiaguás |
3201 b |
3976 c |
|
|
2 |
Mix of cover crops2 |
3926 abc |
6259 a |
|
Pennisetum glaucum |
4428 a |
5615 b |
|
|
Crotalaria spectabilis |
3791 bc |
5538 b |
|
|
Urochloa ruziziensis |
3694 bc |
5298 b |
|
|
Urochloa brizantha cv. Marandu |
3431 c |
5575 b |
|
|
Urochloa brizantha BRS Paiaguás |
4183 ab |
5738 ab |
|
|
3 |
Mix of cover crops2 |
4380 |
5520 ab |
|
Pennisetum glaucum |
4698 |
5767 a |
|
|
Crotalaria spectabilis |
4736 |
4918 c |
|
|
Urochloa ruziziensis |
4514 |
5228 bc |
|
|
Urochloa brizantha cv. Marandu |
4718 |
4884 c |
|
|
Urochloa brizantha BRS Paiaguás |
4444 |
5230 bc |
|
|
Mean |
Mix of cover crops2 |
4023 ab |
5635 a |
|
Pennisetum glaucum |
4205 a |
4951 b |
|
|
Crotalaria spectabilis |
3986 ab |
5392 a |
|
|
Urochloa ruziziensis |
3791 b |
4821 b |
|
|
Urochloa brizantha cv. Marandu |
3813 b |
4782 b |
|
|
Urochloa brizantha BRS Paiaguás |
3943 ab |
4981 b |
|
1Year 1= 2018; Year 2 = 2019; Year 3= 2020; 2Mix of cover crops (Urochloa ruziziensis, P. glaucum and C. spectabilis); means followed by the same capital letter in columns do not differ from each other by Tukey test at 5% probability; the comparison was performed between treatments within each year and location.
Table 5. Nematode population Pratylenchus in 100 cm³ of soil and Pratylenchus in the root (10 g root), Helicotylenchus in 100 cm³ of soil, and Helicotylenchus in the root (10 g root) during the soybean harvest under cover crop biomass in Montividiu and Rio Verde.
|
Variable |
Treatment |
Location |
|
|
Montividiu |
Rio Verde |
||
|
Pratylenchus soil2 (100 cm³ soil) |
Mix of cover crops ¹;³ |
0.00 |
1.41 ab |
|
Pennisetum glaucum 4 |
0.00 |
3.62 d |
|
|
Crotalaria spectabilis 4 |
0.00 |
4.89 cd |
|
|
Urochloa ruziziensis ³ |
0.00 |
1.91 a |
|
|
Urochloa brizantha cv. Marandu4 |
0.00 |
9.36 bc |
|
|
Urochloa brizantha BRS Paiaguás |
8.2 |
1.91 d |
|
|
Pratylenchus root (10 g root) |
Mix of cover crops ¹ |
112.0 |
134.8 |
|
Pennisetum glaucum |
47.3 |
513.2 |
|
|
Crotalaria spectabilis |
70.5 |
290.3 |
|
|
Urochloa ruziziensis |
150.3 |
496.5 |
|
|
Urochloa brizantha cv. Marandu |
132.9 |
253.3 |
|
|
Urochloa brizantha BRS Paiaguás |
147.2 |
153.0 |
|
|
Helicotylenchus soil (100 cm³ soil) |
Mix of cover crops ¹ |
165.3 |
176.5 |
|
Pennisetum glaucum |
92.9 |
118.7 |
|
|
Crotalaria spectabilis |
161.0 |
219.1 |
|
|
Urochloa ruziziensis |
171.4 |
218.4 |
|
|
Urochloa brizantha cv. Marandu |
85.9 |
136.4 |
|
|
Urochloa brizantha BRS Paiaguás |
111.5 |
92.1 |
|
|
Helicotylenchus root (10 g raiz) |
Mix of cover crops ¹ |
4.9 ab |
29.2 |
|
Pennisetum glaucum |
0.52 b |
15.3 |
|
|
Crotalaria spectabilis |
37.4 a |
9.4 |
|
|
Urochloa ruziziensis |
22.4 a |
26.2 |
|
|
Urochloa brizantha cv. Marandu |
1.8 ab |
16.8 |
|
|
Urochloa brizantha BRS Paiaguás |
4.1 ab |
19.1 |
|
1Mix of cover crops (U. ruziziensis, P. glaucum and C. spectabilis); means followed by the same letter in the column do not differ from each other by Tukey test at 5% probability; the comparison was performed between treatments within the same variable. 2Values of Pratylenchus on the soil are exponential, being ³e-04 and 4 e-05.
No competing interests reported.