Patient informations and NP tissue samples collection
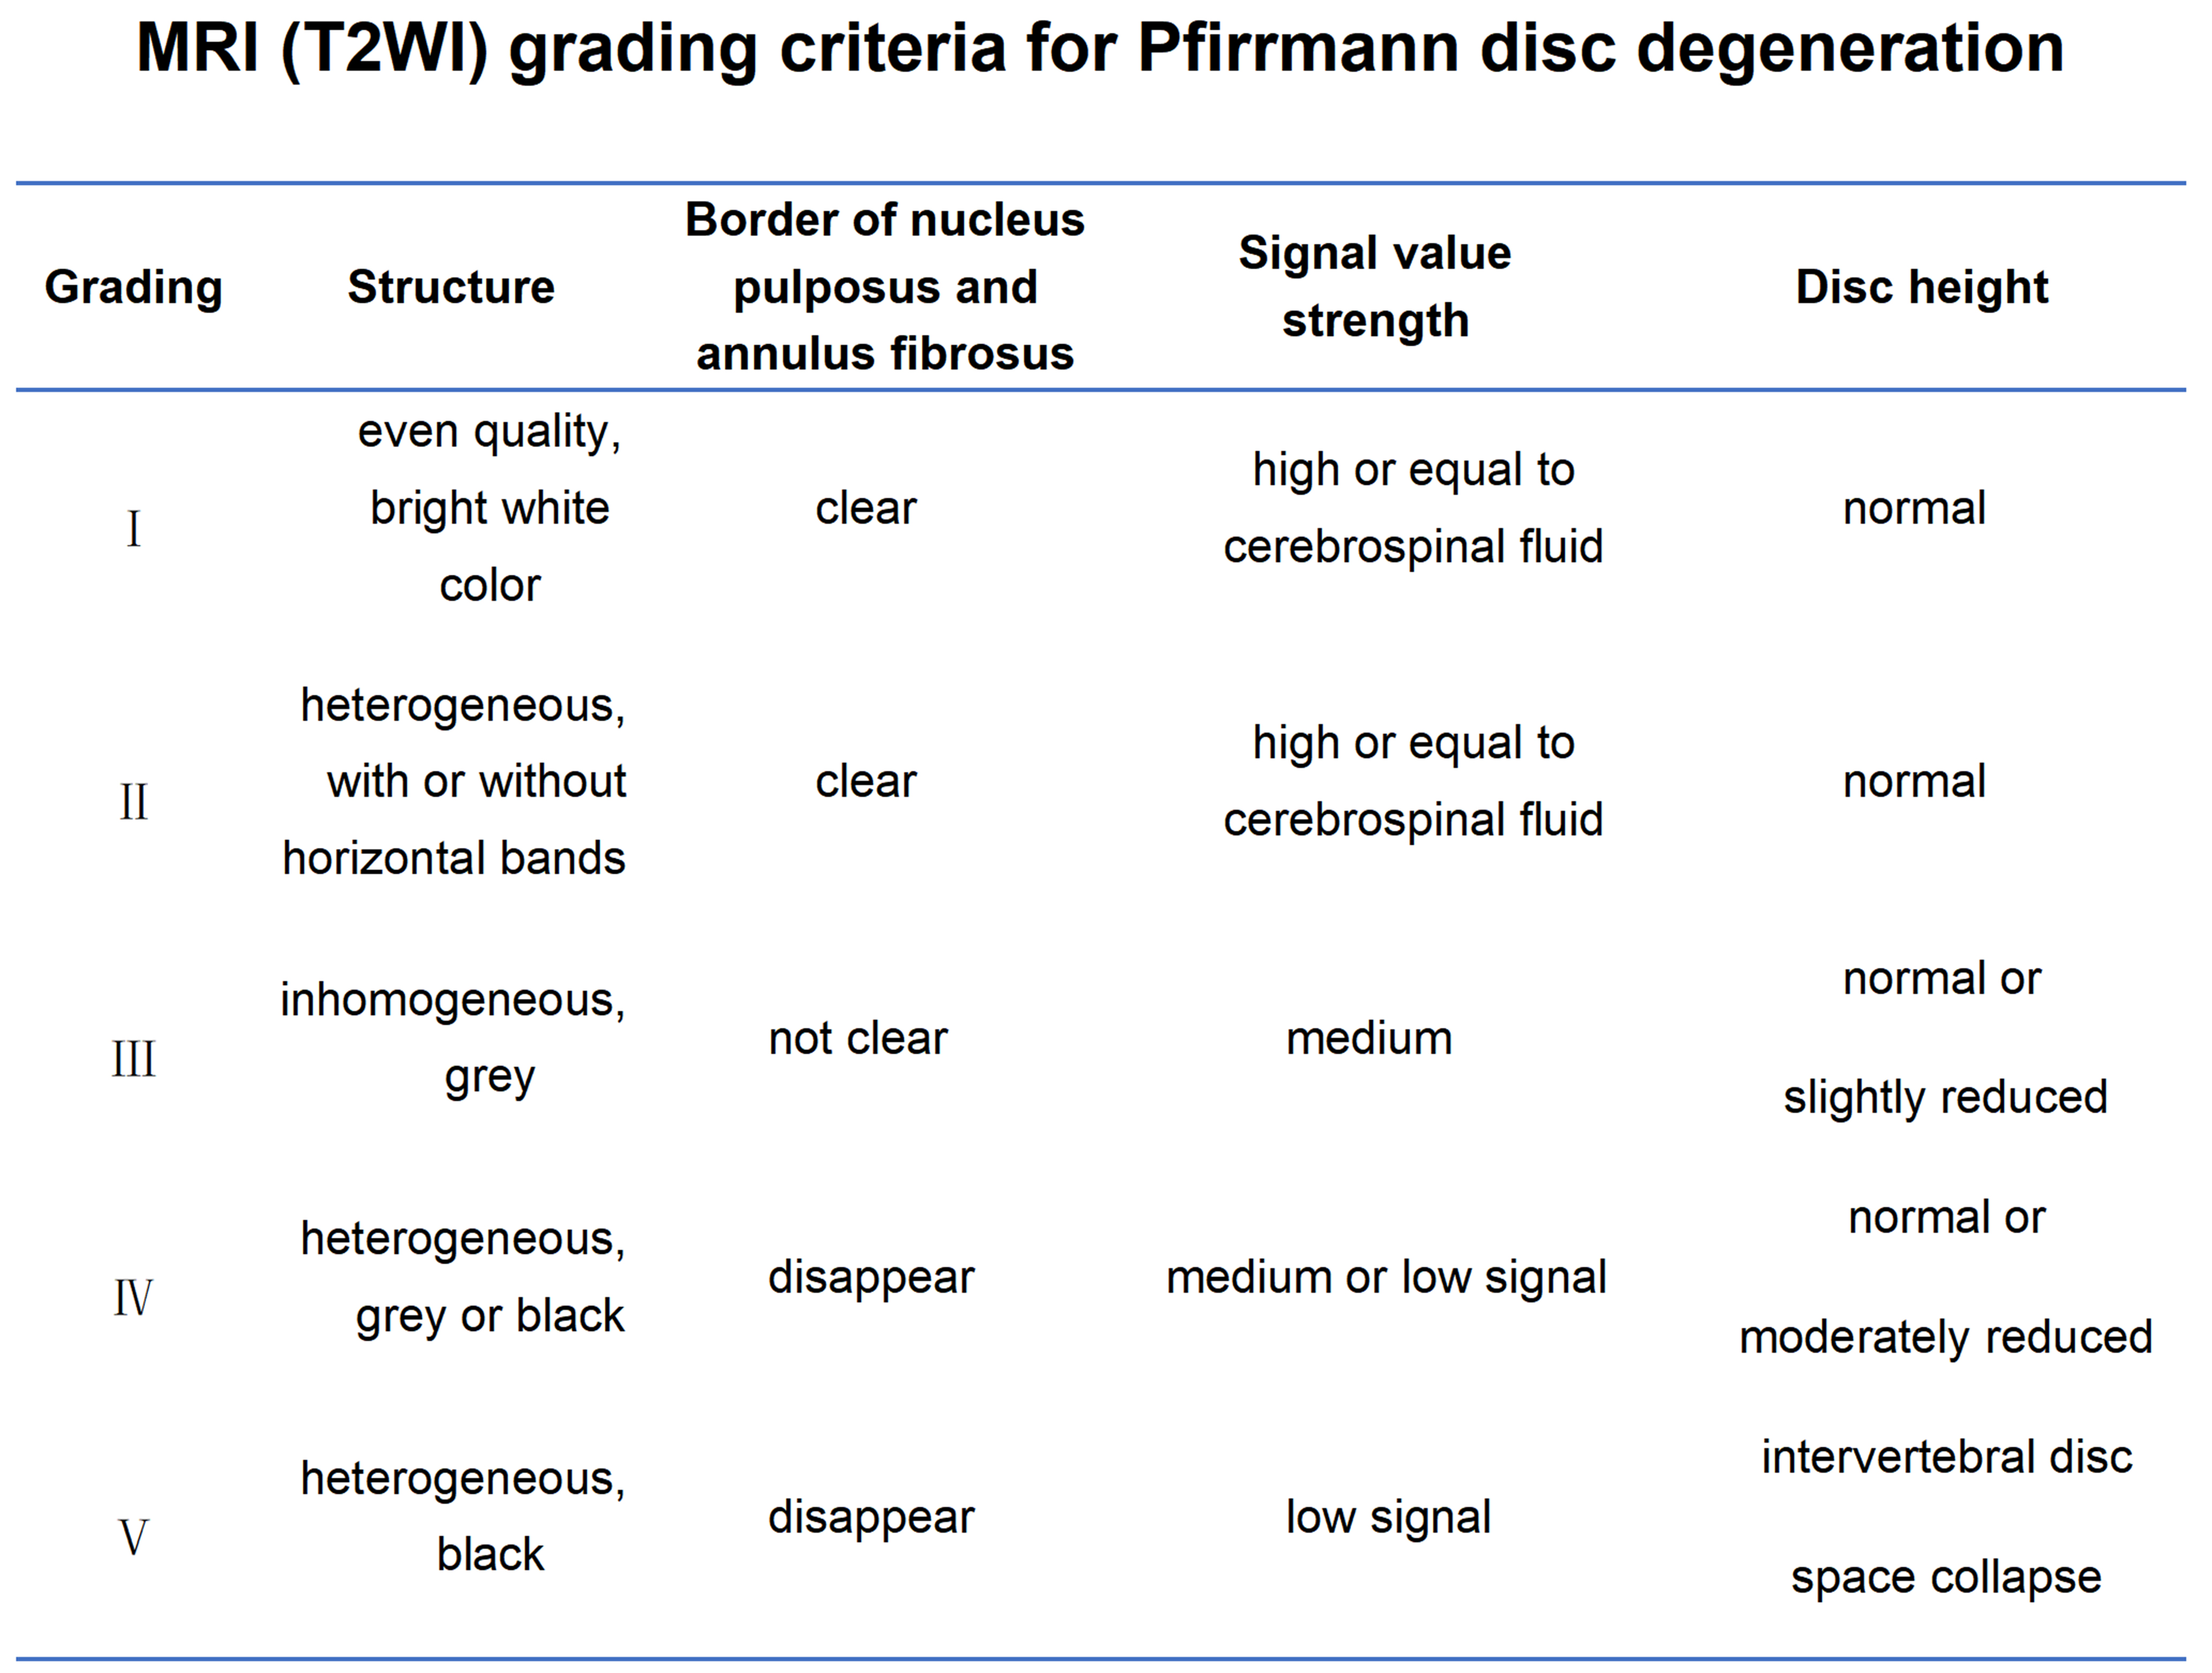
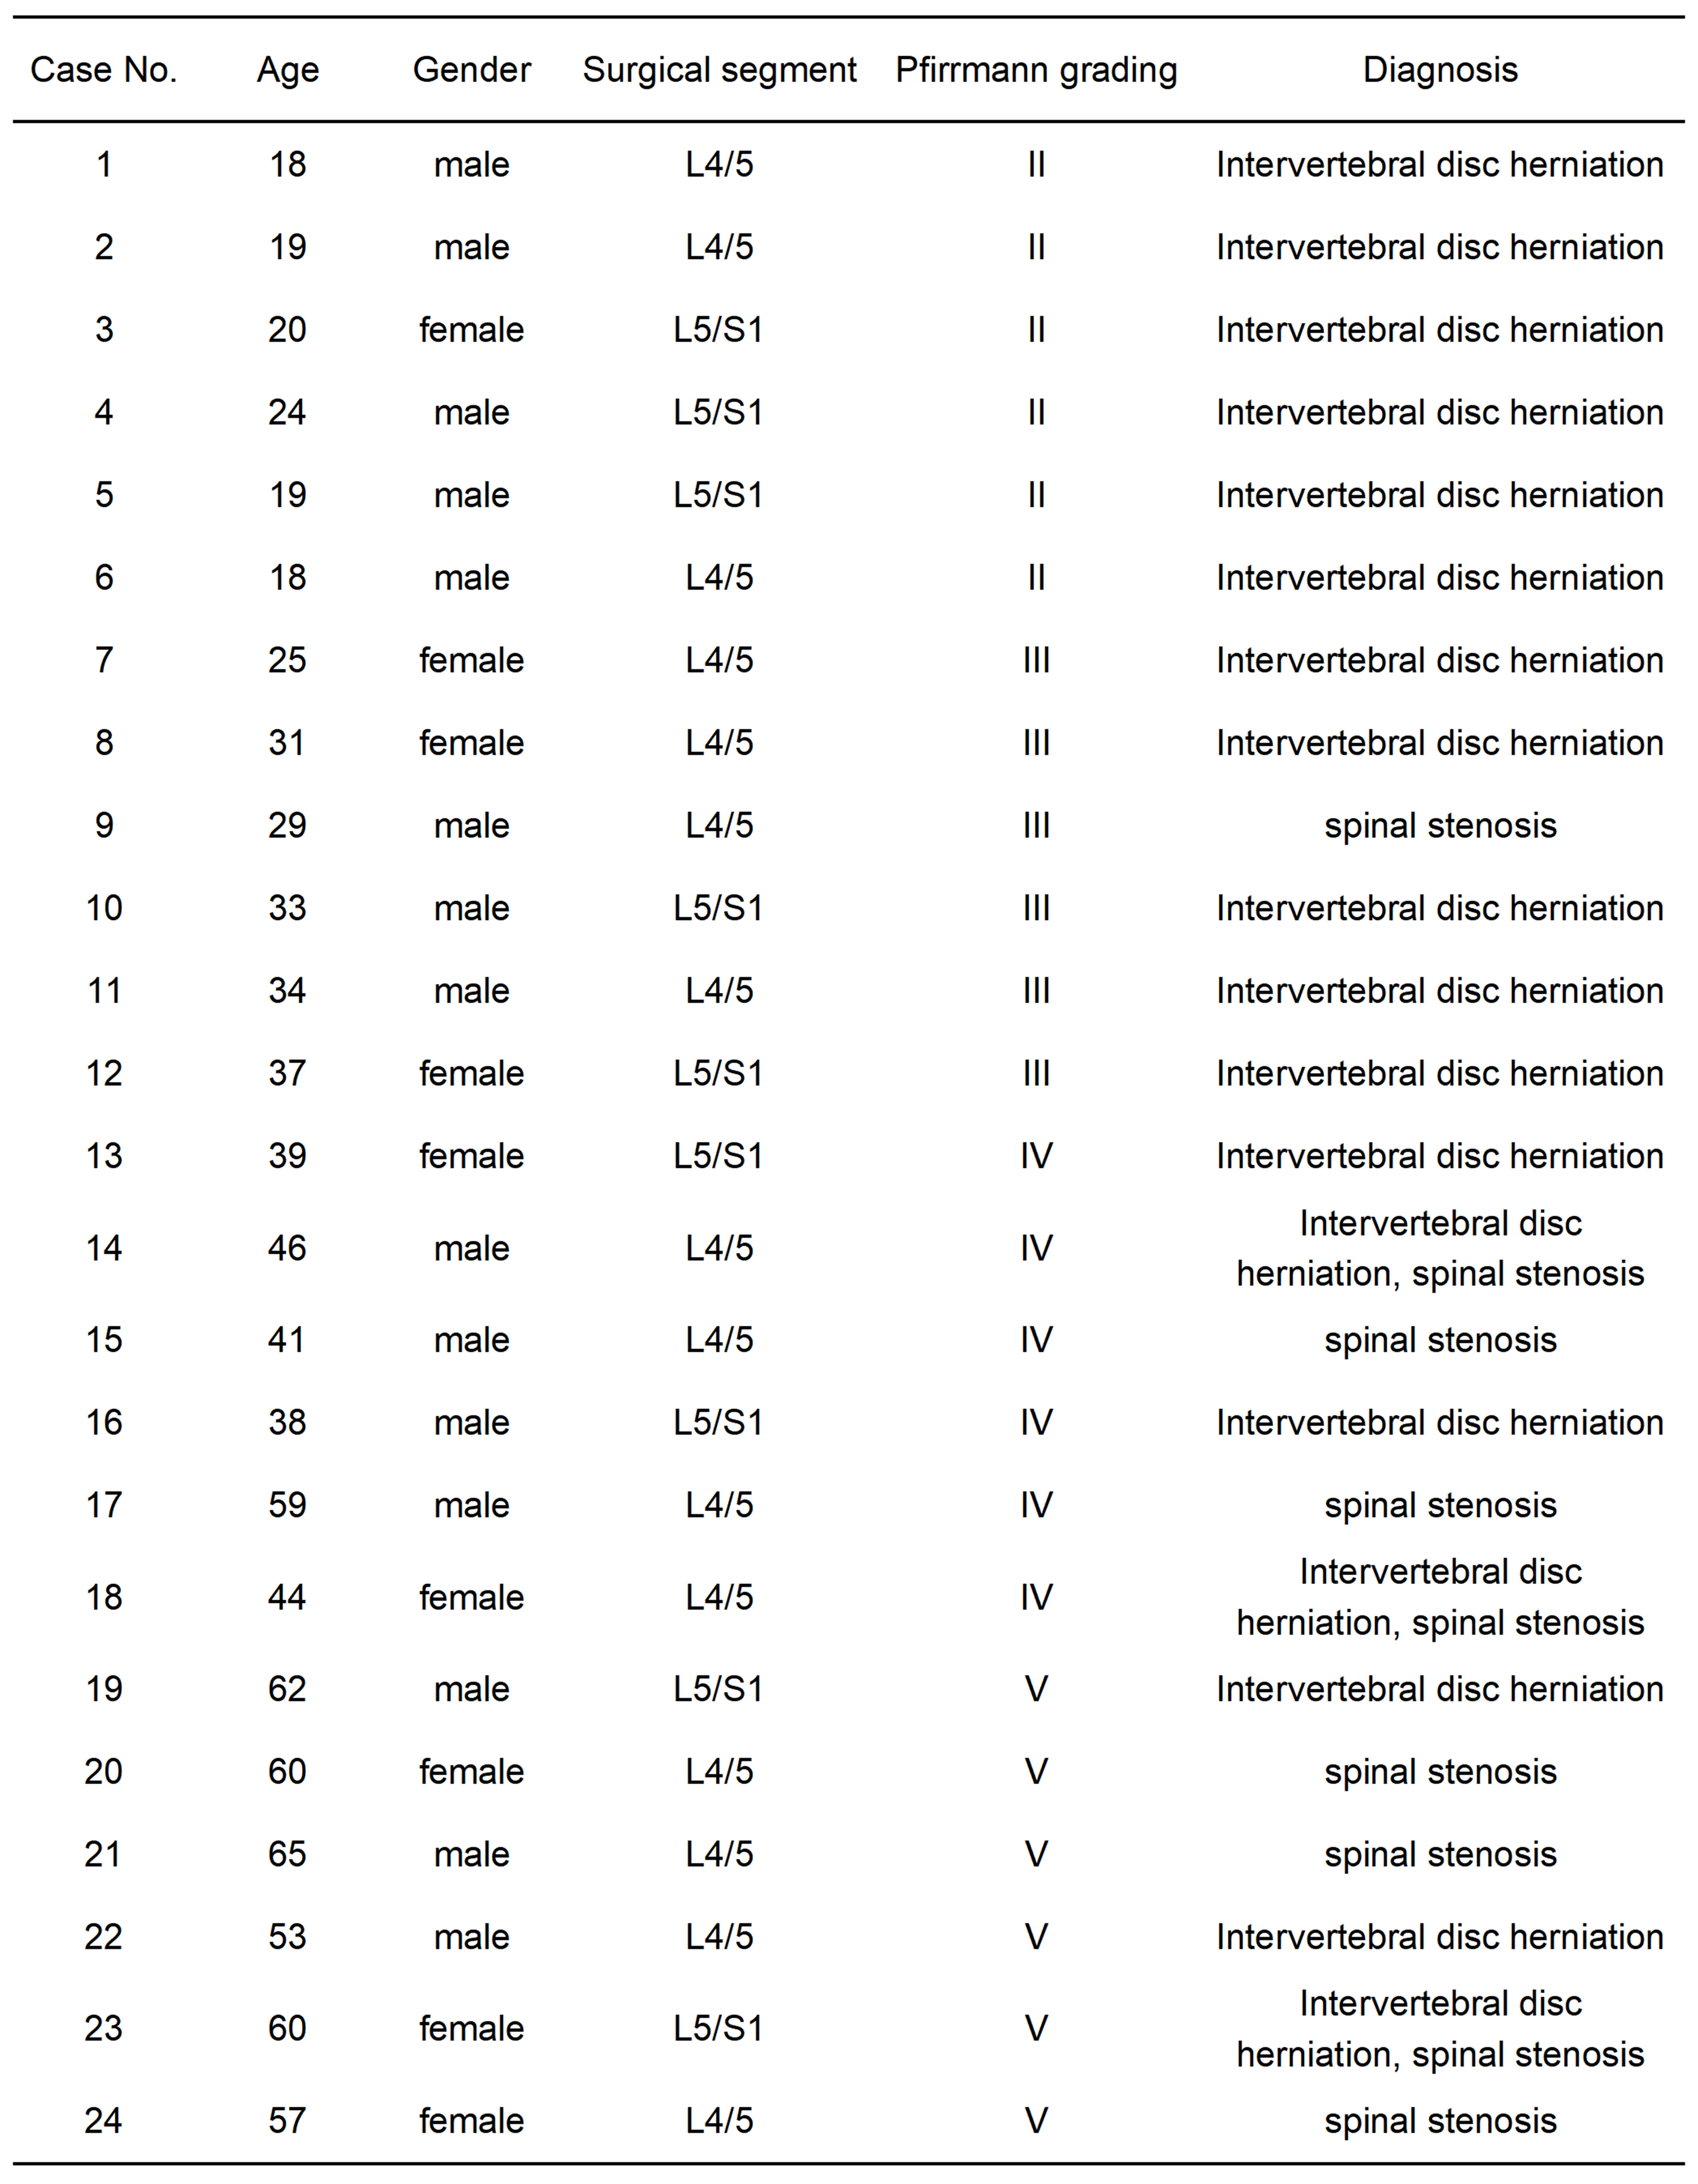
In the present study, the collected 24 human NP tissue samples were from patients who underwent a surgery between April 2022 and July 2022 at the department of orthopedics, Xinqiao Hospital, Army Military Medical University. According to Pfirrmann grading criteria (Table S1) and MRI examination of patients, Pfirrmann grading was performed for IVDD degree of patients. Then 6 patients of every grade between Pfirrmann II to V were selected to peforming the subsequent experiments, including 15 males and 9 females, aged 18–65 years. Inclusion criteria: Patients with lumbar disc herniation or lumbar spinal stenosis; Body mass index (BMI) between 18 to 24. Exclusion criteria: Patients with diabetes, chronic pulmonary/cardiovascular/ hepatic/kideny diseases, metabolic diseases, hematological diseases, lumbar infection, tumor or previous lumbar surgery at the involved level. The details of patients were showed in Table S2.
Collection of normal disc and puncture-induced disc degeneration (PIDD) samples
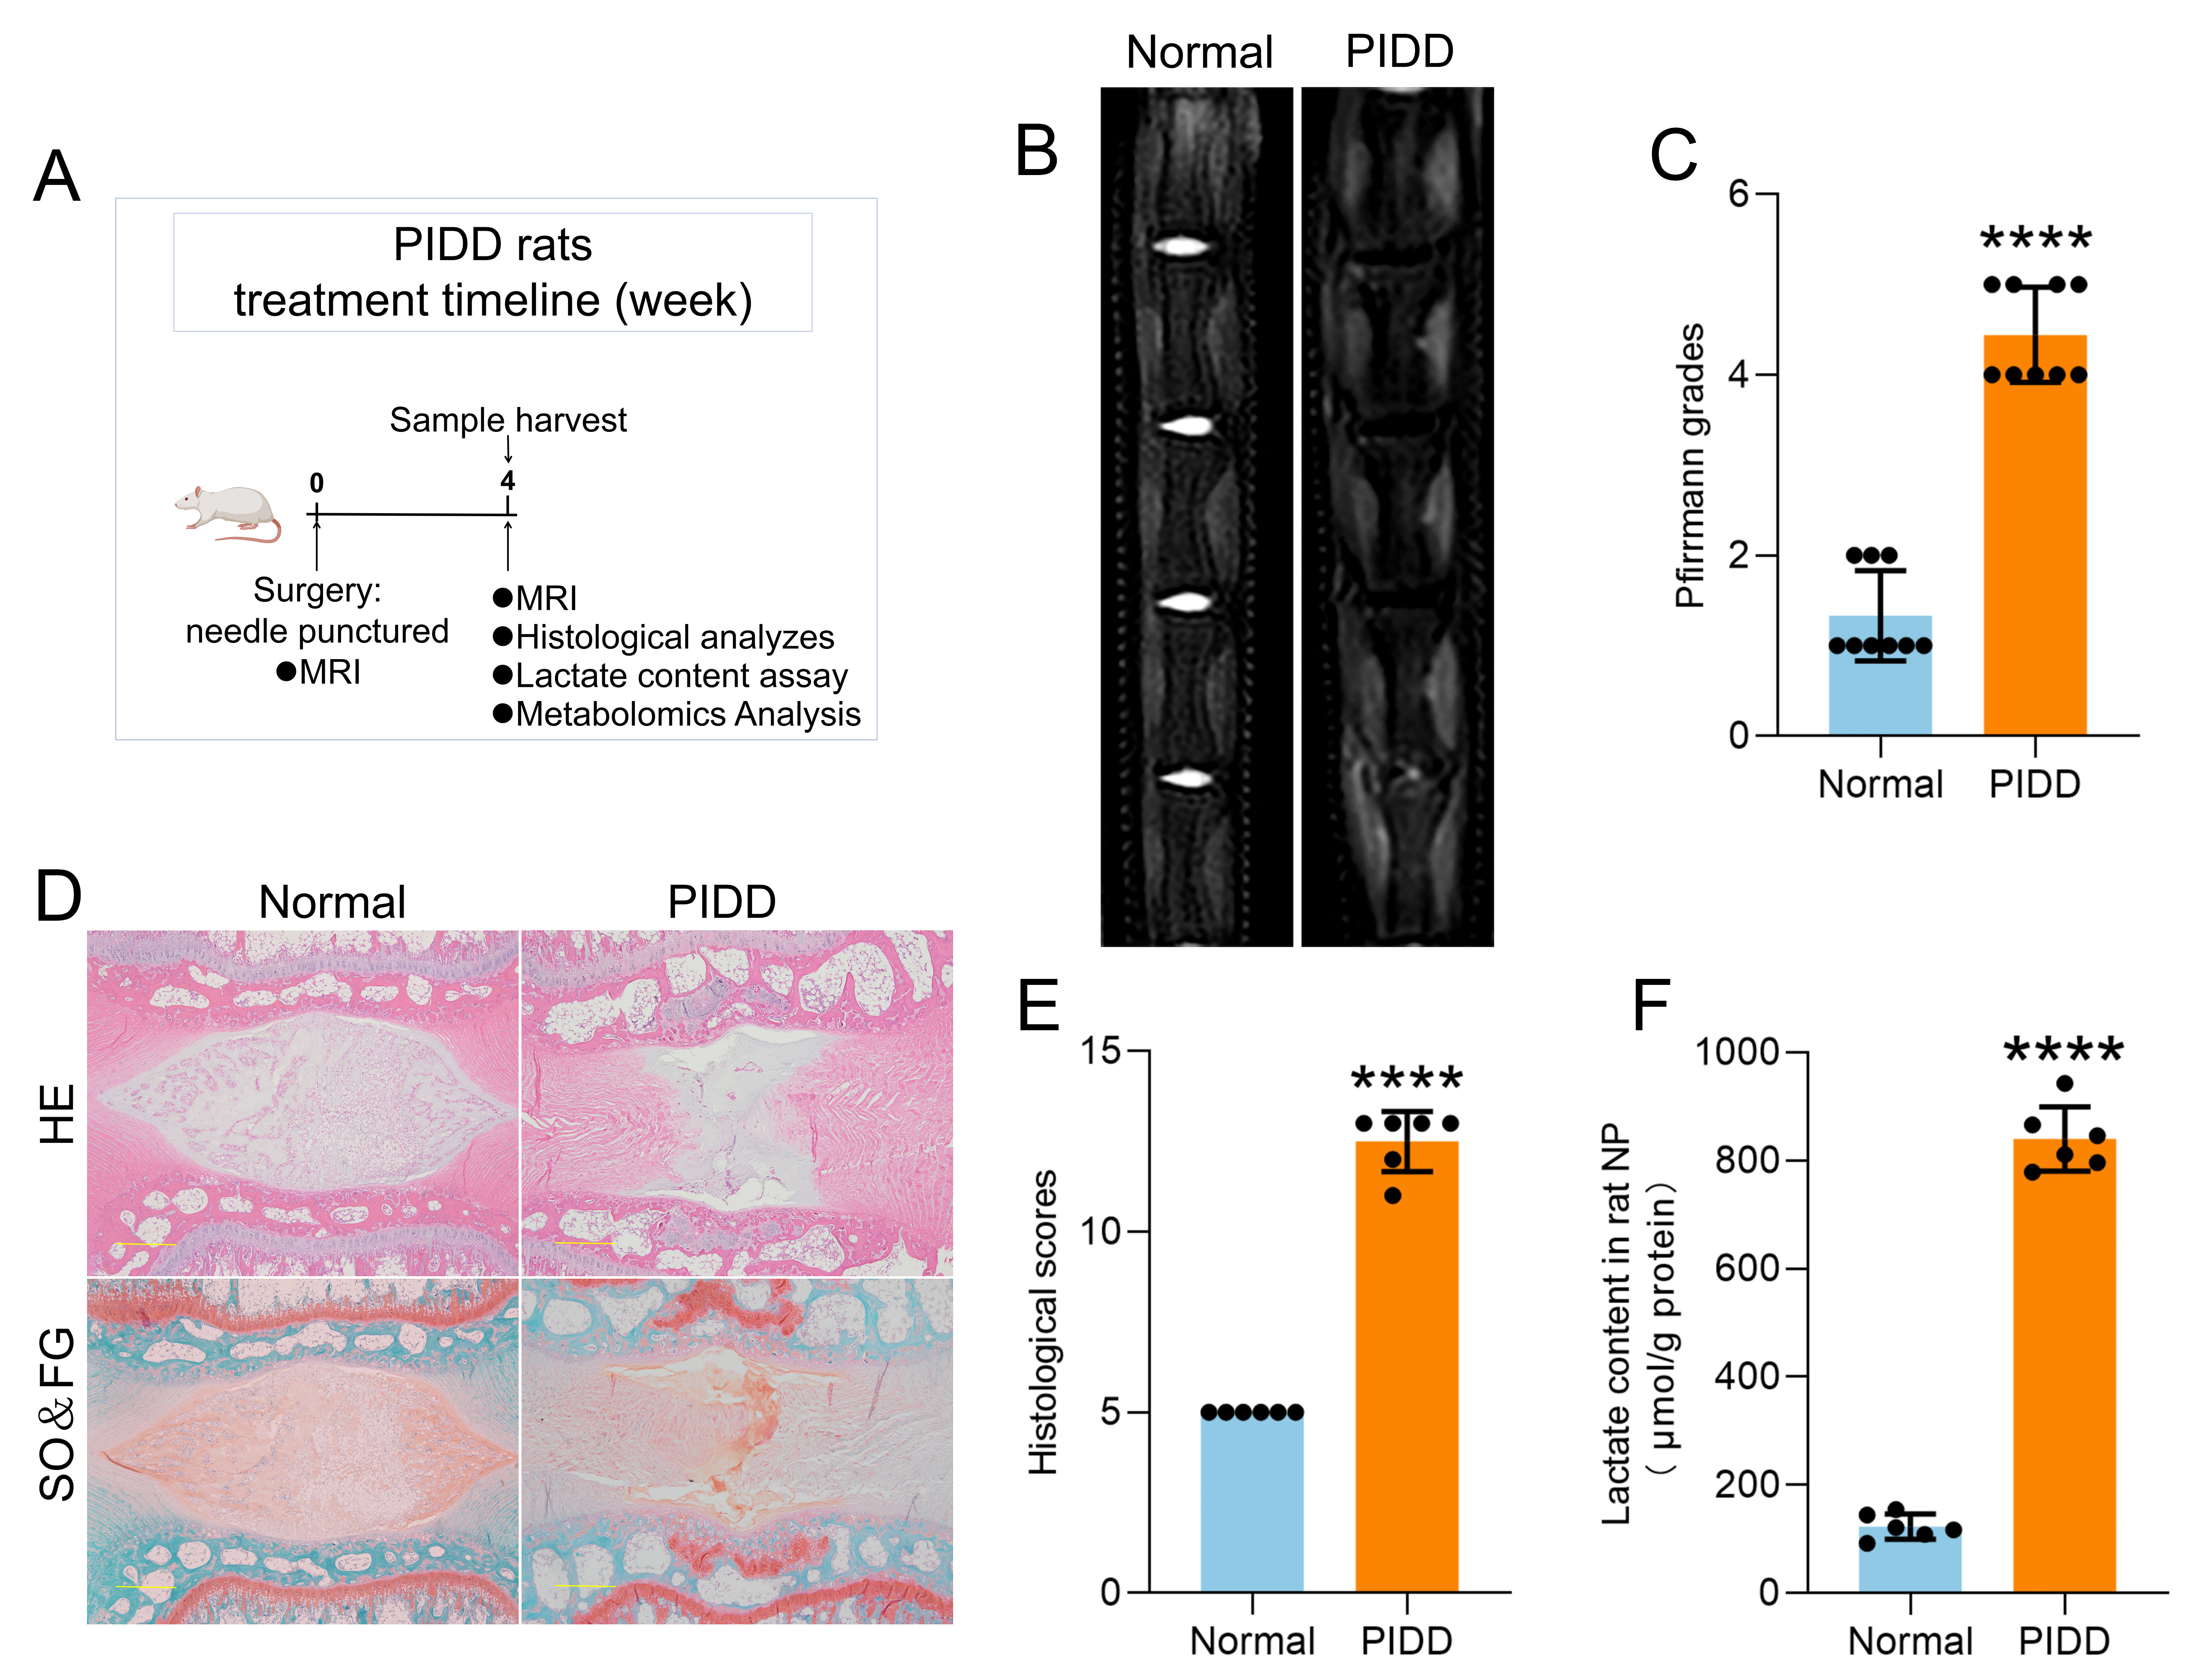
The rats in normal group did not receive any treatment, and the rats in PIDD group were used to establish a caudal disc degeneration model based on previous reports[31, 32]. Briefly, the rats were anaesthetized with 2% pentobarbital (50 mg/kg), and carprofen analgesia (5 mg/kg) was administered preoperatively. The surgical area was disinfected with iodophor, and a no. 20 G needle was vertically inserted into the 4 consecutive intervertebral discs between coccyx 4 and coccyx 8 with a depth of approximately 5 mm. The needle was rotated 360 degrees and held in place for 30 s. Then, the needle was removed vertically, and the surgical area was disinfected again. Each rat was given analgesics and antibiotics for 3 days for postsurgical care. 4 weeks after the operation, the rats were effectively anaesthetized and killed under analgesia, and the caudal vertebrae and intervertebral discs of the rats were collected for subsequent experiments.
Cell isolation, culture, and treatment
Rats were effectively anaesthetized and killed under analgesia, and then, the NP tissue was isolated under aseptic conditions. According to a previous report[33], the NP tissues of rats were mixed and digested with 0.2% type II collagenase (C2-BIOC, Sigma‒Aldrich, USA) for approximately 2 h at 37°C, followed by centrifugation at 400×g for 5 min at room temperature. The supernatant was discarded, and the sediment was suspended and cultured in DMEM-F12 (BI, Kibbutz Beit-Haemek, Israel) supplemented with 10% foetal calf serum (C04001500, VivaCell, Shanghai, China) and 1% penicillin/streptomycin (C0222, Beyotime, Shanghai, China). NPC were placed in a humidified chamber in a 5% CO2–air mixture at 37°C. The medium was changed every 3–4 days. The cells were subcultured when they reached a confluence of 80–90%. NPC from the third generation were used throughout the experiments.
Lactate content assays
Cell samples: NPC were seeded in T75 cell culture flasks at a density of 6 × 10⁵ cells per flask. The cells were treated with different concentrations of lactate (2, 6, 10 mM). A lactate assay kit (BC2235, Solarbio, China) was used to measure the lactate contents in the NPC. All the experimental results were normalized to the protein content of each sample.
Tissue samples: The human NP tissues removed during surgery were immediately placed on ice. Intervertebral discs were randomly selected from the normal group or PIDD group, and the NP tissues were isolated and placed on ice. A lactate assay kit (Solarbio) was used to measure the lactate contents in the human and rat NP tissues. All experimental results were normalized to the protein content of each sample.
Energy metabolomics analysis
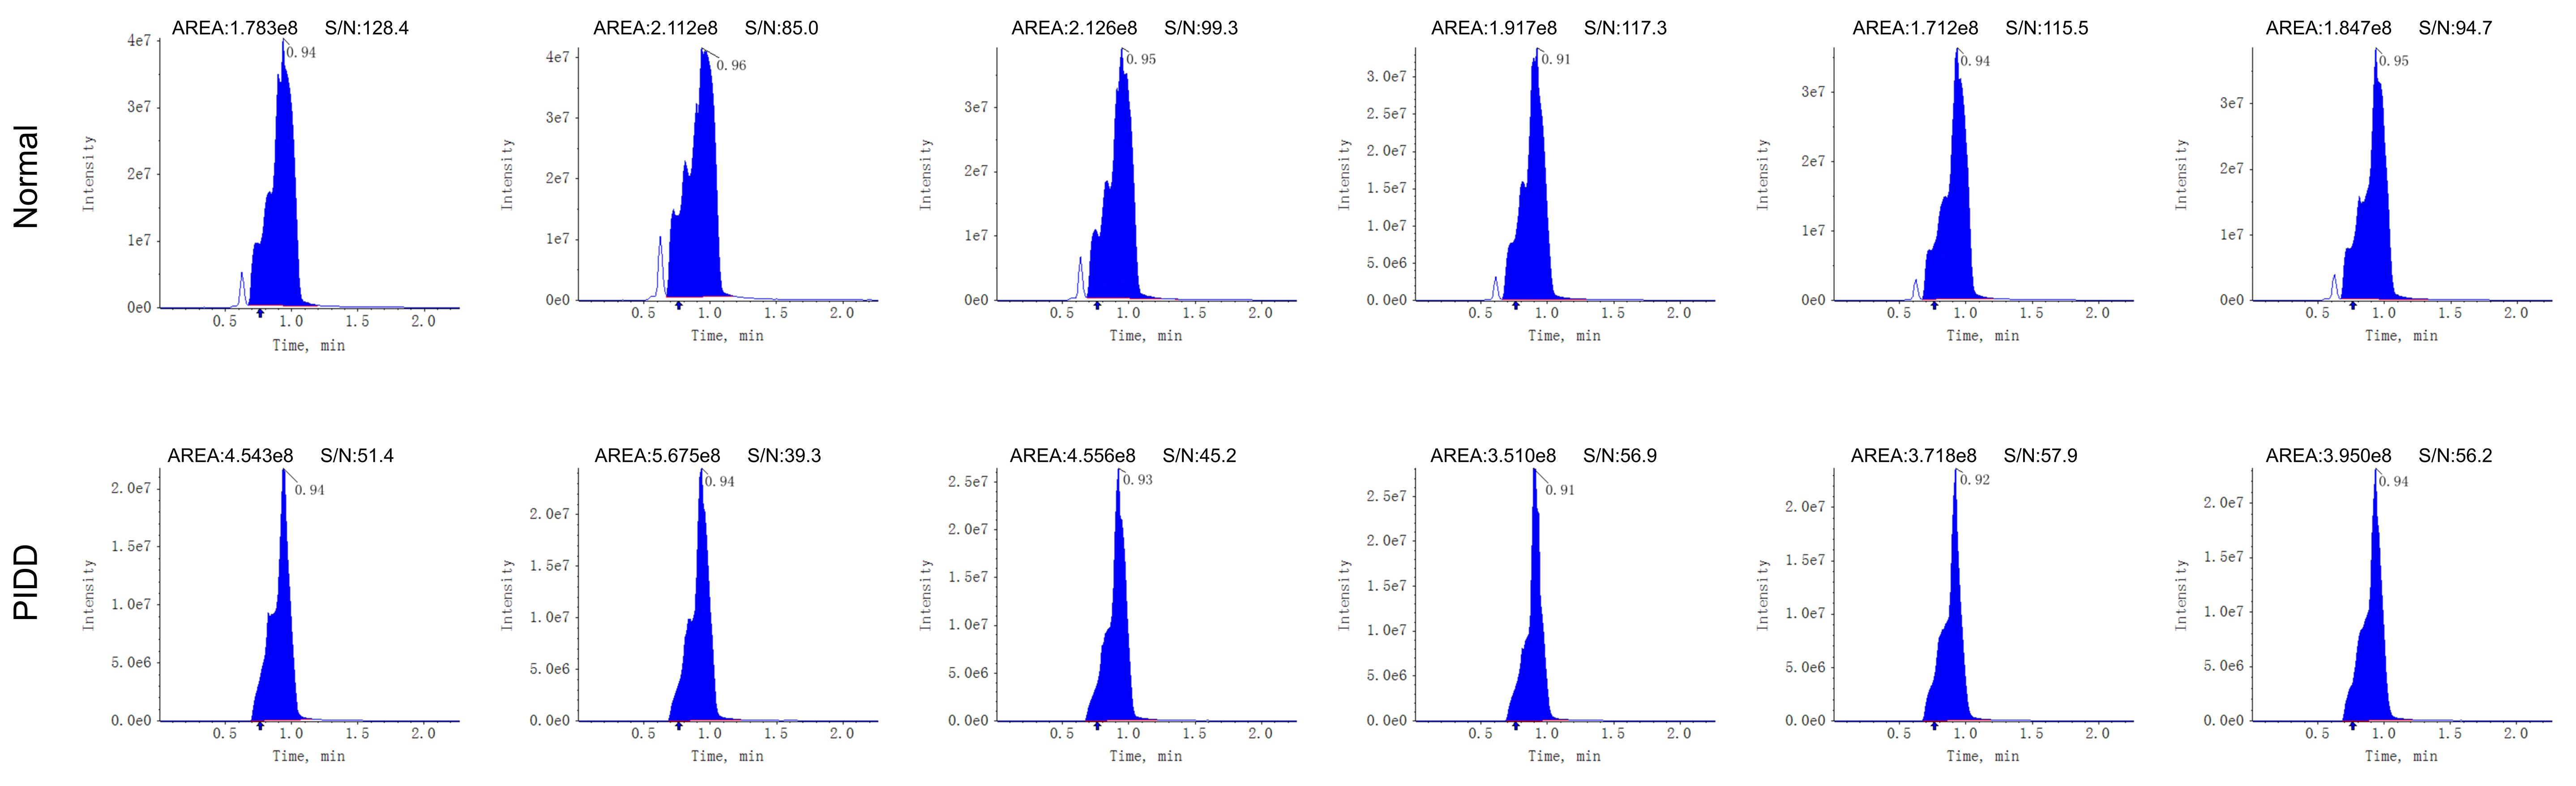
Energy metabolomics analysis was performed by the Metware Biotechnology Co., Ltd. (Wuhan, China). 4 weeks after needle-puncture surgery, 6 rats were randomly selected from each of the normal group and PIDD group. 50 mg of NP tissue were taken from each rat, and then 500 µL of precooled 70% methanol was added to the samples. After that, a tissue-grinding pestles (MM400, Retsch) was used to grind the tissue samples and then centrifuged the mixture at 12000 r/min for 10 min at 4°C, and then 300 µL of supernatant of each sample was collected. The centrifugation and supernatant collection processes were repeated, and the supernatant was filtered using a protein precipitation plate. An ultrahigh-performance liquid chromatography and tandem mass spectrometry platform (QTRAP 6500+, SCIEX) was used to detect differential metabolites in the sample. A metabolite database was generated based on the standard products for qualitative analysis, and a multiple reaction monitoring system was used for quantitative analysis.
Construction and verification of lactate oxidase (LOx) overexpression vector
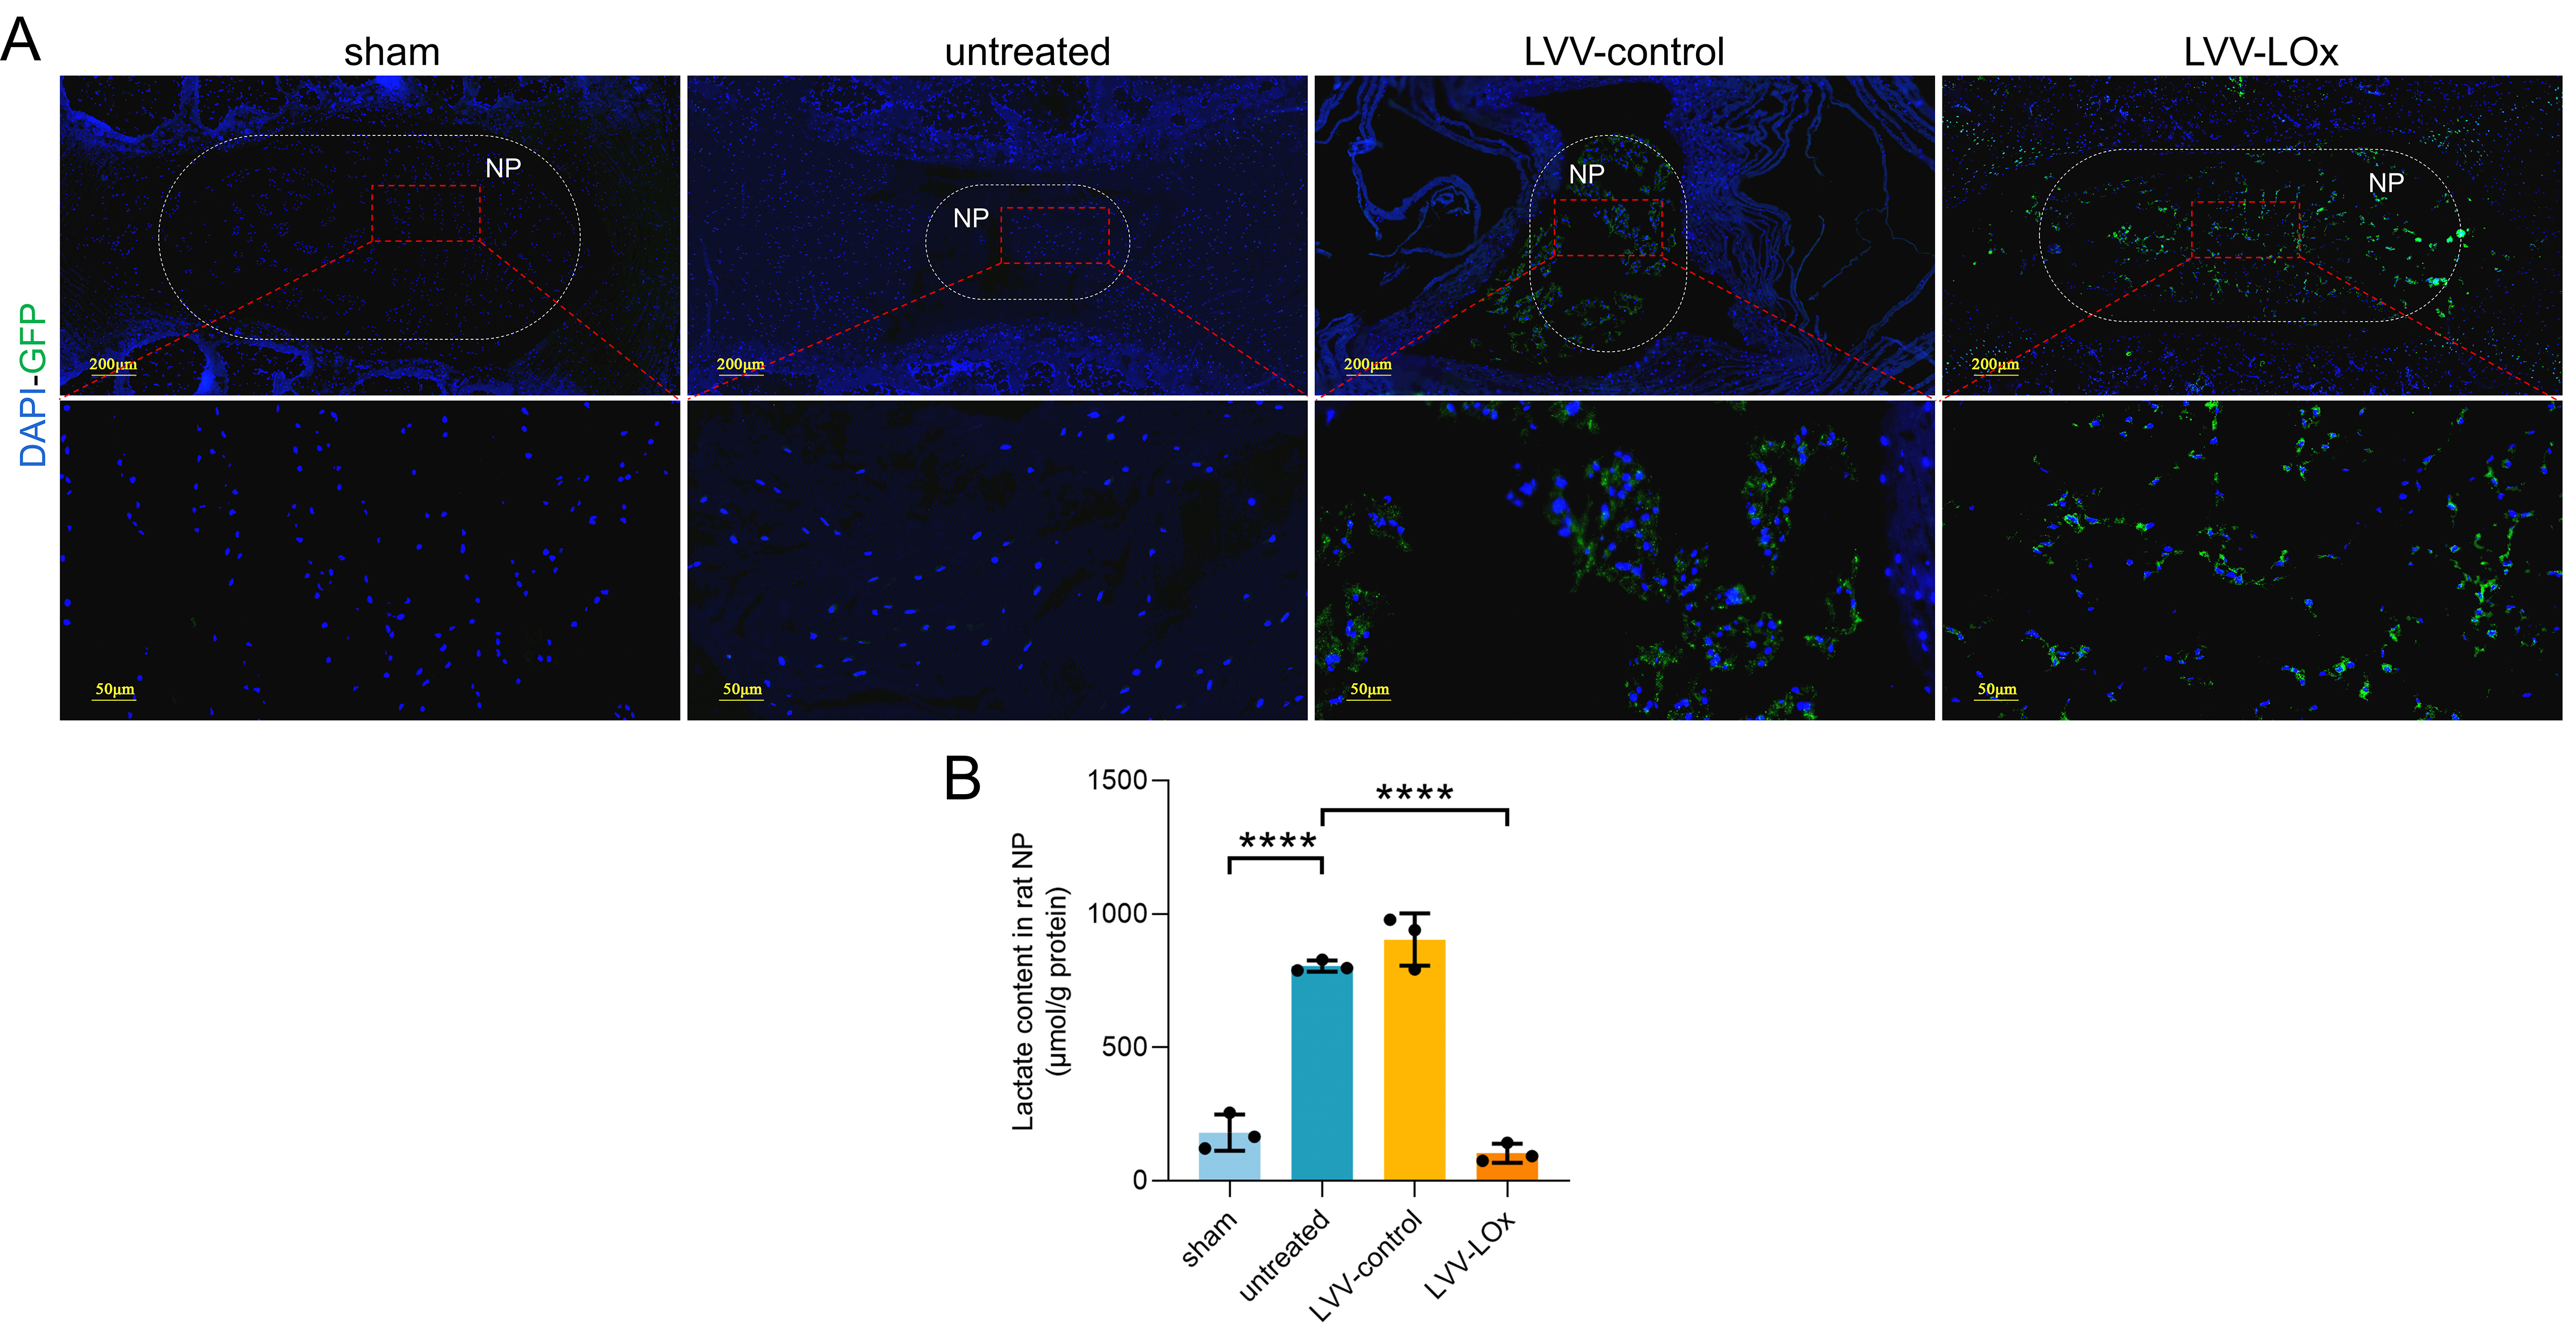
The LOx overexpression lentiviral vector was constructed according to previous reports[34]. The gene sequence of LOx (GenBank: D50611.1) was optimized by Thermo Fisher Scientific Company (Shanghai, China), and then, the pCMV-LOx-IRES-EGFP plasmid was constructed based on the GV208 plasmid. The pCMV-IRES-EGFP plasmid was used as a control, and then, the lentivirus vectors (LVV) were packaged in H293T cells after the cotransfection of the plasmids to generate LVV-LOx-IRES-EGFP and the corresponding control virus LVV-IRES-EGFP. Then, the Escherichia coli strain DH5α was used to amplify LVV. The above services were provided by GeneChem Gene Company (Shanghai, China). Next, according to the manufacturer's instructions, we selected MOI as 20 to transfect lentivirus vectors into NPC. Fluorescence intensity of green fluorescent protein (GFP) was observed by immunofluorescence to determine the virus transfection effect.
Lentivirus treatment of PIDD rats
6 healthy male SD rats aged 8 weeks were randomly selected for the animal experiments. 4 consecutive intervertebral discs between coccyx 4 and coccyx 8 were selected for the experiments. Co 5/6, Co 6/7, and Co 7/8 were punctured according to the method described above to establish PIDD. Co 4/5 was not operated and served as a reference control. Immediately after the puncture, Co 5/6 did not receive any treatment, Co 6/7 was injected with LVV-IRES-EGFP (LVV-control, 1 × 10⁹ PFU, diluted in 2 µl normal saline), and Co 7/8 was injected with LVV-LOx-IRES-EGFP (LVV-LOx, 1 × 10⁹ PFU, diluted in 2 µl normal saline). 4 weeks after treatment, the rats were sacrificed after effective anaesthesia and analgesia, and the intervertebral discs of the rats were harvested for subsequent experiments.
Magnetic resonance imaging (MRI) analysis
Rats were anaesthetised by inhalation of 4% sevoflurane. A magnetic resonance imager (PHILIPS Ingenia 3.0T) was used to scan the coccyx of the rats, and the parameters were set as follows: TR time: 2000 ms, TE time: 80 ms, incentive time: 2, scan time: 3 min 20 s, fat reduction technology: SPAIR, scan matrix: frequency encoding 368 and phase encoding 288, layer thickness: 2.5 mm, echo chains: 12, and spin echo sequence: TSE sequence. Pfirrmann grading of rat intervertebral discs was calculated according to the Pfirrmann grading criteria (Table S1).
Microcomputed tomography (µCT) analysis
After the rats were effectively anaesthetized, the coccyx of the rats was scanned with a µCT scanner (Bruker, SkyScan 1176) at a source voltage of 90 kV and a current of 160 µA, and the scanned image pixel was 73 µm. According to a previously reported method[31], the length of the intervertebral disc and the adjacent superior and inferior vertebral bodies were measured to calculate the disc height index (DHI), and the percentage of DHI (DHI%) was calculated as post-DHI/0 W-DHI.
Histological analysis of human nucleus pulposus tissues and rat caudal intervertebral discs
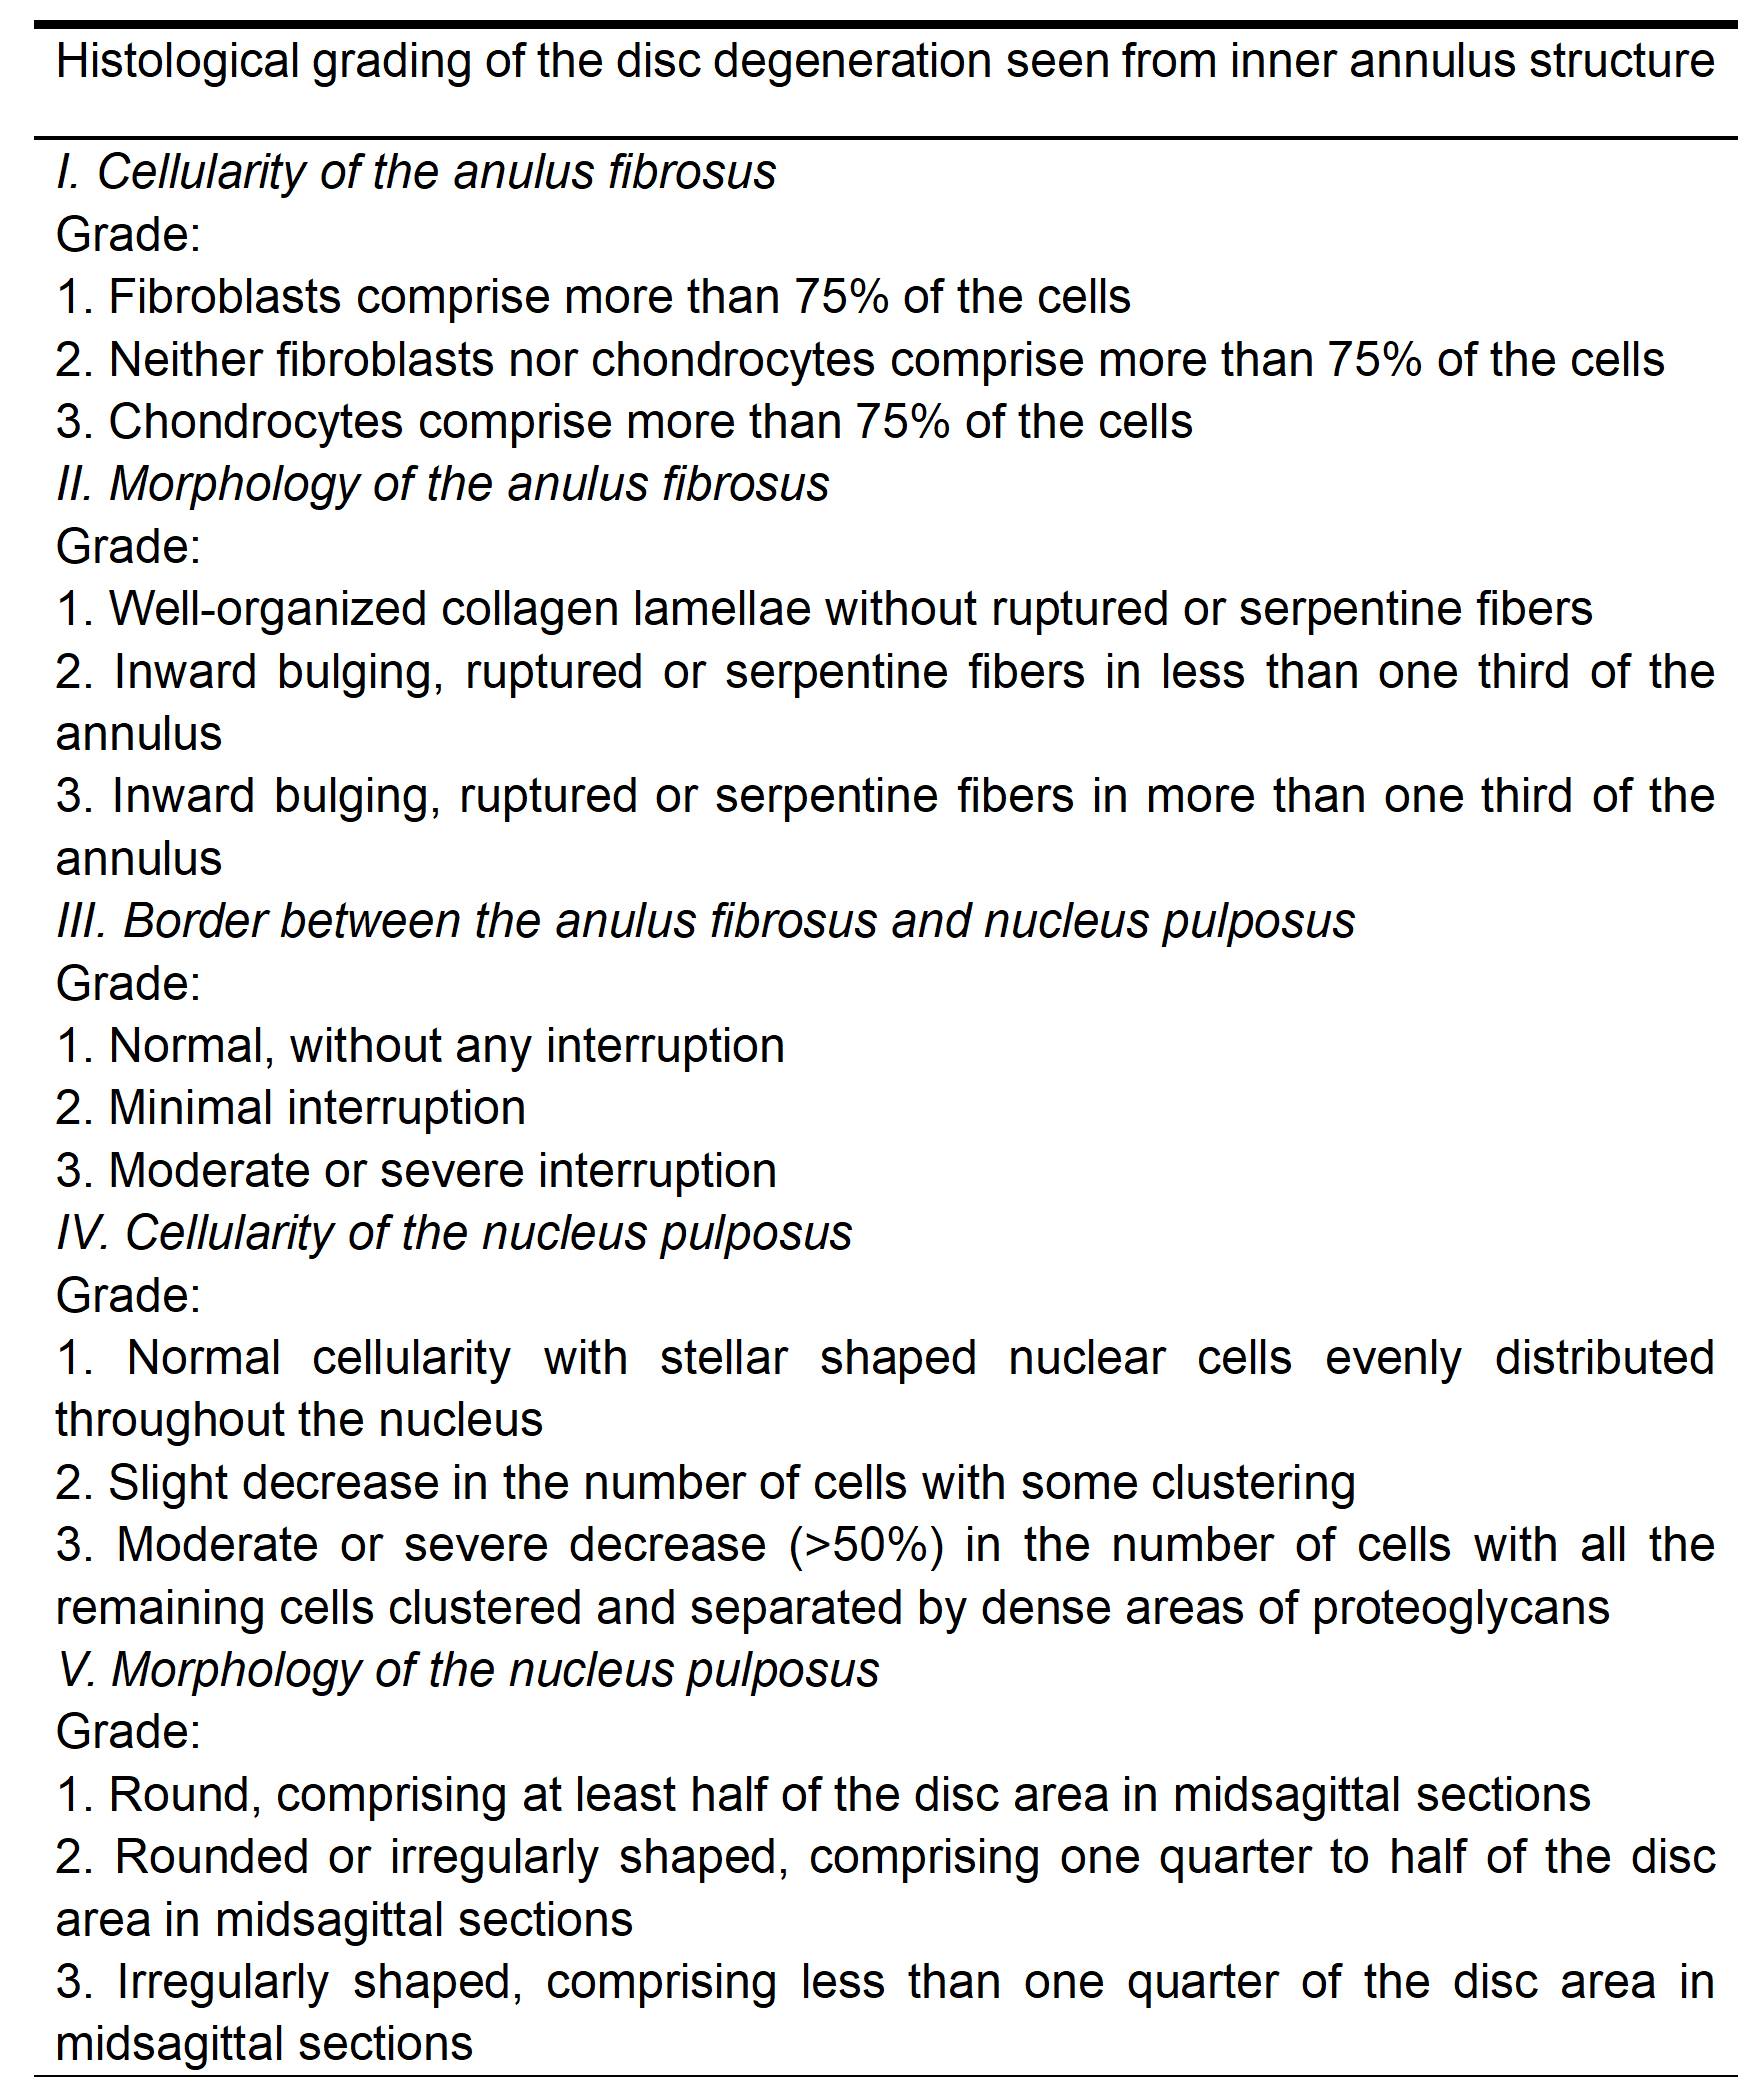
The human NP tissues removed during surgery were incubated in 4% paraformaldehyde solution (Beyotime) for 48 h, then the samples were dehydrated and embedded in paraffin and then sliced into 6 µm paraffin sections. The caudal vertebrae and intervertebral discs of the rats were incubated in 4% paraformaldehyde solution (Beyotime) for 48 h and then decalcified with 10% ethylenediaminetetraacetic acid (EDTA; pH 7.2) for 14 days. The samples were dehydrated and embedded in paraffin and then sliced into 6 µm paraffin sections. The prepared sections were stained using a Haematoxylin-Eosin (HE) Staining Kit (G1120, Solarbio) and a Modified Safranine O-Fast Green (SO & FG) Staining Kit (G1371, Solarbio) according to the manufacturer's instructions, and then, the sections were fixed with neutral resin and observed by an optical microscope (BX53, OLYMPUS). The histology grading of the rat intervertebral discs was calculated according to the histological grading criteria of disc degeneration (Table S3).
Immunofluorescence staining assay
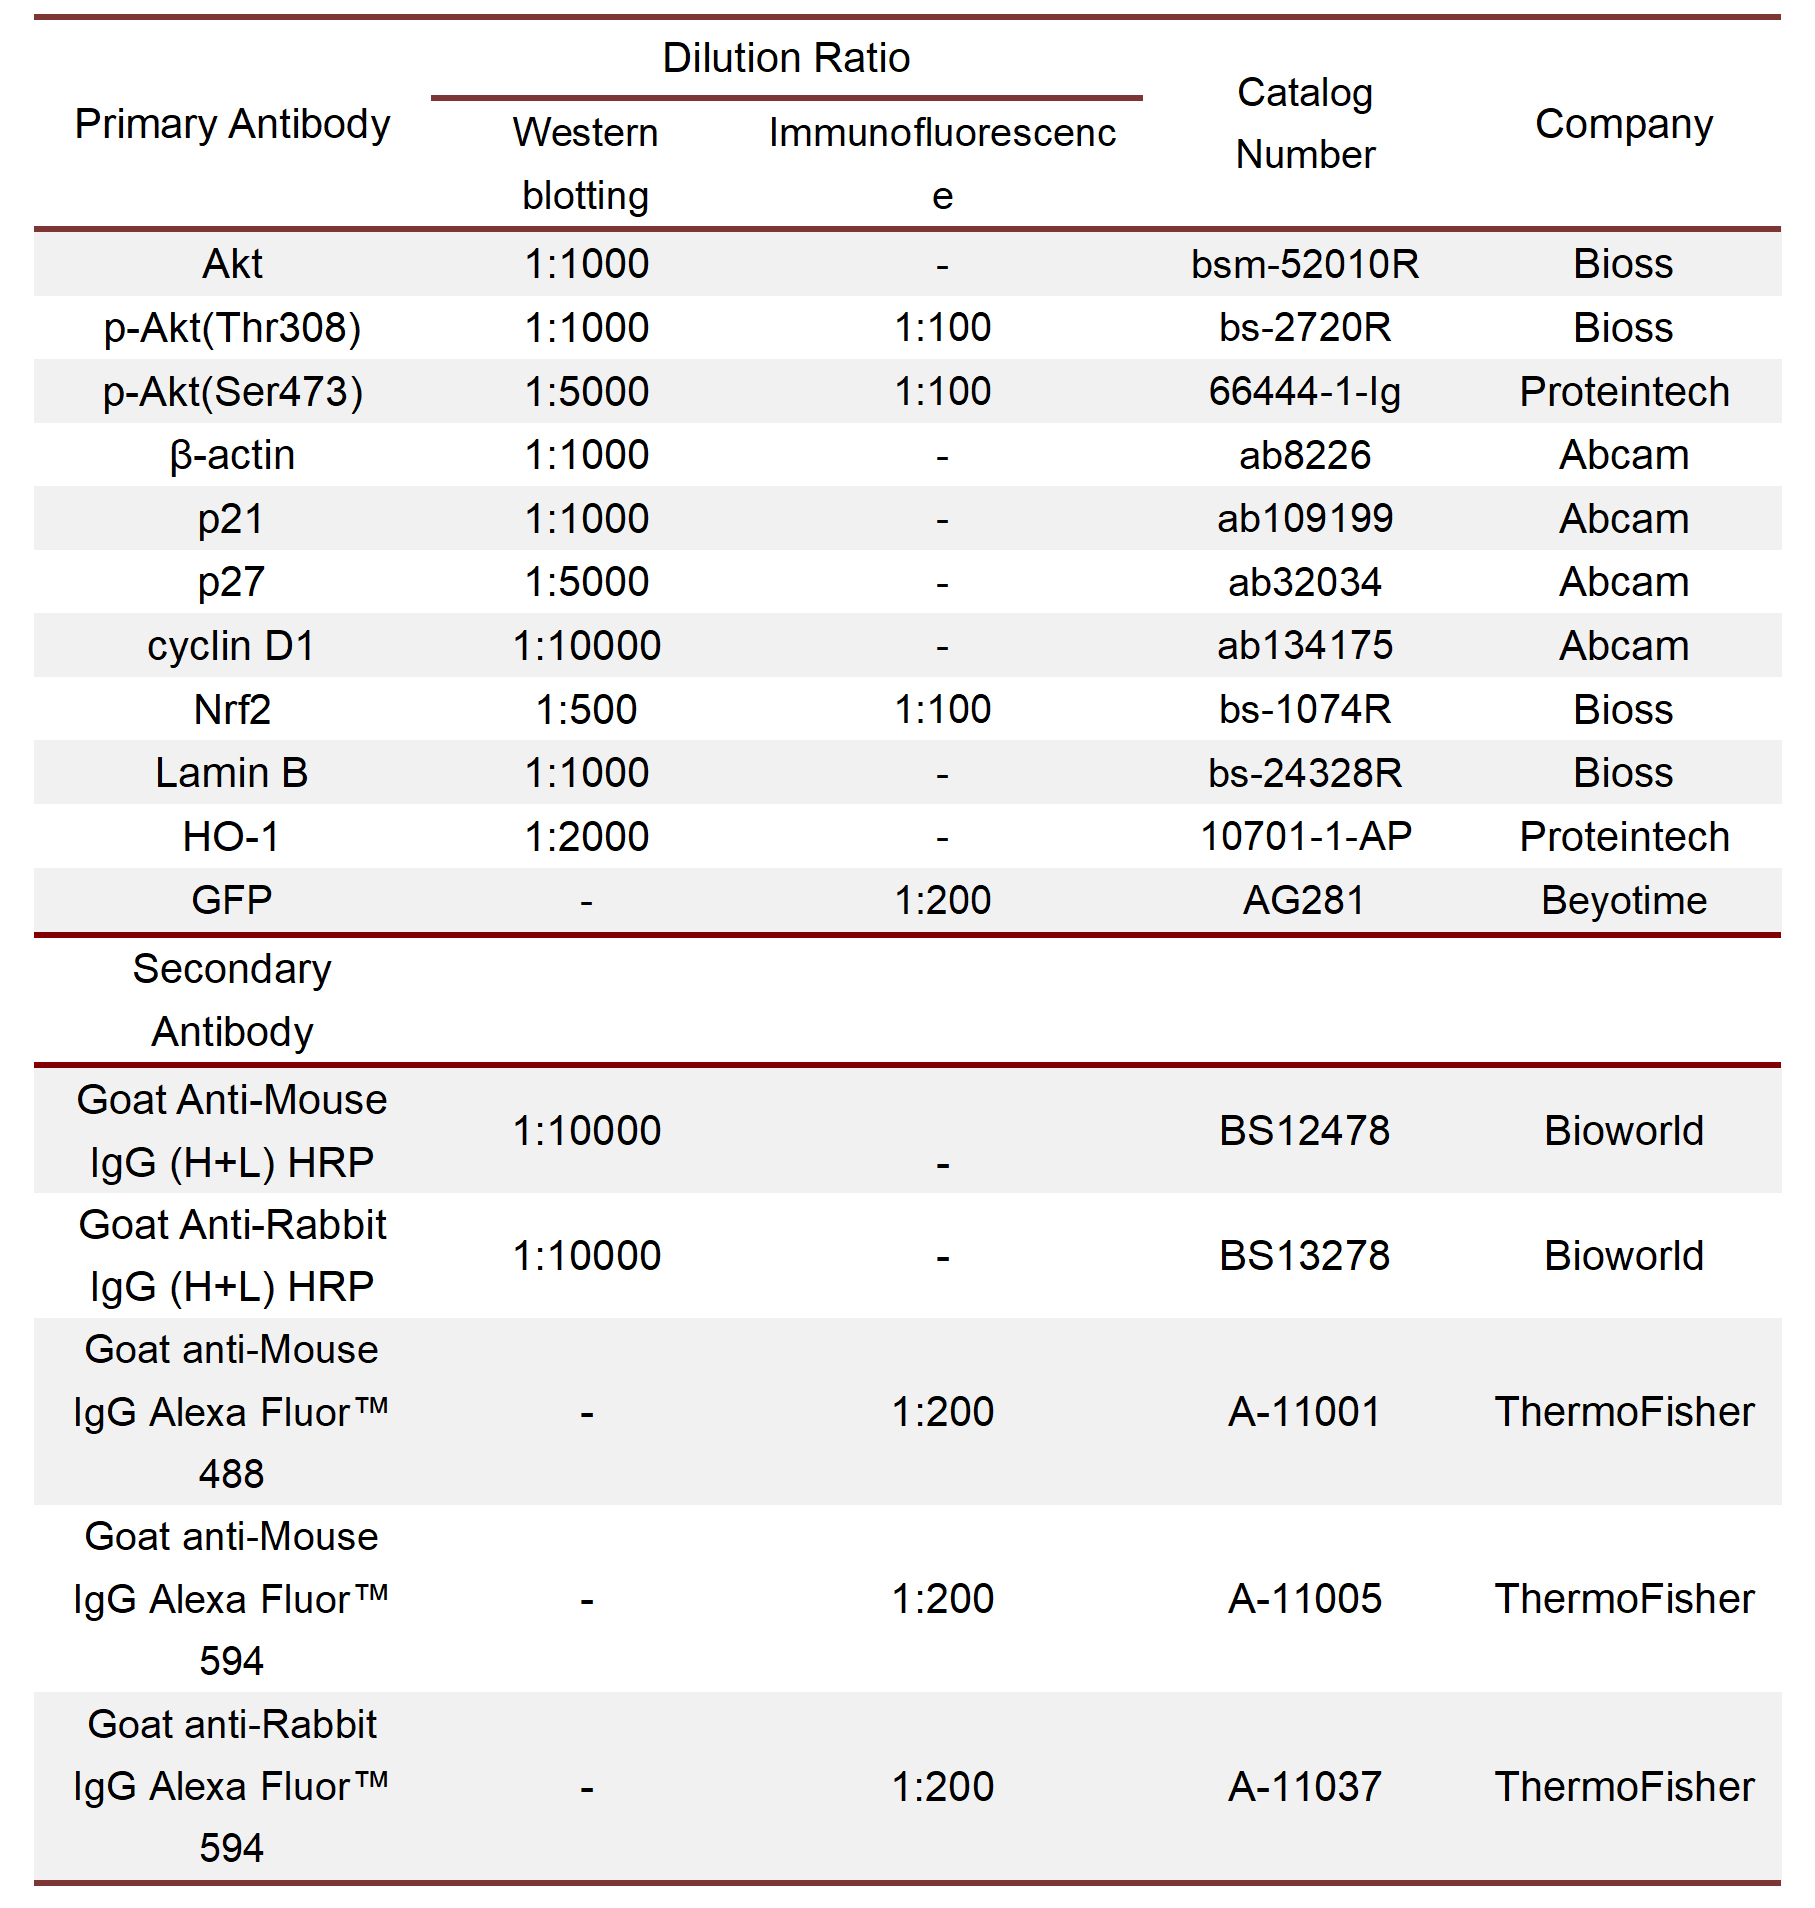
Cell samples: NPC were seeded in 6-well plates or confocal dishes, and after receiving different treatments, the cells were fixed with 4% paraformaldehyde, permeabilized with immunostaining permeabilizer (P0097, Beyotime), and blocked with QuickBlock immunostaining blocking solution (P0260, Beyotime). Then, the primary antibody was added and incubated overnight at 4°C. Fluorescently labelled secondary antibody was added to the sample. Then, the results were visualized using fluorescence or confocal microscopy. The mean fluorescence intensity of the samples was quantified using ImageJ (National Institute of Health, USA). Information about the antibodies used in the experiments is provided in Table S4.
Tissue samples: Tissue sections were prepared as previously described. The sections were deparaffinized with xylene and rehydrated with graded ethanol solutions, followed by antigen retrieval with sodium citrate-EDTA antigen retrieval solution (P0086, Beyotime). The sections were permeabilized, blocked, and incubated with primary antibodies overnight at 4°C. Then, the sections were incubated with fluorescently labelled secondary antibodies. The fluorescent staining results were obtained using a confocal microscope (LSM880, ZEISS, Germany). ImageJ was used to quantify the fluorescence intensities. Information about the antibodies used in the experiments is provided in Table S4.
Cell counting kit-8 (CCK-8) assay
A cell counting kit-8 (C0038, Beyotime) was used to determine the effect of lactate on NPC proliferation. NPC were seeded into 96-well plates at a density of 2 × 10³ cells. Then, lactate (323381, Sigma‒Aldrich) was added to the plates and incubated at concentrations of 2, 6, and 10 mM. After changing to fresh complete medium, 10 µl of CCK-8 reagent was added to each well and incubated at 37°C for 2 h. A spectrophotometer (M2, MOLECULAR, USA) was used to measure the optical density (OD) values in a wavelength of 450 nm at 1, 2, 3, and 4 days.
EdU staining assay
Cell proliferation activity was measured using an EdU555 assay kit (C0075S, Beyotime). NPC were seeded into 6-well plates at a density of 2 × 10⁵ cells per well. After treated with different concentration of lactate, 2 ml of 10 µM EdU reagent was added to each well of NPC and incubated for 2 h. The cells were fixed at room temperature for 15 min with 2 ml 4% paraformaldehyde. 2 ml of immunostaining strong permeability solution (P0097, Beyotime) was added to each well and incubated for 15 min. 2 ml of click additive solution was added to each well and incubated for 30 min at room temperature (in the dark). The nuclei were stained with Hoechst 33358 solution (C0021, Solarbio, Beijing, China). Immunofluorescent staining images were captured by a fluorescence microscope (IX73, Olympus, Tokyo, Japan).
Cell cycle assay
The effect of lactate on the cell cycle of NPC was evaluated using PI/RNase staining buffer (550825, BD) as well as a FITC-labelled Ki67 antibody (11882S, CST). Briefly, NPC were seeded into T25 cell culture flasks at a density of 4×10⁵ cells. The NPC were treated with different concentrations of lactate when they reached 70% confluence. The cells were then fixed in precooled 70% ethanol for 24 h at -20 ℃ after collection in centrifuge tubes and centrifuged at 400×g for 5 min at 4°C. The supernatants were discarded, and the cells were mixed with Ki67 (1:50 dilution in PBS). After 1 h of incubation in the dark, the cells were incubated with PI/RNase staining buffer for 15 min. Cell cycle progression was analysed by flow cytometry.
Senescence-associated β-galactosidase (SA-β-gal) staining assay
A senescence β-galactosidase Staining kit (C0602, Beyotime) was used to assess the effect of lactate on the senescence of NPC. The cells were seeded into 6-well plates at a density of 2 × 10⁵ cells per well. The NPC were treated with different concentrations of lactate, and 1 ml of SA-β-gal was added to the plates and incubated overnight in a CO2-free environment at 37°C. Five fields were randomly captured to calculate the number of SA-β-gal-positive NPC.
Reactive oxygen species (ROS) level assay
The ROS content in NPC was measured using an ROS assay kit (CA1410, Solarbio). NPC were seeded into 6-well plates at a density of 2 × 10⁵ cells per well, and the NPC were treated with different concentrations of lactate. 2 ml of 10 µM DCFH-DA probe (diluted in serum-free medium) was added to each well and incubated at 37°C for 20 min in the dark. Unbound probe was removed with PBS, the cells were harvested and resuspended in PBS in the dark, and the ROS content was measured by flow cytometry.
Measurement of mitochondrial membrane potential (MMP)
MitoTracker Red CMXRos (C1049B, Beyotime) was used to measure the MMP to assess the mitochondrial function in NPC. Cells were seeded in confocal dishes and treated with different concentrations of lactate. Then 1 ml of MitoTracker Red CMXRos working solution was added to each dish and incubated at 37°C for 30 min in the dark. The nuclei were stained with Hoechst33358 (1:1000, diluted in PBS). The fluorescence intensity in the different groups was observed using a laser confocal microscope (LSM880, ZEISS, Germany).
Malondialdehyde (MDA) measurement
An MDA assay kit (S0121, Beyotime) was used to measure the MDA content in NPC. Lysis buffer was added to cell samples, and the samples were centrifuged at 12000 × g for 10 min to extract cellular proteins. TBA detection solution was added to the supernatants, and then, the absorbance at 532 nm was measured using a spectrophotometer. The MDA content of each sample was calculated according to the standard curve, and then, the protein content of the sample was determined by the BCA method. All the experiments were normalized by the protein content of each sample.
Transmission electron microscopy (TEM)
NPC treated with different concentrations of lactate were digested with trypsin and collected in a centrifuge tube. TEM fixative solution (G1102, Servicebio, Wuhan China) was added to the samples. The cell pellets were isolated from the bottom of the centrifuge tubes, resuspended in fixative solution and then fixed at 4°C in the dark for 24 h. The samples were dehydrated with gradient concentrations of acetone, and osmotic embedding medium was added for embedding. The samples were cut into section with a thickness of 60 nm and then stained with 2% uranium acetate saturated alcohol solution and 2.6% lead citrate. The stained sections were observed under a TEM (HT7800, Hitachi, Tokyo).
RNA sequencing and data analysis
NPC were harvested after 4 days of treatment with lactate at a concentration of 10 mM. RNA sequencing analysis was performed by Bioguoke Biotechnology Co., Ltd. (Beijing, China). Total RNA was extracted from the samples on ice using TRIzol (15596018, Thermo Fisher, Wilmington, DE). The RNA concentration and purity were measured using a NanoDrop 2000 (ThermoFisher). The RNA integrity was assessed using the RNA nano 6000 assay kit of the Agilent Bioanalyzer 2100 system (Agilent Technologies, CA, USA). A cDNA library was constructed, and the library quality was assessed using the Agilent Bioanalyzer 2100 system. The Illumina NovaSeq platform was used for RNA sequencing. Clean data were obtained by removing reads containing adapters, poly-N and low-quality reads from raw data. Transcripts were reconstructed using StringTie, and HISAT2 tools software was used to map the clean data to the reference Rattus norvegicus genome. Gene expression levels were estimated based on fragments per kilobase of transcript per million fragments mapped (FPKM). Differential expression analysis of the 2 groups was performed using the DESeq R package (1.10.1). The corrected p value (FDR < 0.05) and |log2foldchange| (|FPKM| ≥ 1) were used as the thresholds to identify significantly differential expression. KEGG pathway enrichment analysis was performed using KOBAS software (KOBAS, Surrey, UK).
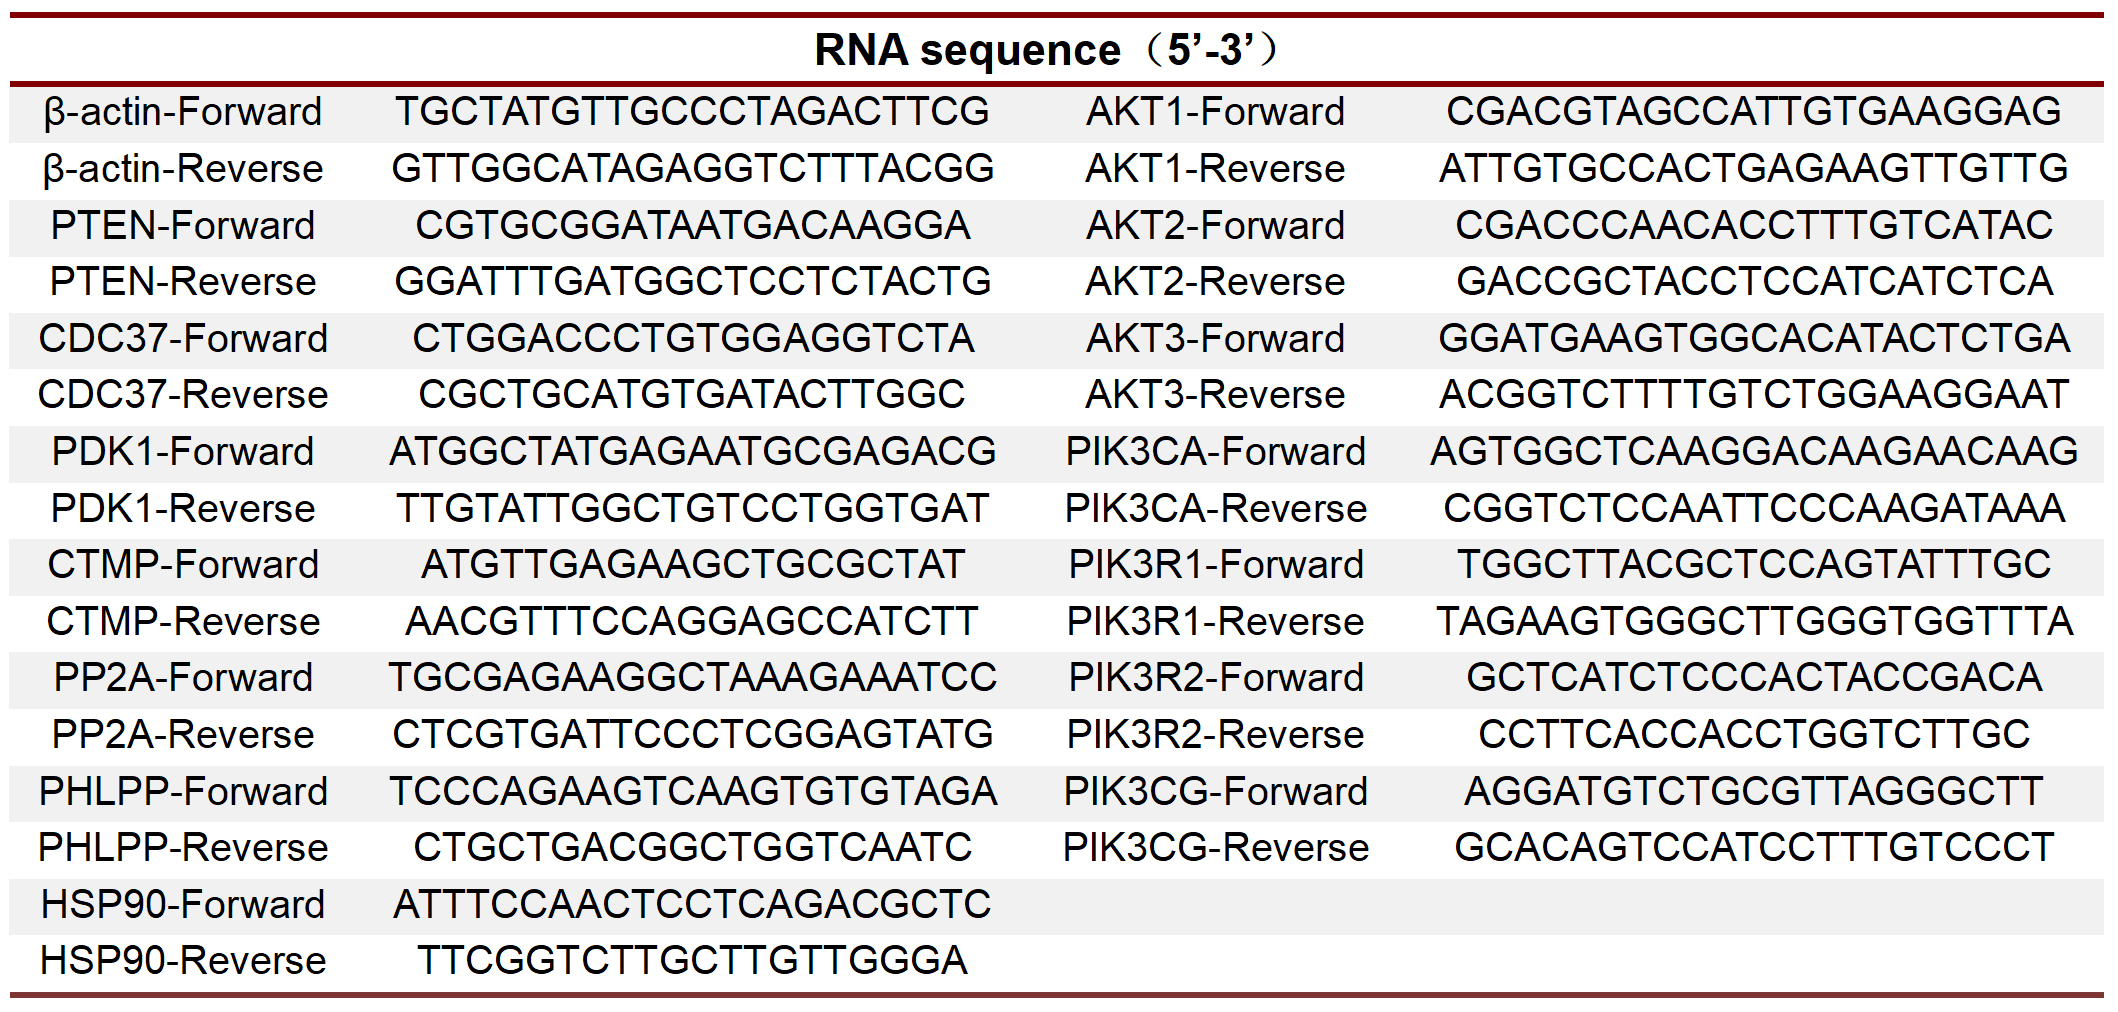
Reverse transcription-quantitative PCR (RT-qPCR) analysis
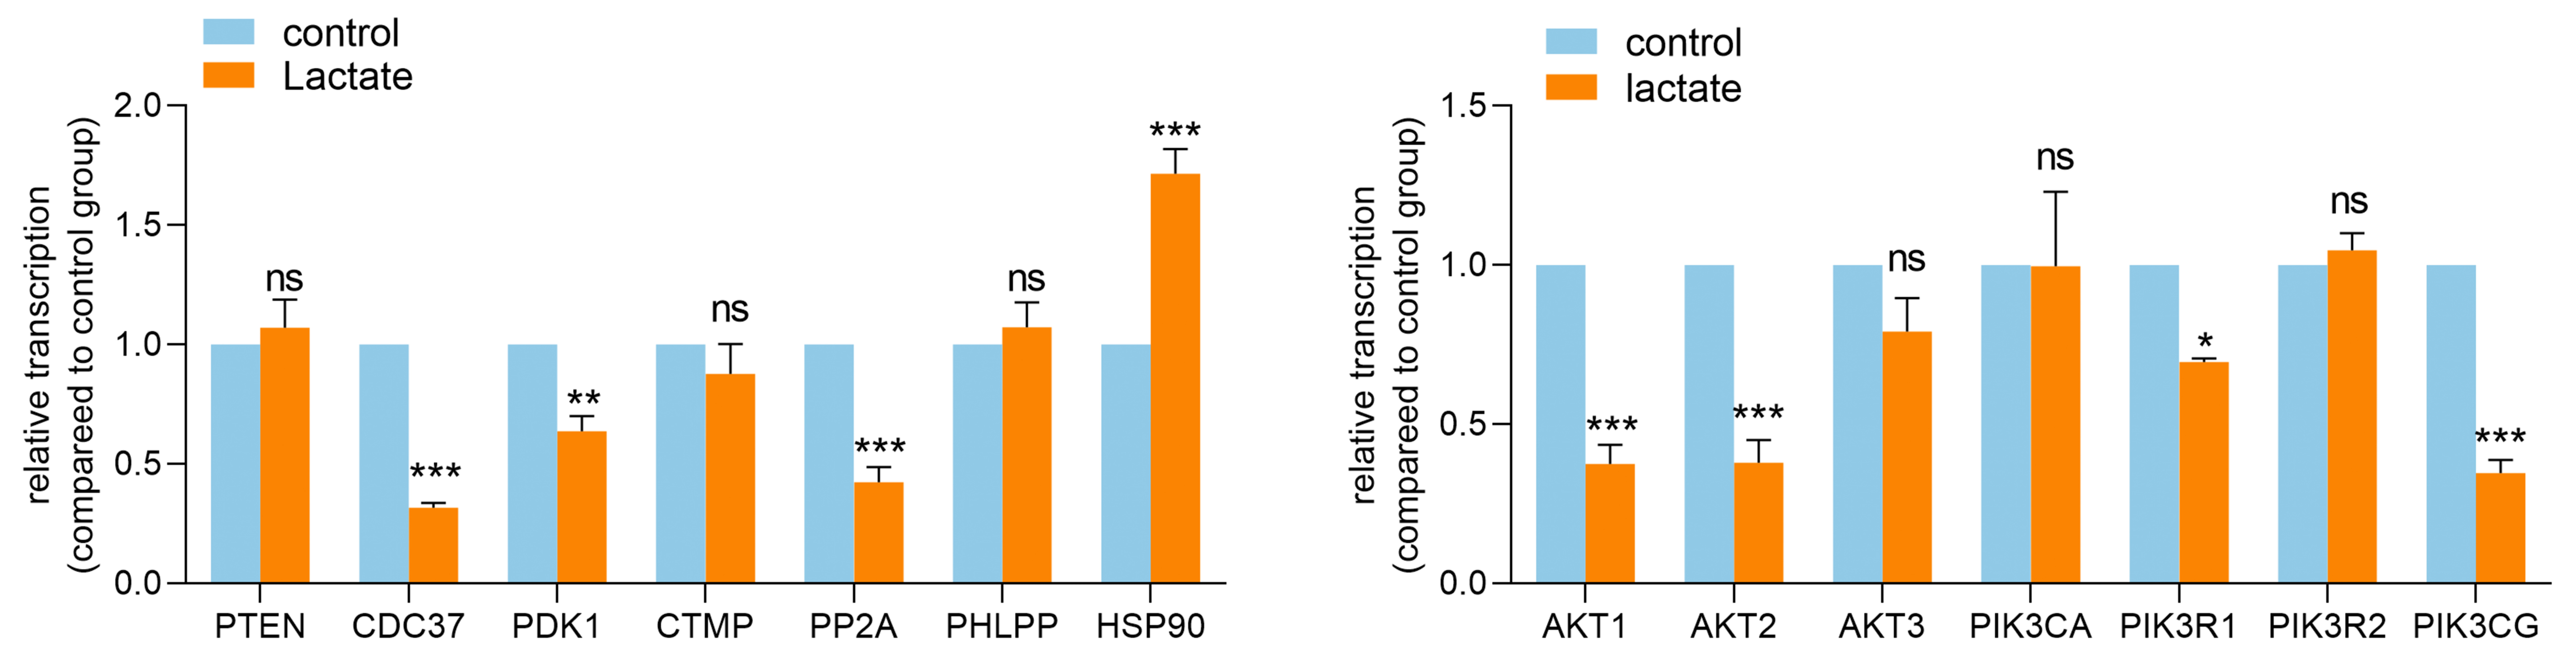
After treated by lactate (10 mM) for 4 days, NPC were washed 3 times with PBS and then treated with Trizol (9109, Takara, Japan) on ice to extract total RNA from cells. The quality and quantity of RNA were analyzed by NanoDrop spectrophotometer (ND-1000, Thermo Scientific, USA). According to the manufacturer's protocols, PrimeScript RT reagent kit (RR047A, Takara) was used for RNA reverse transcription and Premix Ex Taq II Kit (RR390A, Takara) was used for amplification and detecting the relative mRNA expression of target genes with the ViiA 7 RealTime PCR System (Thermo Scientific). The primer sequences were presented in Table S5. β-actin was used to normalize target gene mRNA and relative mRNA expression was calculated using 2−ΔΔCt calculation method.
Akt kinase activity assay
Akt activity was measured using an Akt kinase activity assay kit (ab139436, Abcam, China). NPC were lysed using cell lysis buffer supplemented with PMSF and phosphatase inhibitors, and the protein concentration of each sample was measured by the BCA method. The cell lysates were centrifuged at 12000 × g for 10 min at 4°C, and then, the supernatants were diluted to 30 µl according to the instructions. Each sample contained 2 mg of total protein. A spectrophotometer was used to measure the OD value at 450 nm, and then, the standard curve and Akt kinase activity for each sample were calculated. The data from all the samples were normalized using the Akt kinase activity of the control group (0 mM lactate).
Microscale thermophoresis (MST) assay
The Kd value of the binding of lactate to Akt was measured by Topscience Co. Ltd (Shanghai, China). Akt recombinant protein (ab116412, abcam) was labeled with the NT-647-NHS (Thermofisher) fluorescent probe for 30 min at room temperature in the dark. Then lactate was serially diluted in the reaction buffer (50 mM HEPES buffer, pH = 7.4, containing 0.05% Tween 20). Next, 100 nM labeled Akt was added to the serial dilution. After incubation for 30 min at room temperature, the compounds were examined with Monolith NT.115 instrument (NanoTemper). Experiments were done in triplicate and Kd value was determined using the Monolith sofware (NanoTemper).
Western blotting
NPC were lysed using RIPA lysis buffer (R0010, Solarbio) supplemented with 1% PMSF (P0100, Solarbio) and then centrifuged at 12,000 × g for 5 min at 4°C. A bicinchoninic acid (BCA) assay kit (P0010s, Beyotime) was used to measure the protein concentration. Loading buffer (P1040, Solarbio) was added to the samples, and the samples were placed in a boiling water bath for 5 min. Sodium dodecyl sulfate‒polyacrylamide gel electrophoresis (SDS‒PAGE) technology was used to separate the proteins of different molecular weights in the samples, and then, the proteins were transferred to polyvinylidene fluoride membranes (PVDF; Merck, Germany). After blocking the membranes with QuickBlock Western blocking solution (P0252, Beyotime), antibodies were incubated with the membranes overnight at 4°C. TBST was used to wash off the unbound antibodies, and the membranes were incubated with the secondary antibodies of the corresponding species. The bands were imaged using an ECL assay kit (1705060, Bio-Rad, CA, USA) and a ChemiDoc imaging system (Bio-Rad). ImageJ software was used to measure and analyse the grey value of the strip. The relative expression of the proteins was normalized to β-actin. The antibodies used in this experiment are shown in supplementary material Table S3.
Extraction of cytoplasmic and nuclear proteins
Proteins were extracted from NPC using a nuclear and cytoplasmic protein extraction kit (P0028, Beyotime). A cell scraper was used to scrape the NPC, which were then coincubated with PMSF-supplemented cytoplasmic protein extraction reagent A for 10 min on ice and coincubated with cytoplasmic protein extraction reagent B for 1 min on ice. The mixtures were centrifuged at 12,000 g at 4°C for 5 min. The supernatants were aspirated and considered the cytoplasmic protein. The precipitates were coincubated with PMSF-supplemented nuclear protein extraction reagent and collected in an ice bath for 30 min. The mixtures were centrifuged at 12,000 g at 4°C for 5 min. The supernatants were aspirated, and these supernatants were considered the nuclear protein.
Molecular docking
The two-dimensional structure of lactate was downloaded from the Pub Chem database (https://pubchem.ncbi.nlm.nih.gov/)[35] and saved in "SDF" format. Chem 3D was used to convert the "SDF" format to mol2 structures as small molecule ligands. The rat Akt (ID: P47196) protein structure was retrieved from the UniProt database (https://www.uniprot.org/)[36]. Water molecules were removed using PyMOL 2.3.6 software, and the original ligand was isolated from the core target protein. The processed protein targets were imported into AutoDock 4.2.0 software[37] for hydrogenation, calculation of total charge and setting of atom types. Molecular docking was performed with AutoDock-Vina1.1.2 software[38] to assess the affinity of the receptor‒ligand complexes, and a comprehensive score was provided. PyMOL was used to visualize the docking patterns as 3D structures. The docking effect was evaluated according to its affinity value.
Statistical Analysis
The results are presented as the mean ± standard deviation (SD). Each experiment results were calculated from three biological repeats in technical triplicates. Statistical comparisons between groups were performed using unpaired Student’s t tests, and statistical comparisons among multiple groups were performed using one-way analysis of variance (ANOVA) or two-way repeated-measures ANOVA. p < 0.05 was considered statistically significant. GraphPad Prism 8.0 was used for statistical analysis and plotting histograms.