The Mn2+ and Mo6+ based Metal-mercaptoacetate (Metal-MA) hybrids were prepared by a simple acid-base titration method. The prepared Metal-MA hybrids were analysed by FT-IR spectroscopy, UV-visible spectroscopy, SEM, particle size analyser (PSA), XRD and EDX. The prepared Metal-MA hybrids were investigated to assess their catalytic activity for ring-opening polymerization (ROP) of ε-caprolactone (CL) in the absence of an initiator at 160 oC in N2 atmosphere by varying the catalyst concentration and temperature. The catalytic activity of the Metal-MA hybrid towards the ROP of CL was concluded by the FTIR-RI method. The % yield, degradation temperature (Td), melting temperature (Tm) and molecular weight (Mw) of poly(ε-caprolactone) (PCL) were also investigated. The structure of PCL was comprehended by analysing its NMR spectrum. The activation energy (Ea) for the ROP of CL was determined as 10,363 Kcal/mol. A linear increase in Mw of PCL with the increasing [M0/I0] ratio was also noticed.
Research Article
Synthesis and characterization of Metal-mercaptoacetate hybrids and its application towards ring opening polymerization of ε-caprolactone: A comparative study
https://doi.org/10.21203/rs.3.rs-308770/v1
This work is licensed under a CC BY 4.0 License
You are reading this latest preprint version
Metal-mercaptoacetate
Synthesis
Characterization
Ring opening polymerization
SEM
Poly(ε-caprolactone) (PCL) is the bio-medically important polymers owing to its biodegradability and bio-compatibility. PCL is used in tissue engineering [1], drug release [2], low temperature splinting action [3], scaffold [4] and fluorescent probe carrier material [5]. Such a high potential candidate of PCL can be synthesized by using the various catalyst and initiator systems. Generally, the preparation of PCL is achieved by the ring-opening polymerization (ROP) technique in the presence of a stannous octoate (SO) catalyst. The SO catalyst is toxic, and it is necessary to remove the catalyst after the ROP of CL. Sometimes the catalyst removal process under mild acidic condition leads to a decrease in Mw of PCL due to hydrolysis, and also it is a time-consuming process. In order to avoid such an unwanted process, recently two in one system (i.e) a single species is acting both as a catalyst and an initiator for the ROP of CL. Moreover, the removal of catalyst or initiator from the polymer backbone after the ROP is unavoidable. For this purpose, the metal complexes are widely employed as a catalyst in the absence or presence of an initiator system. First, let us review the ROP of CL in the presence of a metal complex as a catalyst and a separate chemical initiator.
Mg complex catalyst coupled with p-fluorophenol initiator system was used for the ROP of CL [6]. Raghavendra et al. [7] used Mg complex/benzamidine initiator for the polymerization of CL by the ROP method. Similarly, other systems like Al complex/indole [8], dialkly Al complex/butanol [9], Sn complex/R-OH [10], MX/ROH [11], Lanthanam complex/BH4 [12], t-BuBoran/1-pyrenebutanol [13], tris(pentafluoro) Borane/benzyl alcohol [14] and Uranium complex/imidazoline [15] were employed as an initiator cum catalyst towards the ROP of CL. In 2016, Scrivanti et al. [16] studied the ROP of CL in the presence of the Lanthanam complex as a catalyst and acid as a chemical initiator. In 2019, Manganese-salen complexes were used as an initiating system for the polymerization of CL [17]. There are no findings on the Metal-MA initiating system towards the ROP of CL in the open literature.
Recently, metal salts and their complexes are employed as an initiator cum catalyst for the ROP of cyclic esters. Metal-alkoxide complex [18], Mn(II)-asymmetric SB complex [19], Mn-salen complex [20], Co complex [21], Mo complex [22], Mn-oxydianiline complex [23], Zn complex [24], Al-salicylaldimine complex [25], V complex [26], Al-phenolate complex [27], Zn complex [28], Ru complex [29], Zn-phenoxyimine complexes [30], Ti complex [31] and Sm complex [32] were employed for the ROP of CL. Among the metal complexes, Mn and Mo complexes were considered in the present research work due to the following reasons. Mn is a “d” block transition metal with the outermost electronic configuration of 3d5. Mn has different possible stable oxidation states. It is naturally available in protein and enzymes. Mo is an inorganic element with the outermost electronic configuration of 4d55s1. Mo has various possible oxidation states due to the half-filled 4d and 5s orbital. It is a bio-metal and used as a mineral. Mo-based catalyst systems are highly active, stereo-controlled and fast. Moreover, the Mn2+ complex yields a linear or two armed complex systems, whereas the Mo6+ complex yields a six-armed complex-like system. This motivated the authors to carry out the present work. The novelty of this work is the utilization of a single Metal-MA as both an initiator and a catalyst for the polymerization of CL. Moreover, it is not necessary to remove the catalyst even after the polymerization reaction from the polymer backbone because of its biocompatibility.
2.1. Materials
ε-Caprolactone (CL) and manganese carbonate (MnCO3, CDH chemicals, India), ammonium heptamolybdate (Spectrum chemicals, India), diethyl ether and CHCl3 (Merck, India), mercapto acetic acid (MAA, S.D. Fine chemicals, India) were procured to carry out this experimental work.
2.2. Preparation of Manganese mercaptoacetate (Mn-MA) and Molybdenum mercaptoacetate (Mo-MA) hybrids
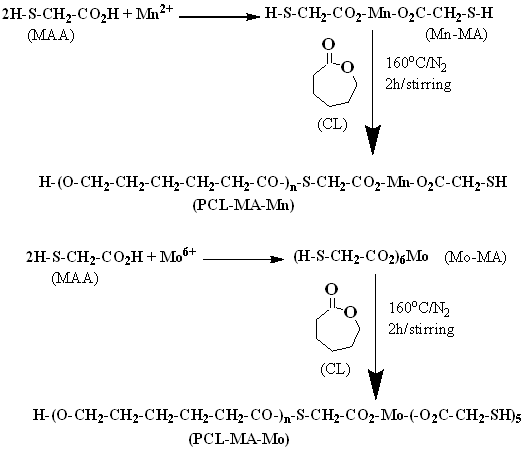
5 g Manganese carbonate and 5 g MAA (weight basis) were mixed and stirred vigorously with 100 mL double distilled water (DDW). The vigorous stirring was continued for 30 min at 45 °C under an N2 atmosphere. Then, the formation of the white slurry was filtered and dried at 110 °C. The end product of the white precipitate was Manganese mercaptoacetate (Mn-MA). The acid group of MAA interacted with the Mn2+ to form Mn-MA with the free thiol group for further structural modification (Scheme 1). The dried mass was named as Mn-MA and stored under an N2 atmosphere.
5g of ammonium heptamolybdate was mixed along with the same quantity (5 g) of MAA in 100 mL DDW under stirring. The contents were stirred under an N2 atmosphere for 30 min at 45 oC. The final product was filtered, and the filtrate was evaporated to dryness at 110 oC for 3 hours and named as Mo-MA with a free thiol group. The reaction is shown in Scheme-1.
2.3. Preparation of Metal-MA end-capped PCL
The preparation of PCL had been employed using the literature procedure [3]. One g of CL monomer was charged in a 25 ml capacity round-bottomed flask. With this, 0.01 g Metal-MA was added with mild stirring at 160 oC for 2 hours. The ROP of CL was performed by varying the experimental conditions such as [M0/I0] ratios and temperature. The [M0/I0] ratio was kept as 10, 50, 100, 200 and 400. After the thorough mixing, the RB flask was placed at 160 °C in an oil bath to initiate the ROP of CL [2,3]. After 2 hours of ROP, a highly viscous mass was obtained. Then, it was poured in 20 mL of CHCl3 solvent. Further, the dissolved polymer product was precipitated by adding 200 mL diethyl ether in the above solution, and the collected precipitate was dried in a fume hood to obtain the Metal-MA end-capped PCL. In such a way, the Metal-Mo end-capped PCL was also prepared at various [M0/I0] and different temperatures.
2.4. Characterization
The functional groups present in the samples had been analysed by using the recorded FT-IR spectra on a Shimadzu 8400S instrument, Japan to conclude their structure. All the recorded 13C and 1H NMR spectra on a Bruker K 8600 instrument had been analysed to comprehend the structure of the polymer samples. The bandgap value had been estimated for the prepared samples by using the recorded UV-visible spectra on UV-1800 Shimadzu double-beam spectrophotometer, Japan. The determination of molecular weight (Mw) had been performed using an eluent (THF) at a rate of flow of 1mL/min against polystyrene standards with the help of a Waters 2690 GPC instrument for the prepared polymer. The DSC thermogram had been recorded on a Toledo DSC 822E instrument in an inert ambient within the temperature scale of 30 °C – 100 °C at 10 °C/min to comprehend the melting temperature of the samples. The thermal stability of the sample had been concluded by inspecting the recorded TG thermograms on TG/DTA thermal analyser, USA within the temperature scale of 30 to 800°C at 10°C min−1 in air ambiance. The grain size of the sample had been analysed using the DT 1201 particle size analyser. The surface texture of the sample had been inspected by recording the SEM micrographs on an SEM-Hitachi S4800 instrument, Japan.
2.5. Determination of band gap value
In the recent research work, multivalent metal ions were used for the hybrid preparation. Hence, it is necessary to know its band gap before and after the hybrid preparation. The direct bandgap values of the polymer system had been estimated by using Tauc’s mathematical expression as given in Eq. 1.

where, Eg - bandgap, α – coefficient of absorption, υ – frequency, A – constant and h - Planck’s constant.

where, M - carbonaceous matter and Eg – optical bandgap
This section has been divided into two parts namely, (i) Characterizations of Metal-MA hybrid and (ii) Characterizations of Metal-MA end-capped PCL.
3.1. Characterization of Metal-MA hybrid
The above synthesized Metal-MA catalyst is analyzed by using various analytical tools like FT-IR, UV-visible spectroscopy, reflectance study, SEM, XRD, EDX and PSA.
3.1.1. FT-IR study
The FT-IR study infers an idea about the presence of functional groups in the system. Figure 1A (a) shows the FT-IR spectrum of Mn-MA hybrid with a broad peak at 3396 cm− 1, 2982 cm− 1, 2941 cm− 1 and 1732 cm− 1 corresponding to the stretching of -OH, C-H symmetric, anti-symmetric stretching and C = O stretching [33] respectively. The bending of C-H, stretching mode of C-S and linkage of C-O-C can be seen at 1605, 1385 and 1202 cm− 1 respectively. The out of plane bending of C-H vibration appears at 692 cm− 1. The -OH stretching is due to the water molecule that is associated with the central Mn2+ ions.
3.1.2. UV-visible analysis
Figure 1A (b, c) illustrates the UV-visible spectrum of the Mn-MA hybrid. From the Tauc’s plot [Fig. 1A (d, e)], the bandgap value is calculated as 4.84 and 3.53 eV respectively for the MnCO3 and Mn-MA systems. The bandgap value of Mn complexes is reported as 2.76 eV [34]. The present investigation yielded a somewhat higher bandgap value due to the salt formation with the MAA. From the bandgap value, one can find out the carbonaceous matters by using an Eq. (4). The number of the carbonaceous matter before and after treatment with MAA is calculated as 50.2 and 94.4 respectively. The increase in carbonaceous matter is due to the formation of Mn-MA.
3.1.3. Reflectance study
Before and after the Mn-MA formation, the reflectance value is recorded using a UV-visible spectrophotometer and represented in Fig. 1A(f, g) respectively. From the spectrum, it is found that at a lower wavelength, there is a slight difference in the reflectance value, whereas there is no change in the reflectance value at a higher wavelength. It means that the reflectance of MnCO3 and Mn-MA is merged at a higher wavelength.
3.1.4. EDX study
The Mn-MA formation is further confirmed by the EDX spectrum. The % composition of Mn-MA hybrid is computed from the EDX spectrum as illustrated in Fig. 1A (h). The % content is given below: Mn-7.17%, C-28.65%, O-45.66 % and S-7.00%. The appearance of C, O and S confirmed the salt formation between Mn2+ and MAA.
3.1.5. Particle size analysis (PSA) report
Figure 1A (i) represents the PSA image of the Mn-MA system. The image shows the particle size of Mn as 80–800 nm. The PSA report confirms the presence of the hierarchical structure of Mn-MA. The nanometer-sized particle gives an idea about the reduction reaction, whereas the peak around 800 nm declares the metal salt formation.
3.1.6. XRD report
The crystalline nature of the Mn-MA is confirmed by XRD analysis {Fig. 1A(j)}. A diffractogram exhibits the d(211), d(222) and d(321) crystal planes at 20.9, 33.14 and 48.7 and 35.90 respectively [34]. An important point noted here is that the d(222) plane of Mn2+ appeared two times at 33.14 and 48.930. A crystal plane at 48.930 is ascribed to the Mn salt formation, whereas d(222) plane at 33.14 confirmed the interaction between Mn2+ and thiol group of MAA. Thus the XRD confirms the presence of Mn and MAA. This indirectly indicates that the thiol group of MAA should reduce the Mn2+ into Mn0 during the reaction. Hence, the XRD confirms the reduction as well as salt formation reactions simultaneously.
3.1.7. SEM analysis
The SEM image of the Mn-MA hybrid is illustrated in Fig. 1A(k). One can see some microvoids on the surface. The materials having a similar kind of morphology find potential applications in the bio-medical field. Some nanoparticles are also present. This system forms the hierarchical structure of the Mn-MA hybrid system. The preparation of hierarchical structure is clearly explained in the earlier report [35].
3.1.8. FT-IR study
Figure 1B(a) depicts the FT-IR spectrum of Mo-MA nanohybrid. The -OH stretching (3471cm− 1), symmetric mode of C-H stretching (2858cm− 1) and antisymmetric (2943 cm− 1) vibrations, C = O (1714cm− 1) [3], C-H bending (1556cm− 1), stretching of C-S vibration (1410 cm− 1) [3], C-O-C (1173 cm− 1) and C-H out of plane bending mode (730 cm− 1) were assigned in their respective wavenumbers. The appearance of stretching modes of C-S ascertained the surface functionalization of Mo by MAA.
3.1.9. UV-visible analysis
The UV-visible spectra of ammonium heptamolybdate before and after the surface functionalization are displayed in Fig. 1B (b, c). Figure 1B (d, e) demonstrates the Tauc’s plot of ammonium heptamolybdate and Mo-MA systems respectively. The bandgap energy was calculated as 4.41 eV for ammonium heptamolybdate and 2.52 eV for the Mo-MA hybrid system. It indicates that after the nanohybrid formation, the Eg value was reduced. This confirmed the increase in the electrical application of Mo-MA. A similar observation was noted in the earlier literature report [36]. The M value was calculated by using Eq. (4). The M value for ammonium heptamolybdate is 69.6, and it was calculated as 176.7 for Mo-MA. The increase in the carbonaceous matter proved the formation of Mo-MAA. The UV reflectance spectra of ammonium heptamolybdate and Mo-MA are given in Fig. 1B (f, g) respectively. The Mo-MA system exhibited a higher reflectance, which indicated the hydrophobic characteristics of the hybrid.
3.1.10. EDX study
Figure 1B (h) denotes the EDX spectrum of the Mo-MA hybrid. The % atomic weight of Mo, C, O and S was estimated as 32.6, 15.18, 48.16 and 4.0 respectively. This confirmed the nanohybrid formation between the ammonium heptamolybdate and MAA.
3.1.11. XRD analysis
The semi-crystalline nature of the Mo-MA nanohybrid was tested by XRD. The XRD of Mo-MA is given in Fig. 1B (i). The diffractogram exhibits two crystalline peaks at 2θ = 12.99° and 25.9° corresponding to d(022) and d(210) crystal planes respectively [37]. The decrease in the crystalline nature of Mo is purely due to the formation of the Mo-MA nanohybrid.
3.1.12. Particle size analysis (PSA) report
Figure 1B (j) indicates the PSA profile of the Mo-MA system. The variation in the particle size of the Mo-MA system is in the range of 100 to 1000 nm. This refers that the central Mo6+ ion may be reduced by the MAA to Mo0 during the reaction. Thus reduced Mo0 was surface functionalized by the thiol group of MAA and formed the Mo-S linkage. This reduction reaction leads to the formation of Mo nanoparticles. Another possibility is salt formation. Six moles of MAA can interact with Mo6+ and forms salt through the acid group of MAA. The salt formation leads to a bigger size particle. Thus the Mo-MA hybrid leads to the hierarchical structure.
3.1.13. SEM analysis
Figure 1B (k) indicates the SEM image of the Mo-MA system. The morphology looks like a broken stone which is laid one over the other. Meanwhile, some nanoparticles are also seen in between the stones. The particle size was noted as less than 50 nm. Micrometer sized particle is also seen here. This confirmed the hierarchical structure of the Mo-MA nanohybrid system.
3.2. Studies on Metal-MA end-capped PCL
The ROP of PCL had been employed by varying the ratio of [M/Mn-MA] and temperature. The order of reaction and activation energy (Ea) for the ROP of CL are calculated by FT-IR-RI.
3.2.1. Yield study
The catalytic ability of Metal-MA hybrid for the ROP of CL was assessed through the determination of % yield. While increasing the [Mo/Io] ratios, the % yield was slowly decreased owing to the lesser number of initiating species. The data is given in Table 1. The decrease in % yield from 99 to 85 declared that the given Mn-MA is acting both as an initiator and catalyst for the polymerization of CL. A similar observation was noticed for the Mo-MA system (Table 1) too. Here, the % yield was decreased from 99 to 91% owing to the decrease in initiator cum catalyst concentration (i.e) decrease in Mo-MA concentration. In comparison, the Mo-MA system exhibited a somewhat good % yield due to the higher oxidation state of Mo. The Mn exhibits a + 2 oxidation state, whereas Mo exhibits a + 6 oxidation state, which led to the two armed and six-armed-like structures respectively after the ROP of CL.

3.2.2. Effect of [Monomer/Metal-MA] on the FT-IR-RI of PCL
The catalytic efficiency of the Metal-MA hybrid for the ROP of CL was examined at different Metal-MA concentrations. The ratio of [Monomer/Metal-MA] or [Mo/Io] had been varied from 10 to 400 by maintaining the other experimental factors as constant. The FT-IR relative intensity (RI) method was adopted to estimate the rate of ROP of CL by the Mn-MA system. Figure 2A (a-e) indicates the FT-IR spectrum of PCL prepared at various ratios of [Monomer/Mn-MA]. A peak associating with O-H stretching is noticed at 3500 cm− 1. This is due to the carboxyl group of MAA or the OH group of PCL. The symmetric and anti-symmetric modes of C-H stretching are observed at 2862 cm− 1 and 2958 cm− 1 respectively. Similarly, the stretching of C = O, linkage of C-O-C and out-of-plane bending of C-H vibration (OPBV) are seen at 1726 [2, 3], 1186 and 736 cm− 1 respectively. A peak at 1377 cm− 1 is linked to the C-S stretching. A log-log plot of [M/Mn-MA] Vs RI[C=O/C−H] is drawn to estimate the order of ROP of CL during the [Monomer/Mn-MA] variations {Fig. 2A(f)}. It is found that the FT-IR RI is linearly increased with the increasing ratio of [Monomer/Mn-MA] from 10 to 400. The obtained slope value of 0.09 proved that 0.09 mole of hybrid is enough to prepare 1 mole of PCL. In the present research work, the hybrid acts not only as an initiator but also acting as a catalyst.
200, e 400, g log[Monomer/Mn-MA] Vs log(RI[C=O/C−H]) plot. B: FT-IR spectrum of PCL prepared at different [Monomer/Mo-MA], a 10, b 50, c 100, d 200, e 400, g [Monomer/Mo-MA] Vs log(RI[C=O/C−H]) plot.
Here, the efficiency of the Mo-MA hybrid was investigated under different experimental conditions (i.e.) [Monomer/Mo-MA] as mentioned earlier. During the experimentation, the other experimental conditions were kept constant. For instance, the [Monomer/Mo-MA] ratio was varied between 10 and 400, and their FT-IR spectra are represented in Fig. 2B (a-e). All the important peaks are discussed here. The PCL contains chain-ended -OH stretching (3446cm1), stretching of C = O (1727cm− 1), linkage of ester C-O-C stretching (1185cm− 1) and C-H OPBV (739cm− 1) [2]. The C-S stretching of MAA is noticed at 1375 cm− 1. Thus the FT-IR spectrum confirms the functionality of the PCL ends with the Mo-MA system. The peak area of C = O stretching at 1727 cm− 1 is increased with an increasing ratio of [M/Mo-MA]. A graph was drawn between [M/Mo-MA] and RI[C=O/C−H] to obtain the order of the ROP of CL {Fig. 2B (f)}, and the slope value was determined as 0.08. It indicates that 0.08 mole of initiator needed to form 1mole of PCL. This proved the catalytic and initiating ability of the hybrid for the ROP of CL.
3.2.3. Effect of temperature on the FTIR-RI of PCL
In this research work, the influence of temperature on the ROP of CL was tested. The FTIR -RI is calculated at different temperatures by keeping the other experimental conditions constant. Here also, the above said peaks are obtained {Fig. 3A(a-e)}. The [Monomer/Mn-MA] variation is used for the determination of the order of ROP, whereas the temperature variation leads to the determination of Ea value which is calculated by plotting 1/T Vs log(RI[C=O/C−H]) {Fig. 3A(f)}. From the slope value, the Ea value is evaluated as 10,363.37 Kcal/mol. The determination of Ea value based on either UV-visible absorbance or FTIR-RI yields almost closer values as compared to the original values. The significance of the present research work is that it is not necessary to remove the Mn salt due to its biocompatibility after the ROP.
The ROP of CL at different temperatures in the presence of the Mo-MA system was also performed, and the FT-IR spectra of the prepared samples are given in Fig. 3B(a-e). It also exhibited the above-discussed peaks invariably. The Ea was determined as 5836.46 Kcal/mol from the slope of 1/T Vs log (RI[C=O/C−H]) plot (Fig. 3B(f)). This low Ea value concluded that this hybrid is a potential catalyst and an initiator for the polymerization of CL. Moreover, the hybrid is free of cytotoxic effect since Mo is a bio-metal. Generally, the ROP of CL is initiated by Sn salt. Unfortunately, Sn salts produced a cytotoxic effect. The present investigation suggested that instead of Sn salt, the Mn and Mo salts can be used as an initiator cum catalyst toward the ROP of CL. The catalytic activity of Metal-MA hybrids is further confirmed by GPC.
3.2.4. NMR spectral study
Figure 4A indicates the 1H- NMR spectrum of PCL synthesized at the ratio of Monomer/Mn-MA = 100 to conclude the structure of the polymer system. The signal for –OCH2 protons is assigned at 4.2 ppm, and the signal for –COCH2 protons is appeared at around 2.4 ppm [2]. The remaining proton of PCL is seen between 1 and 2 ppm. The -S-CH2 proton signal is observed at 3.8 ppm. The signals for solvent (CDCl3) and the standard TMS appear at 7.3 ppm and 0.00 ppm respectively. Figure 4B represents the 13C-NMR spectrum of PCL prepared at the [Monomer/Mn-MA = 100] ratio. The –OCH2 and –COCH2 carbon signals appear at 66 ppm and 173 ppm [2] respectively. The other carbon signals are matched with the structure of Mn-MA end-capped PCL.
The Mo-MA nanohybrid initiated cum catalyzed ROP of CL was ascertained by the 1H-NMR spectrum. Figure 4C displays the 1H-NMR spectrum of PCL synthesized in the presence of the Monomer/Mo-MA = 100 system. The –OCH2 and –COCH2 proton signals were observed at 4.2 ppm [2] and 2.3 ppm respectively. The remaining proton signals were matched with the structure. The –S-CH2 proton signal of Mo-MA occurred at 3.8 ppm. This proved the Mo-MA hybrid’s ring-opening ability of CL. Figure 4 depicts the 13C-NMR spectrum of PCL prepared at the ratio of Monomer/Mo-MA = 100. The carbonyl signals and the –OCH2 carbon signals were observed at 173 ppm and 62 ppm respectively [2]. The signal due to MAA was not occurred owing to the low concentration or negligible amount of MAA attached to the PCL chains. Thus both 13C-NMR and 1H-NMR spectra proved the structure of Mo-MA end-capped PCL. It means that the Mo-MA system was acted as both initiator and catalyst toward the ROP of CL.
3.2.5. GPC analysis
The catalytic activity of Mn-MA on the ROP of CL is confirmed by the GPC technique. The Mw, Mn and polydispersity (P.D) values are increased on increasing the [Monomer/Mn-MA] ratio {Fig. 5A(a-e)}. While decreasing the initiator concentration from 10 to 400, the Mw of PCL is increased from 13,280.2 to 16,381.7 g/mol. The P.D values are varied between 1.5 and 2.0 (Table 1). This confirmed that the Mn-MA system is the right candidate for the polymerization of CL by the ROP method. Moreover, Mn is a bio-metal, and hence there is no harmful effect to the human body. When compared with –OH or –NH2 or –CO2H, the –SH is a moderate initiator cum catalyst for the ROP of CL. The change in Mw confirmed the catalytic effect of the Mn-MA hybrid system.
The GPC was recorded to conclude the initiating and catalytic ability of Mo-MA nanohybrid during the ROP of CL as illustrated in Fig. 5B (a-e). It was found that there was a linear increase in the values of both Mw and Mn while raising the [Monomer/Mo-MA] ratio. The Mw was varied between 10,188 and 18,750 g/mol.2 Above all, the P.D values are varied between 1 and 2 (Table 1). This proved the formation of PCL without any cross-linking or branching. The Mw is good enough when compared with other initiators [2]. Hence, the GPC results declared the initiating and catalytic capability of Mo-MA nanohybrid for the ROP of CL.
3.2.6. Thermal properties of Metal-MA end-capped PCL system
The catalytic activity of metal salts is further confirmed by determining the thermal properties of the obtained PCL. The DSC thermograms of PCL prepared at different concentrations of [Monomer/Mn-MA] are displayed in Fig. 6A(a-e). The increase in Mw of PCL was noticed owing to the decreasing of [Mn-MA] with the increasing ratio of Monomer/Mn-MA resulting with there was an increase in Tm of PCL from 68.4 to 71.6° C (Table 1). The increase in Tm is purely due to the increase in Mw of PCL [3]. The TG thermograms of PCL tagged Mn-MA systems prepared at various [Monomer/Mn-MA] ratios are represented in Fig. 6A (f-j). The decomposition of polymer systems occurs in a two-step. There is no loss of mass up to 250°C even due to the loss of moisture. Around 350°C, a major weight loss occurs due to the decomposition of PCL. The decomposition of the Mn-MA system occurs at 425 oC as a minor weight loss with the evolution of CO2. The degradation temperature (Td) of PCL is increased on increasing the [Monomer/Mn-MA] ratio. The increase in thermal stability is due to the increase in Mw of PCL. At a higher [Monomer/Mn-MA] ratio, the availability of initiating species is very low. The less number of initiating species leads to the PCL formation with high molecular weight [2]. The percentage of remaining weight residue of Mn is observed above 450°C (~ 10%).
The DSC thermograms of the Mo-MA end-capped PCL prepared at various [Monomer/Mo-MA] ratios are depicted in Fig. 6B (a-e). The increase in Tm of the PCL was noticed with the increasing ratio of Monomer/Mo-MA (Table 1). The melting temperature (Tm) of PCL was varied from 64 to 76 oC [2] {Fig. 6B(a-e)}. The Tm data is given in Table 1. The enhancement in Tm of PCL is mainly because of the increase in Mw. The increase in Tm confirmed the ROP of CL in the presence of the Mo-MA initiator system. The TG thermogram of the Mo-MA end-capped PCL system exhibited a single-step degradation process without any mass loss up to 250°C (Fig. 6(f-j). The degradation of the PCL backbone started around 250°C associated with a major mass loss [21]. The degradation temperature (Td) of PCL prepared at different [Monomer/Mo-MA] ratios is given in Table 1. The % residue of mass left beyond 450°C is due to the presence of incorporated Mo (Fig. 6 (f-j)). The increase in Td of PCL confirmed the Mo-MA system’s ring-opening ability. Hence, the DSC and TGA studies proved the catalytic performance of the Metal-MA system toward the ROP of CL.
3.2.7. EDX, SEM and XRD of Metal-MA end-capped PCL
The EDX profile of Mn-MA end-capped PCL is displayed in Fig. 7A(a). The % content of Mn after the end-capping with PCL is found to be reduced (3.2%) when it is compared to the hybrid one. At the same time, the % content of C and O is enormously increased. This confirms the end-capping of PCL with Mn-MA. Figure 7A (b) illustrates the XRD of Mn-MA end-capped PCL with a sharp peak at 21.49, 22.24 and 23.76° corresponding to various crystal planes of semi-crystalline PCL as mentioned in the figure [38]. Due to the low content of Mn-MA in the PCL matrix, the crystalline peaks of the Mn-MA system are compressed. The presence of crystalline peaks associating with PCL confirmed the ROP of CL by the Mn-MA catalyst cum initiator system. The surface morphology of PCL tagged Mn-MA is portrayed in Fig. 7A(c). The morphology looks like a dried sky with some microvoids. The materials having a similar morphology can be used for drug loading purposes in the biomedical field.
The EDX analysis was performed to identify the % composition of the PCL tagged Mo-MA system as demonstrated in Fig. 7B (a), and the % content is illustrated here: Mo-19.18 %, C-32.60 %, O- 45.16 % and S-3.00 %. The increase in C and O content explains the formation of the Mo-MA end-capped PCL system. Figure 7B (b) demonstrates the XRD of PCL prepared at [Monomer/Mo-MA] = 100. The assigned diffraction peaks at 21.40, 22.10 and 23.80 are attributed to the d(111), d(110) and d(200) crystal planes of semi-crystalline PCL [38]. The crystalline peaks of Mo-MA are not appeared due to its very low content in the PCL matrix. The SEM image of Mo-MA end-capped PCL is shown in Fig. 7B(c). It exhibits the broken stone-like morphology with micro-voids associating with the PCL surface. Some nanoparticles are also seen due to the presence of Mo-MA nanohybrid. The EDX, XRD and SEM confirmed the formation of PCL. This concluded that the Metal-MA hybrid is an ideal initiator cum catalyst for polymerization of CL.
3.2.8. UV-visible and bandgap studies
The UV-visible spectra of PCL tagged Mn-MA system prepared at various [Monomer/Mn-MA] ratios are depicted in Fig. 8A (a-e). Here, the main intention is to study the influence of polymer chain length on the bandgap of Mn2+.
The UV-visible spectra of Mo-MA end-capped PCL system prepared at various [Monomer/Mo-MA] ratios are given in Fig. 8B (a-e). The bandgap of the samples was estimated by using their absorbance value. It was found that while varying the [Monomer/Mn-MA], the bandgap is increased owing to the decrease in hybrid concentration and the surface functionalization reaction {Fig. 9A(a-e)}. During this variation, the bandgap value is increased from 3.43 to 4.38 eV {Fig. 9A(f)}. After the formation of Mn nanoparticles, due to the encapsulation effect, the number of carbonaceous matter is found to be reduced. It means that the added hybrid simply acts as filler. The M value {Fig. 9A(g)} is calculated which inferred that while decreasing the number of initiator concentrations, the chain length of the polymer is increased. Hence, the encapsulation effect is more and more favourable owing to an increase in the chain length. The M value is slowly increased due to the encapsulation effect on increasing the [Monomer/Mn-MA] ratio. On critical comparison, the M and band gap values are varied with the concentration of hybrid in the opposite trend. The M values are suddenly decreased on increasing the [Monomer/Mn-MA] ratio.
The bandgap values of the Mo-MA end-capped PCL systems were determined using Eq. 1. The Eg values are 2.14, 3.39, 3.50, 3.61, and 3.95 eV corresponding to the [M/Mo-MA] ratio of 10, 50, 100, 200 and 400 respectively (Fig. 9B (a-e)). The Eg value indicated that the number of initiating species was reduced on raising the [Monomer/Mo-MA] ratios. The decrease in hybrid concentration leads to high molecular weight polymer and offers the encapsulation effect. From the bandgap value, the M values for PCL prepared at various [Monomer/Mo-MA] ratios were calculated. The variation of M was between 75 and 256. It means that the increase in Mw of PCL while raising the [Monomer/Mo-MA] ratios led to the formation of more and more coil-like PCL structures [3]. The plots of [Monomer/Mo-MA] against the bandgap and [Monomer/Mo-MA] vs. M values are given in Fig. 9B(f) and (g) respectively. While increasing the [M/Mo-MA] ratio, the bandgap is increased, whereas the M value exhibits a decreasing trend. During the ROP of CL, the interaction between Mo and MAA was broken, and it led to the dispersion of metal ions on the PCL backbone due to high temperature. Thus the relieved metal ion simply occupies the coils or empty spaces between the polymer chains. In such a way, the metal ions act as fillers. The change in bandgap value confirmed the interaction between Metal-MA and PCL. It also confirmed the catalytic ability of Metal-MA towards the ROP of CL.
3.2.9. Reflectance study
The catalytic activity of Metal-MA hybrid on the ROP of CL is further co-supported by reflectance study. While increasing the ratio of Monomer/Mn-MA, the reflectance value of PCL is enhanced slowly due to the increase in Mw. Figure 10A (a-e) represents the UV reflectance spectrum of PCL prepared at different ratios of Monomer/Mn-MA. The difference in % of reflectance value at lower wavelength is considerably high, whereas at the higher wavelength the difference in the reflectance value is low. The % of reflectance clearly explains that the Mw and the hydrophobic nature of PCL are increased with the increasing ratio of Monomer/Mn-MA.
The reflectance spectrum of PCL prepared at different ratios of [Monomer/Mo-MA] was examined by UV reflectance spectrum. An increase in reflectance with the increasing ratio of Monomer/Mo-MA is understood from Fig. 10B (a-e). Moreover, the chain length of PCL was increased with a decreasing concentration of catalyst cum initiator. Hence, there was an increase in Mw of PCL [2]. The hydrophobic character is increased with an increase in molecular weight.
The C-S stretching of Mn-MA end-capped PCL appeared at 1377 cm− 1in the FT-IR spectrum. The Ea value was calculated as 10,363.37 Kcal/mol from FTIR-RI values. The signal for –OCH2 protons of PCL is assigned at 4.2 ppm in the 1H-NMR spectrum. The GPC results confirmed that the increase in Mw of PCL with the increasing ratio of [Monomer/Metal-MA] was owing to the availability of limited initiating species. The increase in Mw leads to the more and more coil-like structure of Metal-MA end-capped PCL. The Td and Tm of PCL were increased with the increasing ratio of [M0/I0]. Moreover, the increase in Mw leads to an increase in hydrophobicity of PCL, and this was confirmed by the reflectance spectrum. There was a reduction in the bandgap value of Mn due to the hybrid formation and end-capping of PCL. The SEM morphology declared the broken stone-like morphology of PCL. It also suggested that PCL with this type of morphology is suitable for the biomedical and membrane filtration field. In this way, the main target of the present investigation was achieved.
Conflict of interest:
All the authors have no conflict of interest.
- E. Malikkmammadov, T.E. Tahir, A. Kiziltay, and V. Hasirei, J. Biomater. Sci. Polym. Ed., 29, 863 (2018).
- B. Meenarathi, P. Siva, M. Jeyapriya, and R. Anbarasan, Adv. Polym. Technol., 37, 1 (2018).
- R. Anbarasan, M. Jeyapriya, and B. Meenarathi, Polym. Adv. Technol., 29, 2025 (2018).
- A. Talebi, S. Labbaf, and F. Karimzadeh, Polym. Compos., 25395,1 (2019).
- P. Abinayasri, B. Meenarathi, and R. Anbarasan, Bull Mater., Sci. 40, 591 ( (2017) ., )
- R.M. Sladdery, A.E. Stahl, K.R. Bereton, A.L. Rheingold, J.M. Fritsch, J. Polym. Sci. Part A Polym. Chem. 57, 48 (2019)
- B. Raghavendra, K. Bakthavachalam, B. Ramakrishna, and N.D. Reddy, Organomet., 36, 4005 (2017).
- M. Mandal, A.M. Luke, W.B. Tolman, and C.J. Cramer, ACS Catal., 9, 885 (2019).
- D. Zhu, L. Guo, W. Zhang, X. Hu, Q. Zhang, and W.H. Sun, Dalton Trans., 48, 4157 (2019).
- A. Bowyahya, S. Balieu, G. Gounier, and M. Lanchin, New J. Chem., 43, 5872 (2019).
- A. Galia, O. Scialdhene, T. Spano, S. Tilloy, C. Roysseau, RSC Adv. 6, 90290 (2016)
- I.D. Rosal, R. Poteau, L. Maron, Dalton Trans. 40, 11228 (2011)
- H. Alamri, J. Zhao, D. Polhounik, N. Hadhjichristidis, N. Polym. Chem. 5, 5471 (2011)
- J. Xu, J. Song, S. Pispas, and G. Zhang, Polym. Chem., 5, 4726 (2014).
- R. Karmel, M. Khononov, M. Tamm, M.; and M.S. Eisen, Catal. Sci. Technol. 5, 5110 (2015)
- A. Scrivanti, M. Bortoluzzi, and M. Gatto Chem. Pap. 70, 53–60 (2016)
- L. Fan, L. Zhang, and Z. Shen, Polym. J., 36, 91 (2004).
- A. Kayan, Catal. Surv. Asia 24, 87 (2020)
- D.F. Liu, L.Q. Zhu, J. Wu, X.Q. Lu, RSC Adv. 5, 3854 (2015)
- Z. Yang, R. Duan, Z. Sun, H. Zhang, L. Li, Asian J. Org. Chem. 8, 376 (2019)
- R. Bijja, D. Chakraborty, Polym. Bull. 71, 2185 (2014)
- B. Autenrieth, H.S. Jeorge, and B. Axtell, Macromolecules., 48, 2480 (2015).
- W. Yang, K.Q. Zhao, C. Redshaw, J. Elsegood, J. Dalton Trans., 44, 13133 (2015)
- J. Bai, X. Xiao, Y. Zhang, J. Chao, and X. Chen, Dalton Trans., 46, 9846 (2017).
- T. Fuoco, and D. Pallalardo, Catalyst., 7, 64 (2017).
- Y. Mahha, A. Atlasani, J.C. Blais, and L. Salles, J. Mol. Catal. A Chem., 234, 63 (2005).
- W. Alkareshni, A.P. Armitage, and K. Singh, Orgaonomet., 32, 249 (2013).
- C. Redshaw, C. Catalyst., 7, 165 (2017).
- C. Thomas, and J.A. Gladysz, ACS Catal., 4, 1134 (2014).
- A.L.C. Oleiveira, L.C. Ferreira, and M.A.C. Nascimento, Quim. Nova., 42, 505 (2019).
- S.O.K. Giese, C. Egervardt, and G.G. Nunes, J. Braz. Chem. Soc., 26, 2258 (2015).
- L. Jiang, L. Lou, W. Sun, L. Xu, and Z. Shen, J. Appl. Polym. Sci., 98, 1558 (2005).
- B. Bahramian, V. Mirkhani, M. Moghadam, and A.H. Amin, Appl. Catal. A Gen., 315, 52 (2006).
- H. Sehimi, and M.F. Zid, J. Chem. Sci., 130, 25 (2018)
- H.H. Chen, R. Anbarasan, P.H. Chen, Mater. Lett. 66, 299 (2012)
- W.S. Choi, M.F. Chisholm, D. Singh, J. Nature Commun. 3, 689 (2012)
- W. Fan, Y. Leng, J. Liu, P. Jiang, and P. Zhao, J. Appl. Catal. A Gen., 506, 173 (2015).
- R. Anbarasan, V. Kohila, B. Meenarathi, G. Jeyalakshmi, and A. Jancirani, SN Appl. Sci., 1, 602 (2019).
- Scheme1.png
Preparation of Metal-mercaptoacetate end-capped PCL