The optical sensing and supramolecular cyanide recognition sites of two dipodal Schiff bases having conjugated to catecols (1) and phenols (2) (namely, salophenes 1 and 2) have been studied. In the case of optical sensing, both probes recognized only cyanide (CN¯) ions in 30% PBS buffer CH3CN (pH 7.4) as confirmed from the changes of absorption and emission bands, resulting in color changes. From the supramolecular recognition point of view, probes 1 and 2 show the different recognition bahaviour toward CN¯, as evidenced by the fluoroscence and NMR data, as well the OH¯ and reversibility experiments. While 1 recognizes CN¯ via deprotonation, that of 2 is the first example of Schiff base which senses CN¯ through an intramolecular aldimine condensation cyclization, leading to formation of dihydroxyquinoxaline 4. In general, probes 1, 2 and 4 are promising on-site optical sensors in terms of easy prepared, selectivity, sensitivity (1–10 nM), ease of use, rapid response (< 5 s) and test kits.
Research Article
Optical Sensing and Supramolecular Cyanide Recognition Sites of Salophenes as Molecular Tweezers: The First Example of Recognition via Intramolecular Aldimine Condensation Cyclization
https://doi.org/10.21203/rs.3.rs-310351/v1
This work is licensed under a CC BY 4.0 License
You are reading this latest preprint version
Supramolecular chemistry is a relatively young area of interdisciplinary field of science in which the design of receptors is an main principle for making nonbonding supramolecular interactions with substrates. The binding ability of a host − guest complex is related to mutual size, shape, rigidity and binding sites in order to produce high levels of affinity and selectivity.1–2
The inevitable widespread use of cyanide ion (CN¯) in various modern industries, such as the polymer industry and gold extraction process, has polluted water resources.3–5 Given that CN¯ has the capability to suppress the transportation process of oxygen in human body, the development of new optical chemosensors for this hypertoxic ion is a paramount challenge. Therefore, the concentration control of CN¯ in various sources of water, under the WHO allowable level, is an important duty.6
Although there are numerous efficient optical chemosensors to recognize CN¯ in various samples, the design of an accurate, cost-effective, easily synthesized and fast-response sensor for on-site CN¯ detection is still urgently needed.7–9
Schiff bases, shown as S1-S13 in Table 1, are promising optical chemosensors in sensing of CN¯. As clear in their structure, the imine groups are located at the ortho position of the hydroxyl groups with a possible intramolecular hydrogen bonds (O-H…N = C).10 According to the intrinsic nature of CN¯, both imine and hydroxyl groups of these Schiff bases are potential site for CN¯ recognition. Accordingly, imine groups in the structure of S1-S8 have been activated through the resonance-assisted hydrogen bonds for nucleophilic addition of CN¯.11–17 In contrast, CN¯ sensing of S9-S13 is taken place via the deprotonation of hydroxyl groups in which imines are inert to sensing.18–22
Salophenes are known Schiff base ligands for the coordination with various metal ions.32–36 Although, the structural designs of dipodal salophenes 1–3 seem to be suitable for CN¯ recognition, there is no report on this class of molecules for CN¯ sensing (Scheme 1).
The closest examples to 1–2 are the dipodal probes S7-S9, which show different responses to CN¯. While S7 and S8 undergo deprotonation followed by nucleophilic attack of CN¯ to imine bond via Strecker’s reaction mechanism, CN¯ sensing of that of S9 was taken place via deprotonation followed by disaggregation (Table S1).17
Table 1 Detection of CN¯ by Schiff base probes S1-S13 (N.A.= Nucleophilic addition; D.P.= Deprotonation or hydrogen bonding.)

For a long time, we have been interested to the design and synthesis of various supramolecular based chemosensors.23–33 In this regards, we have designed and synthesized some optical receptors for the CN¯ sensing based on the different recognition mechanism, such as deprotonation,30,31 metal-replacement32 and aggregation induced emission.33
Keeping above-mentioned information in mind, we herein report that CN¯ sensing mechanism of molecular tweezers 1 and 2 is different to each other and as well with those of S7-S9. Although sensor 1 detects CN¯ via deprotonation process, the CN¯ recognition of probe 2 is through the intramolecular aldimine condensation cyclization (IACC) pathway. This is the first example of a Schiff base which sense CN¯ via IACC process. Furthermore, sensors 1 and 2 showed excellent sensitivity, specificity, and rapid response toward CN¯.
The compounds 1 and 2 were simply synthesized by the condensation reaction of 1,2-diaminobenzene with 2,3-dihydroxy benzaldehyde,34,35 or 2-hydroxy benzaldehyde36 respectively (Schemes S1 and S2). The known compound 4 has been also prepared from the reaction of NaCN with 2 for 48–64 h stirring at room temperature under inert atmosphere.37–39 The synthesis routes are drawn in Schemes S1-S3. All products were characterized by NMR measurements which are identical to those of the reported data (Figs. S1-S3).
2.1. Optical response of 1
To investigate the response of 1 to CN¯ ion, a solution of NaCN was gradually added to CH3CN : H2O buffered solution (7:3, pH 7.4) of 1 and after each addition the absorption and emission spectra were recorded.
The UV–Vis spectra of 1 exhibited two absorption peaks at 290 and 321 nm. Upon incremental increases of CN¯ (0–1.5 equiv.) to a solution of 1, the absorbance peaks were gradually decreased with concomitant increase of the newly appeared peak at 410 nm (Fig. 1A). In addition, a clear isosbestic point at 355 nm was formed, indicating a distinct interaction between 1 and CN¯.
On the other hand, the excitation of compound 1 at 430 nm was led to fluorescence emission at 442 nm. Upon the addition of CN¯ (0–1.5 equiv.) to 1, the intensity of original peaks gradually increased with a virtually unchanged emission shift (Fig. 1B).
These optical CN¯ sensing were also confirmed by the obvious color changes of solutions, as shown in insets of Fig. 1.
The optical response of 1 toward CN¯ fits well with the Stern-Volmer equation to confirm their strong interaction (Figs. 2A and 2B). The binding constants (Ka) were calculated using the Benesi-Hildebrand equation and found 2.8 x 10³ and 1.0 x 10⁵ M− 1 by UV-vis and Fluorescence methods, respectively.
The binding mode of 1 with CN¯ was measured and gave a 1:1 stoichiometry by Job plot analysis (Figs. 2C and 2D). According to calculations, a high sensitivity for fluorescence (LOD = 1.2 nM) and UV–vis (LOD = 2.3 nM) methods were obtained which are much lower than the maximum allowable level of CN¯ ions in drinking water (1.9 µM) set by the WHO.6
To evaluate the interference of CN¯ with the following sodium anions (NO2−, NO3−, SCN¯, HS¯, S2−, Br¯, Cl¯, F¯, I¯, H2PO4¯, IO3−, IO4−, ClO4−, BrO3¯, ClO3−, MoO42−, SO32−, S2O32−, S2O42−, S2O52−, SO42−) and chloride cations (Li+, Na+, Ca2+, Ba2+, Sr2+, K+, Mg2+, Al3+, Cu2+, Cd2+, Co2+, Fe3+, Ni2+, Hg2+, Ag+, Mn2+, Pb2+, Zr4+), competitive experiments by 1 were investigated which showed no interference between CN¯ and other anions (Figs. 3A and 3B).
Upon addition of different sodium anions to solutions of 1, it was distinct that other anions, except CN¯, induced no visual and emission color changes (Figs. 3C and 3D). The high selectivity of CN¯ over chloride metal ions confirmed that the deprotonation process is superior to metal complexation (Fig. S4).
2.2 Optical response of 2
The binding ability of 2 toward CN¯ ions were also studied by UV–vis and fluorescence spectroscopy (Fig. 4).
When 20 equiv. of CN¯ was gradually added to 2, a new peak at 417 nm was observed with an isobestic point formation and a pale yellow color appearance (Fig. 4A).
Upon addition of CN¯ ions (0.2 µM) to a solution of 2 (0.015 µM), the fluorescence peak at 466 nm was surprisingly blue-shifted to 446 nm (Fig. 4B). This non-linear emission response 2 to CN¯, as shown in above inset of Fig. 4B, suggested the different behavior of 2 with that of 1.
The binding mode of 2 with CN¯ was measured and gave a 1:1 stoichiometry by Job plot analysis (Fig. S5). The calculated detection limit by fluorescence (2 µM) is remarkably lower than that of UV–vis (10 nM). Emission intensity ratio (I466/I446) method was found to improve the ratiometric detection of CN¯ (0.9 µM, Fig. S6). This unexpected detection limit is due to formation a new emissive product (see Sect. 3.3.3 and Fig. 10).
In a further experiment, the competitive experiments showed that there is no interference between CN¯ and other ions in a solution of 2, as shown in Figs. 5A and 5B. Moreover, the significant color change of 2 in the presence of CN¯ is observable under 365 nm UV light, as shown in Figs. 5C and 5D.
Furthermore, probe 2 shows a highly selectivity of CN¯ over metal ions due to the unique reaction of CN¯ on 2 (Fig. S7).
2.3 Practical Application
2.3.1 pH response
First, the ability of both receptors for sensing of CN¯ was evaluated in the various ranges of the buffer solutions.
As shown in Fig. 6 and Fig. S8, a pH range of 5.0–9.0 is allowed for CN¯ analysis. Accordingly, we set all measurements at buffer pH = 7.4 which is applicable for biological samples.
2.3.2 Reversibility experiment
To determine the reversibility of solution of 1 toward CN¯, 1 equiv. of HCl was added, leading to disappearance of its yellow color to colorless solution (Fig. 7A). This color change in the presence of HCl is also confirmed by the disappearance of the absorbance peak at 417 nm, suggesting the reversible deprotonation-protonation cycle in even after several cycles.
In contrast, probe 2 shows the irreversible behavior under the same experiment to suggest a nucleophilic reaction was taken place on it.
The reversibility of probe 1 was also studied on silica gel plates. As shown in Fig. 7B, a colorless test strip was prepared by immersing TLC plate into MeOH solution of 1 (10− 4 M). When this colorless paper was immersed into solution of CN¯ (10− 4 M), a yellow color appeared on it. This yellow color subsequently returned back to original color of 1 when plate immersed into solution of HCl (10− 4 M). These results showed that sensor 1 can work well in both solution and solid state as portable kits for CN¯ analysis.
2.3.3 Solution and solid kit tests
Furthermore, the performance of 1 and 2 for qualitative detection of CN¯ was evaluated. As shown in Fig. 8, the gradual color change from colorless to yellow with the addition of various concentrations of CN¯ was detectable by both probes.
The visual color changes are accompanied with gradual increasing of absorption peaks of 1 in 30% aqueous CH3CN at 417 nm. However, it was hard to trace visual color change of 2 in 30% aqueous CH3CN. In contrast, an improvement in color changes was observed for 2 when the measurements were carried out in 30% aqueous MeOH at 375 nm (Fig. 8B and 8D). However, its calculated detection limit is weak (2.0 µM).
2.4 Proof of the sensing mechanism
2.4.1 1H NMR measurements
To get insight into the binding interactions between both sensors with CN¯, 1H NMR measurements were performed in the presence of NaCN, as shown in Fig. 9.
When 1 equiv. of CN¯ was added to the solutions of 1 or 2 in DMSO-d6, the corresponding signals of the OH protons entirely disappeared together with upfield shift for aromatic protons, indicating the formation of strong hydrogen bonds between CN¯ and OH groups followed by deprotonation.
In contrast, the imine protons of 1 and 2 showed the different response in the presence of CN¯. The imine protons of 1 were slightly shielded from 8.7 to 8.5 ppm, while those of 2 at 8.9 ppm disappeared and a broad peak at 4.5 ppm, assigned to the amine protons, appeared as attributed to the nucleophilic addition of CN¯ (Fig. 9B).
2.4.2 NaOH experiment
To support this finding, the interaction between 1 or 2 with OH¯ as a strong base were investigated by fluorescence spectroscopy. As shown in Fig. 10A, the addition of OH¯ (1 equiv.) and CN¯ (2 equiv.) to 1 gave the identical emission spectrum, confirming the deprotonation process is taken place. In contrast, the fluorescence response of 2 towards OH¯ and CN¯ was different (Fig. 10B), supporting the results of NMR and the irreversibility of 2 by HCl.
2.4.3 The evidence for formation of 4 and its response to CN¯
Based on the above results, we figured out the formation of a new product 4 during the titration of 2 with CN¯.
Therefore, a mixture of 2 (1 equiv.) and CN¯ (1 equiv.) in MeOH was stirred at room temperature for 1h which gave quantitative yield of dihydroxyquinoxaline 4. The formation of 4 was well supported by 1H NMR and mass spectroscopy and was identical to those of reported data (Figs. S3 and S10).35,36 As shown in Fig. 10C and 10D, 1H NMR and fluorescence spectrum of 4 and 2 in the presence of CN¯ is identical (Scheme 2B), approving the CN¯ sensing of 2 is occurred via 4.
This significant fluorescence response of 4 to CN¯ made us interested in using it as a new CN¯ sensor. Probe 4 shows two emission peaks at 470 and 520 nm.
Upon addition of CN¯ (0–1.0 equiv.) to a solution of 4, the fluorescence peak at 520 nm was gradually reduced (Fig. 11). At the same time, the peak at 470 nm was gradually increased. This unique feature can be attributed to gradual breaking of intramolecular hydrogen bonds of 4 followed by the deprotonation process. This response is fast and show highly sensitivity to CN¯ (LOD = 6.5 nM) with significant color change from yellow to blue under 365 nm UV light (below inset of Fig. 11) with a binding constant of 5 × 10³ M− 1 between 4 and CN¯.
2.4.4 The proposed sensing mechanism
First, to prove the critical role of hydroxyl groups of 1 and 2 on the sensing of CN¯, compound 3, having methoxy groups, was posed to CN¯ with no absorbance response (Fig. S11).
In the second step, we considered why CN¯ recognition by 1 and 2 is taken place in different pathways.
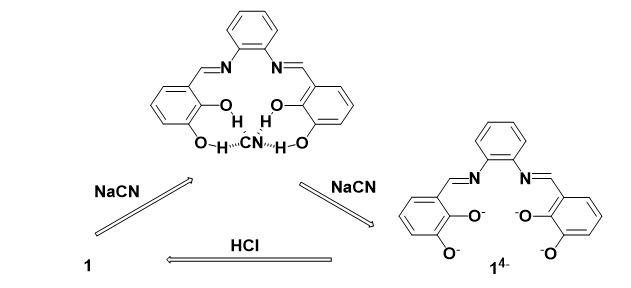
As clear from the experimental data, 1 can recognize CN¯ via its tetradentate site between two catechol groups, as shown in Scheme 2, which keeps CN¯ far from imine groups, prohibiting its nucleophilic attack on imines.
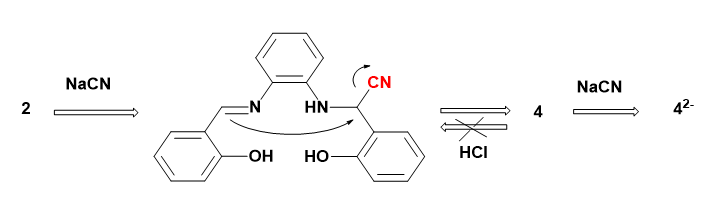
In contrast to 1, the experimental results show that CN¯ recognition by 2 is taken place via intramolecular aldimine condensation cyclization (IACC), as depicted in Scheme 3, leading to formation of 4. The proposed mechanism for 2, however, involves cyanide attack at an aldimine and tautomerization to form a carbanion which attacks a second aldimine and the subsequent tautomerization is followed by elimination of cyanide and formation of 4 (Scheme 3). This intramolecular aldimine condensation cyclization (IACC) process is taken place due to shorter distance between two arms of salophene 2 as compared with those of S7-9.
The optical responses of salophenes 1–3 toward CN¯ ions have been investigated. The design of Schiff bases 1 and 2 are so that their hydroxyl groups can assist in the coordination of CN¯ ions. However, the different recognition mechanism by 1 and 2 was taken place CN¯ as evidenced by fluorescence, OH¯ test, reversibility experiment and NMR measurements. As a result, probe 1 senses CN¯ via deprotonation process, whiles 2 recognizes CN¯ via intramolecular aldimine condensation cyclization, leading to formation of dihydroxyquinoxaline 4. This different response of 1 and 2 is related to their different binding sites. Moreover, the critical role of hydroxyl groups was confirmed when 3 was inert to CN¯. In general, probes 1, 2 and 4 are promising CN¯ indicators in terms of its ease-of-use, selectivity, very low detection limit (1–10 nM), visual and emission color change and rapid response. Moreover, the application of 1 and 2 was successful via the solid and solution test kits.
As shown in Table 1, the Schiff base sensors S1-S13 have certain limitations such as delayed response, lack of reversibility, high detection limit, interference of other ions and use of increased reaction time and temperature. The comparison of detection limits (DL) of 1, 2 and 4 with all existed sensors shows almost significant superiority of the present sensors.
4.1 Materials and instrumentation
All chemical reagents and solvents were of analytical grade and commercially available. The fluorescence spectra were carried out on a Jasco FP-6500 spectrofluorimeter. The absorbance spectra were recorded on an Agilent 8453 UV-Vis spectrophotometer. Mass spectra were obtained on a Fisons instrument. 1H NMR was measured by Varian 400 MHz. Infrared spectra were recorded on a Perkin Elmer 883 spectrometer.
4.2 Synthesis of 4
A mixture of compound 2 (1 mmol) and NaCN (8 mmol) in MeOH was stirred at room temperature for 60 minutes. After removing of MeOH, the solid was extracted with chloroform. The organic layer was dried over sodium sulfate. The yellow product 4 was purified by column chromatography and gave 80% yield.
Dihydroxyquinoxaline 4: IR (KBr, cm-1): 3400 (O-H), 2921 (C-H), 1610 (C = N), 1470 (C = C), 1226 (C-N); 1H NMR (DMSO-d6): δ 14.92 (s, 1H), 10.17 (s, 1H), 7.44 (d, 1H), 7.36–7.17 (m, 2H), 7.06 (t, 1H), 6.94 (m, 4H), 6.79 (t, 1H), 6.63 (m, 3H), 6.23 (s, 1H).; MS (EI), m/z (rel. intensity %) 317 (M+, 100%), 299 (10%), 223 (75%), 196 (60%).
4.3 Fluorescence and UV-vis titration measurements of probes with NaCN
Caution
CN¯ solutions are also very toxic! All the experiments are strongly recommended to do with respiratory protection under good fume hood. Keep any remaining CN¯ solution in alkaline solution of ferrous sulfate (pH > 9).
Receptors 1 or 2 or 4 were dissolved in 100 mL of CH3CN : H2O buffered system (7:3, pH 7.4) to make the final concentration of 0.3 µM.
0–100 µL of the NaCN solution (0.5 µM) was transferred to the receptor 1 solution prepared above.
0–300 µL of the NaCN solution (24 µM) was transferred to the receptor 2 solution prepared above.
0–70 µL of the NaCN solution (0.2 µM) was transferred to the receptor 4 solution prepared above.
After mixing the above solutions for a few seconds, Fluorescence and UV-vis spectra of 1 or 2 or 4 were measured at room temperature.
4.4 Determination of the detection limit
To determine the signal-to-noise ratio (S/N), the absorbance and emission intensities of 1 or 2 or 4 in the presence of NaCN were measured 5 times and the standard deviation of the blank measurements was determined. The measurement of the absorbance was performed in the presence of NaCN ions, and the mean intensity was plotted as a concentration of NaCN to determine the slope. The detection limit (DL) was calculated using the following equation:
DL = 3σ/m
where σ is the standard deviation of the intensity of 1, 2 and 4 in the presence of NaCN and m is the slope between the intensity (A0/A) or (I0/I) and concentration (Ct).
4.5 1H NMR of probes 1, 2 and 4 in the presence of CN¯
Each of compounds 1, 2 and 4 was added to the NMR tube and then dissolved in DMSO-d6. Then, 1 equiv. of dissolved NaCN in DMSO-d6 was added to each solution of receptors. After shaking them for a minute, 1H NMR spectra were measured at room temperature.
Electronic Supplementary Information (ESI) available: Spectroscopy data and titration spectral data associated with this article can be found in the online version.
Authors’ Contributions All authors contributed to the study conception and design. Sepideh Alizadeh: contributed to the synthesis and initial analysis in this study; Ramo Nazarian: contributed significantly to analysis and manuscript preparation; Leila Ebadinia: performed the data analyses; Kiomars Aghapoor: helped perform the analysis with constructive discussions.
Funding The authors have no relevant financial or non-financial interests to disclose.
Data Availability The data and materials used or analysed during the current study are available from the corresponding author on reasonable request.
Compliance with Ethical Standards
Competing Interests The authors have declared that no competing interests exist.
- Davis, S. Higson, Macrocycles: Construction, Chemistry and Nanotechnology Applications; Wiley: Chennai, India, 2011.
- Brnjas-Kraljevi, G. Pifat-Mrzljak, Supramolecular Structure and Function 10; Springer: Dordrecht, 2011.
- W. Kulig, Cyanide Toxicity, U.S. Department of Health and Human Services, Atlanta, GA, 1991.
- Young, L. Tidwell and C. Anderson, Cyanide: Social, Industrial and Economic Aspects; Minerals, Metals and Materials Society: Warrendale, 2001.
- A. Acheampong, R. J. W. Meulepas and P. N. L. Lens, J Chem Technol Biotechnol, 2010, 5, 590-613.
- Guidelines for Drinking Water Quality. WHO Guidelines Values for Chemicals that are of Health Significance in Drinking Water, 3rd.; WHO press: Geneva, 2008.
- Xu, X. Chen, H. N. Kim and J. Yoon, Chem. Soc. Rev., 2010, 39, 127-137.
- Wang, L. Wang, X. Chen and J. Yoon, Chem. Soc. Rev., 2014, 43, 4312-4324.
- Saleem and K. H. Lee, RSC Adv., 2015, 5, 72150–72287.
- L. Berhanu, Gaurav, I. Mohiuddin, A. K. Malik, J. S. Aulakh, V. Kumar, K. H. Kim, Trends in Analytical Chemistry, 2019, 116. 74-91.
- Zhang, B. B. Shi, T. B. Wei, Y. M. Zhang, Q. Lin, H. Yao and X. M. You, Dyes and Pigments, 2013, 99, 857-862.
- Li, J. h. Zhang, Y. Cai, W. j. Qu, G. y. Gao, Q. Lin, H. Yao, Y. M. Zhang and T. B. Wei, Tetrahedron, 2015, 71, 857-862.
- J. Lee, S. Y. Lee, K. H. Bok and C. Kim, J Fluoresc, 2015 25, 1449-1459.
- J. Lee, S. J. Park, H. J. Sin, Y. J. Na and C. Kim, New J. Chem., 2015, 39, 3900-3907.
- L. Leng, J. H. Zhang, Q. Li, Y. M. Zhang, Q. Lin, H. Yao and T. B. Wei, New J. Chem., 2016, 40, 8607-8613.
- Udhayakumari, S. Velmathi and M. S. Boobalan, Journal of Fluorine Chemistry, 2015, 175, 180-184.
- Sharma, M. S. Hundal and G. Hundal, Org. Biomol. Chem., 2013, 11, 654-661.
- Bhalla, S. Pramanik and M. Kumar, Chem. Commun., 2013, 49, 895-897.
- Rezaeian, H. Khanmohammadi and S. Gholizadeh Dogaheh, New J. Chem., 2018, 42, 2158-2166.
- Y. Ryu, J. J. Lee, J. A. Kim, D. Y. Park and C. Kim, RSC Adv., 2016, 6, 16586-16597.
- Y. Jo, S. A. Lee, Y. J. Na, G. J and Park, C. Kim, Inorganic Chemistry Communications, 2015, 54, 73-76.
- Mohammadi and J. Jabbari Can, J. Chem, 2016, 94, 631-636.
- R. Darabi, M. Kargar, R. Hajipoor, N. Abouali, K. Aghapoor, K. Jadidi, B. Notash and H. Sayahi, Tet. Lett., 2016, 57, 256-259.
- R. Darabi, M. Mirzakhani, K. Aghapoor, L. Faraji, N. Sakhaee and K. Jadidi, J. Organomet. Chem., 2013, 740, 131-134.
- R. Darabi, A. Darestani Farahani, M. H. Karouei, K. Aghapoor, R. Firouzi, R. Herges, A. R. Mohebbi and C. Naether, Supramol. Chem., 2012, 24, 653-657.
- R. Darabi, M. Azimzadeh, A. Motamedi, R. Firouzi, R. Herges, A. R. Mohebbi, S. Nasseri and C. Naether, Supramol. Chem., 2009, 21, 632-837.
- R. Darabi, L. Sobhani, S. Rastgar, K. Aghapoor, S. K. Amini, R. Zadmard, K. Jadidi and B. Notash, Supramol. Chem., 2019, 31, 45-51.
- R. Darabi, E. Khatamifar, K. Aghapoor, H. Sayahi and R. Firouzi, Appl. Organometal. Chem., 2017, 31, e3812.
- R. Darabi, M. Mirzakhani and K. Aghapoor, J. Organometal. Chem., 2015, 786, 10-13.
- Kargar, H. R. Darabi, A. Sharifi and A. Mostashari, Analyst. ,2020, 145, 2319.
- Assadollahnejad, M. Kargar, H. R. Darabi, N. Abouali, S. Jamshidi, A. Sharifi, K. Aghapoor and H. Sayahi, New J. Chem., 2019, 43, 13001.
- Ebadinia, H. R. Darabi and A. Ramadan, Phosphurous, sulfur. Silicon., 2020, 195, 620.
- Nazarian, H. R. Darabi, K. Aghapoor, R. Firouzi and H. Sayahi, Chem. Commun., 2020, 56, 8992.
- Olea-Román, N. Bélanger-Desmarais, M. Flores-Álamo, C. Bazán, F. Thouin, C. Reber and S. E. Castillo-Blum, Dalton Trans., 2015, 44, 17175-17188.
- Joshu, H. Benítez, P. Jiménez-Cruz, K. E. Cureño-Hernández, A. Solano-Peralta, M. Flores-Álamo, A. Flores-Parra, I Gracia-Mora and S. E. Castillo-Blum, Inorganica Chimica Acta., 2018, 480, 197-206.
- V. Mota, G. S. G. de Carvalho, P. P. Corbi, F. R. G. Bergamini, A. L. B. Formiga, R. Diniz, M. C. R. Freitas, A. D. da Silva and A. Cuin, Spectrochimica Acta Part A: Molecular and Biomolecular Spectroscopy, 2012, 99, 110–115.
- J. E. Reich, A. K. Justice, B. T. Beckstead, J. H. Reibenspies and S. A. Miller, J. Org. Chem., 2004, 69, 1357-1359.
- J. E. Reich, E. E. Greenwald, A. K. Justice, B. T. Beckstead, J. H. Reibenspies, S. W. North and S. A. Miller, J. Org. Chem., 2005, 70, 8409-8416.
- Gorginpour, H. Zali-Boeini, H. Amiri Rudbari, RSC Adv., 2021, 11, 3655–3665.
- 2021JOFLsupportingdata.doc
- Tableofcontent.doc
- Scheme1.png
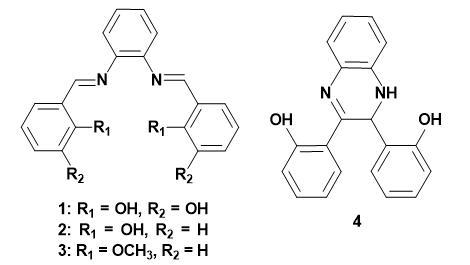
Scheme 1. Structures of compounds 1-4.
- Scheme2.png
Scheme 2. Proposed recognition mechanism for sensor 1.
- Scheme3.png
Scheme 3. Proposed recognition mechanism for sensor 2.