3.1 Synthesis and characterization of poly(lactide)-based thermoplastic polyurethane
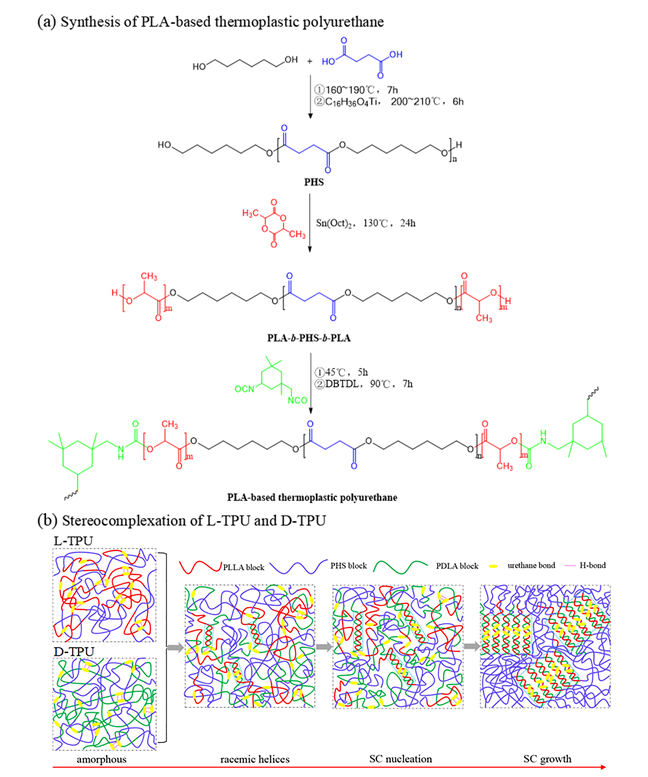
The synthetic route of PLA-based thermoplastic polyurethane is shown in Scheme 1. First, 1,6-hexanediol and 1,4-succinic acid undergo an esterification reaction to generate esters at lower temperature, which are further polycondensed into dihydroxy-terminated poly(hexylene succinate) (PHS). Afterwards, PLA-b-PHS-b-PLA triblock copolymers were synthesized via dihydroxy-terminated PHS-initiated ring-opening polymerization of lactide. Eventually, PLA-based thermoplastic polyurethane based on PLA-b-PHS-b-PLA triblock copolymers were prepared through the reaction of PLA-b-PHS-b-PLA triblock copolymers with isophorone diisocyanate. Figure 1(a) shows FT-IR spectra of PHS, PLA-b-PHS-b-PLA triblock copolymer and PLA-based thermoplastic polyurethane. For PHS, a weak peak at 3440 cm-1 ascribed to the stretching vibration of -OH groups is observed. The peaks at 2937 cm-1 and 2866 cm-1 are attributed to the -CH2 symmetric and asymmetric stretching vibrations. The stretching vibration peaks assigned to C=O, C-O-C and C-O appear at 1723 cm-1, 1158 cm-1 and 1075 cm-1, respectively These results indicate that dihydroxy-terminated PHS was successfully synthesized. In the FT-IR spectrum of PLA-b-PHS-b-PLA triblock copolymer, the stretching vibration peak attributed to the -OH groups is significantly weakened, and the peak ascribed to the asymmetric stretching vibration of -CH3 groups is observed at 2990 cm-1.41 This indicates that dihydroxy-terminated PHS successfully initiates the ring-opening polymerization of lactide to synthesize PLA-b-PHS-b-PLA triblock copolymer. It is clear that FT-IR spectrum of PLA-based thermoplastic polyurethane is similar to that of PLA-b-PHS-b-PLA triblock copolymer. But the broad peak appears at 3390 cm-1 may be attributed to the N-H stretching vibration and the peak at 1530 cm-1 corresponds to the C-N stretching vibration in urethane linkages.42 This indicates that PLA-based thermoplastic polyurethane based on the corresponding triblock copolymers was successfully synthesized.
1H NMR spectra of PHS, PLA-b-PHS-b-PLA triblock copolymer and PLA-based thermoplastic polyurethane are displayed in Figure 1(b). The 1H NMR spectrum of PHS shows several obvious proton peaks at 1.33 ppm, 1.58 ppm, 2.61 ppm, 3.58 ppm and 4.08 ppm. The peaks at 1.33 ppm, 1.58 ppm and 4.08 ppm are attributed to the methylene protons of hexanediol unit, respectively. The peak at 2.61 ppm is the methylene proton of succinate unit.43 The peak at 3.58 ppm is assigned to the methylene proton attached to the terminal hydroxyl group. GPC curve of PHS was also measured (Figure S1), and its number-average molecular weight and polydispersity index are 1.63 kg/mol and 1.22, respectively (Table 1). Compared with PHS, the 1H NMR spectrum of PLA-b-PHS-b-PLA triblock copolymer has obvious proton peaks at 1.59 ppm and 5.16 ppm, assigned to the methyl and methine groups of PLA block, respectively.44 And the proton peak at 3.58 ppm disappears completely, and a weaker peak is observed at 4.30 ppm, ascribed to the methine proton at the end of the PLA block.45 These results reconfirm that dihydroxy-terminated PHS initiated the ring-opening polymerization of lactide to synthesize triblock copolymers. The feed ratio of lactide/HS was regulated to prepare PLA-b-PHS-b-PLA triblock copolymers with different compositions. As listed in Table 1, the content of PLA blocks in the triblock copolymers calculated by the 1H NMR spectra increase as the feed ratio of lactide/HS increases. GPC curves of PLA-b-PHS-b-PLA triblock copolymers were also tested (Figure S1), and it was found that the retention time is significantly smaller than that of PHS. This shows that the molecular weight of PLA-b-PHS-b-PLA triblock copolymer is significantly larger than that of PHS. The number-averaged molecular weights of PLA-b-PHS-b-PLA triblock copolymers obtained from GPC curves increase as the feed ratio of lactide/HS increases (Table 1). These results indicate that PLA-b-PHS-b-PLA triblock copolymers with controllable compositions were successfully synthesized.
For the 1H NMR spectrum of PLA-based thermoplastic polyurethane (Figure 1(b)), the peaks at 0.88~1.04 ppm and 3.66 ppm are attributed to the methyl and methylene protons in isophorone diisocyanate, respectively.46,47 The peak at 4.30 ppm disappear completely, while the weak peak at 7.01 ppm may be attributed to the N-H of the urethane bond.48 These results demonstrate that PLA-based polyurethane polyurethane based on PLA-b-PHS-b-PLA triblock copolymers was synthesized, which is consistent with the results of FT-IR spectra. In Table 1, it is clear that number-averaged molecular weight of PLA-based thermoplastic polyurethane is significantly larger than the corresponding PLA-b-PHS-b-PLA triblock copolymer, and they exhibit larger PDI (1.65~1.80), assigned to the chain extension of the urethane bond. The physical states of solution-coated films of PHS, PLA-b-PHS-b-PLA triblock copolymer, and PLA-based thermoplastic polyurethane were also analyzed (Figure S2). PHS is a soft, viscous substance, while PLA-b-PHS-b-PLA triblock copolymer is a brittle substance, which may be due to the introduction of rigid PLA blocks. They exhibit poor film-forming properties, assigned to their lower molecular weights. However, PLA-based thermoplastic polyurethane can form a transparent film, which can undergo significant bending, twisting and stretching deformation, showing obvious elastomeric characteristics.
3.2 Crystal structure and crystallization behavior of poly(lactide)-based thermoplastic polyurethane
Figure 2(a) shows XRD patterns of PHS, PLLA-b-PHS-b-PLLA and the corresponding L-TPU. For PHS, there are two prominent diffraction peaks at 21.5° and 24.8°, which are attributed to the (220) and (040) planes of the PHS crystals.43,49 It can be observed that the XRD patterns of PLLA-b-PHS-b-PLLA triblock copolymers don’t show the diffraction peak of PHS crystals, which may be due to the reduction of the PHS content or the inhibition of the crystallization of PHS by the PLA block. However, new diffraction peaks appear at 14.8°, 16.7° and 19.0°, assigned to the (010), (200)/(110) and (203) planes of α crystals formed by PLLA homo-crystallization.50 And as the molecular weight of the PLLA block increases, the diffraction peaks of PLLA homo-crystallization increase. It is clear that there is no diffraction peak in the XRD pattern of the sample L-TPU20%. For L-TPU with higher PLLA content, there is only a weak diffraction peak ~16.7°, assigned to the homo-crystallization of PLLA blocks. This indicates that L-TPU based on PLLA-b-PHS-b-PLLA triblock copolymer exhibits poor crystallization ability and is close to amorphous state, which may be due to its unique chemical structure. For PLLA-b-PHS-b-PLLA with a typical ABA triblock copolymer structure, the introduction of flexible PHS block improves the ability of PLA to move and organize, which promotes the crystallization of PLA. However, the formation of urethane bonds results in a structure of alternating PLA/PHS blocks in the polymer, which affects the ability of the polymer chain to align regularly. At the same time, the increased molecular weight is also another reason for the deterioration of the crystallization ability of TPU. DSC reheating curves of PHS, PLLA-b-PHB-b-PLLA and the corresponding L-TPU are shown in Figure 2(c). For PHS, its glass transition temperature and melting temperature are -52.2 ℃ and 46.5 ℃, respectively. The melting peak of PHS cannot detected in the DSC reheating curves of PLLA-b-PHS-b-PLLA triblock copolymers, while the melting peak corresponded to PLLA presents a higher temperature region (102.4~120.4 ℃) as the PLLA content increases. This suggests that the PLLA block may inhibit the crystallization of the PHS block. Another possible reason is the decreased HPS content in the PLLA-b-PHS-b-PLLA triblock copolymer. It is clear that the TPU based on PLLA-b-PHS-b-PLLA triblock copolymer has no melting peaks of PHS and PLLA. This reveals that L-TPU is in an amorphous state, attributed to its poor crystallization ability, which is consistent with XRD result. Compared with PLLA-b-PHS-b-PLLA triblock copolymer, the corresponding L-TPU has a higher glass transition temperature (as Table 1). This is because the extension of polymer chain leads to an increase in its molecular weight. With increasing of the PLLA content, the glass transition temperature of the PLLA-b-PHS-b-PLLA triblock copolymer and the corresponding TPU shift to a higher temperature region, assigned to the stiffness of the PLLA block.
XRD patterns of SC-TPU with mixing ratios are shown in Figure 2(b). The SC-TPU10/0 without D-TPU has a weak diffraction peak of poly(lactide) homo-crystals at 16.6°. With the introduction of D-TPU in the L-TPU matrix, SC-TPU exhibit obvious diffraction peaks at 12.0°, 20.8° and 24.0°, which are attributed to the (110), (300)/(030) and (220) planes of the β crystals formed by the stereocomplex-crystallization between PLLA and PDLA. With the increase of D-TPU content, the diffraction peaks of β crystals are enhanced. When the content of D-TPU is 50%, the diffraction peak reaches the strongest, assigned to the fully stereocomplexation of equal amounts of PLLA and PDLA.51,52 And no diffraction peaks of α crystals corresponded to homo-crystallization of poly(lactide) are observed. These results reveal that when the content of D-TPU is 10%~50%, PLA-based thermoplastic polyurethanes containing only stereocomplex crystals can be prepared. This may be because the strong hydrogen bonding between PLLA and PDLA is conducive to the occurrence of stereocomplex crystallization. Previous literature52,53 have reported that only stereocomplex crystals are formed without homo-crystallization when PLLA and PDLA are in equal amounts. In this study, the mixing ratio of L- and D-forms was significantly expanded, extending the preparation of fully stereocomplex. Figure 2(d) shows DSC reheating curves of SC-TPU with L-TPU/D-TPU mixing ratios. A melting peak at higher temperature region (~170 ℃) is observed for the PLA stereocomplex crystals, revealing that the stereocomplexation occurs between the PLLA block of L-TPU and the PDLA block of D-TPU. With increasing of the D-TPU content, the peak area of the melting peak increases, due to increased stereocomplex crystallinity. For SC-TPU5/5, its crystallinity can reach 51.7%. These results indicate that the stereocomplexation promotes the crystallinity of PLA-based thermoplastic polyurethane. Another phenomenon is observed that the glass transition temperature of SC-TPU decreases with increase of crystallinity (as Table 2). As shown in Scheme 1(b), when the amorphous L-TPU and D-TPU are mixed, the hydrogen bonding formed between urethane bonds may promote the formation of racemic helices in PLLA and PDLA chains. The racemic helix is further generated into crystal nuclei, which acts as the nucleation site to accelerate the stereocomplex-crystallization of PLLA and PDLA.
3.3 Thermal stability of poly(lactide)-based thermoplastic polyurethane
The thermal stability was considered as one of the most important performance of polyurethane materials, so the effects of the composition and stereocomplexation on the PLA-based were evaluated (as Figure 3 and Figure S3). The obtained thermal decomposition parameters are summarized in Table 3. It is clear that the thermal decomposition of all TPU occurs in two steps, assigned to the PLA degradation first and then to the PHS degradation. The possible reason is that the C-C bond is more stable than the ester group. Similar phenomena54,55 have been reported the polyurethane based on PLLA and PCL. For L-TPU with various PLLA content, the T5% shift to lower value, revealing a decreasing thermal stability of L-TPU. This is due to the increased content of PLA, which is less thermally stable. For SC-TPU, the T5%, Tmax,1 and Tmax,2 values are lower than that of L-TPU66%. SC-TPU (≥40% of D-TPU) exhibits higher T5%, Tmax,1 and Tmax,2 values than SC-TPU (≤30%), indicating that the high stereocomplexation degree can improve the thermal stability of PLA-based TPU.
3.4 Mechanical properties of poly(lactide)-based thermoplastic polyurethane
It is known that composition and crystallization can affect the mechanical properties of polymer-based materials. Here we investigated the effect of the PLA content, and stereocomplex-crystallization on the tensile properties of PLA-based thermoplastic polyurethane, as displayed in Figure 4. PLA is a typical stiff and brittle polymer with a relatively low the elongation percentage at break.56 However, the stress-strain curves of PLA-based thermoplastic polyurethanes based on PLA-b-PHS-b-PLA triblock copolymers show good toughness, and a linear response is observed in the low strain range (as Figure 4(a) and 4(c)). This is mainly due to the introduction of a flexible PHS block and IPDI chain extension to increase its molecular weight. As shown in Figure 4(b), with the increase of content of PLA block, the tensile strength increases, but the elongation at break first increases and then decreases. L-TPU72% with the maximum PLA content is found to have the ultimate tensile strength of 11.9 MPa, and an elongation at break of 211%, while L-TPU27% with minimum PLA content has a strength of 4.8 MPa and an elongation of 37%. Although the content of the soft segment PHS is higher in the latter case, its elongation at break is inferior, which is dependent on it molecular weight. Furthermore, it is found that the L-TPU66% exhibits a maximum elongation at break (376%) and the tensile strength of 11.6 MPa. These indicate that the mechanical properties of L-TPU can be effectively regulated by the content of the hard PLA and soft segments in the backbone.
The effect of stereocomplex-crystallization on the mechanical properties of PLA-based thermoplastic polyurethane is shown in Figure 4(d). Compared with L-TPU, all SC-TPU exhibit a larger tensile strength and a smaller elongation at break. Furthermore, with increasing of the content of D-TPU increases form 10% to 50%, the tensile strength first increases and then decreases, but the elongation at break decreases. SC-TPU with 20% of D-TPU is found to have the maximum tensile strength (42.4 MPa) and an elongation at break of 247%. At higher D-TPU content (≥30%), the elongation at break of the material is only 40~77%. Due to the structural complementarity between PLLA and its enantiomer PDLA, the strong hydrogen bond can be formed, which drives the alternate arrangement of PLLA and PDLA to form the stereocomplex crystals. With increasing of the D-TPU content, a large number of stereocomplex crystals are formed, resulting in an increase in the crystallinity of SC-TPU materials. When the crystallinity of the material is low, increased crystallinity can enhance the strength of the material, but further increases in crystallinity can cause the material to become brittle. At the same time, the increased crystallinity leads to a decrease in the elongation at break of the material. Therefore, a lower content of stereocomplex crystals can improve the mechanical properties of PLA-based thermoplastic polyurethanes, but a higher amount of stereocomplex crystals leads to a significant decrease in the elongation at break of the material.
3.5 Shape memory behavior of (lactide)-based thermoplastic polyurethane
The shape memory properties of PLA-based polyurethanes were evaluated. As shown in Figure 6, the sample film wound into a spiral and folded into a cube can quickly return to its original shape at 70 ℃, showing shape memory characteristics. At a lower temperature (<Tg of PLA), the PLA block is in the glass state, so that the frozen PLA chain limits the elastic retraction of the PHS soft segment. However, at higher temperatures, the PLA chain starts to move, so that the sample can quickly return to its original shape. To quantitatively evaluate the shape memory properties of the materials, their shape fixation ratio and shape recovery ratio were measured (as listed in Table S1). The sample L-TPU27% with low PLA content was in the molten state at 70 ℃, so its shape memory properties cannot be quantitatively evaluated. The sample L-TPU66% exhibits a shape fixity ratio of 45.0% and a high shape recovery ratio (100%). With increasing of the PLA content, the shape fixation ratio of L-TPU72% increases to 73.3%, while its shape recovery ratio decreases to 93.9%. For the sample with higher PLA contents, the more polymer chains could be frozen at low temperature (<Tg of PLA), which limits the rebound of the material. So the material exhibits a good shape fixity ratio. The higher PLA content may be lead to the increases of amorphous PLA region. The amorphous PLA segments at higher temperature (>Tg of PLA) tend to move because of their high elasticity. This results in irreversible deformation, so the shape recovery ratio of the material decreases.57 Shape memory behavior of SC-TPU was evaluated, as listed in Table S1. The samples with higher D-TPU contents (≥30%) exhibit an small elongation at break, so their shape memory properties cannot be quantitatively evaluated. It is evident that compared to the neat L-TPU66%, the shape fixation ratios of the samples with lower D-TPU content (<30%) increase significantly, but their shape recovery ratios decreases. For SC-TPU8/2, its shape fixation ratio and recovery ratio are 65.0% and 86.7%, respectively. The stereocomplex crystals formed in SC-TPU acts as cross-linking point, which facilitates the fixation of the shape of the material. But the formation of stereocomplex crystals increases the rigidity of SC-TPU so that the material cannot fully recover the original shape.59
3.6 Hydration and biodegradation of poly(lactide)-based thermoplastic polyurethane
The surface contact angle can represent the instantaneous hydrophilicity of the material surface when it contacts with water, and water absorption can reflect the hydrophilicity of the material surface and internal structure over a period of time. Therefore, the hydration capacity of the synthesized polyurethane film was analyzed by water contact angle and water absorption. It is clear in Figure 6(a) that the water contact angle and water absorption of L-TPU27% are 79.2 ° and 14.3%, respectively, showing good hydrophilicity. With the increase of PLLA content, the water contact angle of the polyurethane film increases, and its water absorption. This is because PLLA contains hydrophobic groups such as methyl and ester groups, so the increased PLLA blocks lead to enhanced hydrophobicity of polyurethane films, resulting in poor hydrophilicity. For L-TPU72%, the water contact angle reaches 87.9 °, and the water adsorption is only 9.2%. Further, the effect of stereocomplex-crystallization on the hydration ability of the synthesized polyurethane film was discussed, as shown in Figure 6(b). Compared with neat L-TPU66%, SC-TPU has larger water contact angle and lower water adsorption, exhibiting poor hydrophilicity. As the content of D-TPU increases from 10% to 50%, the water contact angle of SC-TPU increases from 90.0 ° to 103.3 °, and the water adsorption decreases from 11.2% to 2.7%.
The degradation behavior of the synthesized polyurethane film is shown in Figure 6(c) and (d). The degradation of polymer is mainly due to the breaking of chemical bonds caused by water molecules entering the polymer to produce soluble substances, resulting in mass loss. Therefore, the hydrophilicity of polyurethane film is an important factor affecting its degradation. In Figure 6(c) and (d), with the increase of degradation time, the mass loss of the sample increases significantly. The mass loss of the polyurethane film L-TPU27% in the fifth week can reach 60.7% (Figure 6(c)). With the increase of the PLLA content, the mass loss decreases significantly, which is mainly due to the decrease of hydrophilicity and water absorption of the material. Compared with the neat L-TPU66%, the mass loss of SC-TPU is reduced, and the mass loss decreases significantly with the increase of D-TPU62% content. For the sample containing 50% of D-TPU62%, the mass loss in the fifth week is only 1.7%. This is mainly attributed to the stereocomplex-crystallization caused by the strong hydrogen bonding between PLLA and PDLA.
3.7 In vitro blood compatibility and cytotoxicity evaluation of poly(lactide)-based thermoplastic polyurethane
Blood compatibility of the materials, which can be evaluated by hemolysis test, is an index to evaluate the biocompatibility of materials. When the hemolysis rate of the material is less than 5%, it means that the material meets the requirements of blood compatibility of biomedical materials. As can be seen from the illustration in Figure 7(a) and (b), the positive control is bright red, and the boundary between the supernatant and red blood cells of the negative control is obvious. The color of the supernatant of L-TPU and SC-TPU is similar to that of the negative control, indicating that their hemolysis rate is similar. Furthermore, it is found that the hemolysis rate of all samples was less than 0.1% (Figure 7(a) and (b)). These results show that all poly(lactide)-based polyurethanes have no hemolytic activity and good blood compatibility, meeting the requirements of biomedical materials.
The in vitro cytotoxicity of the synthesized poly(lactide)-based thermoplastic polyurethane was evaluated by the MTT method. As shown in Figure 7(c), the cell viability decreases with the extraction concentration . But the cell viability of all samples L-TPU are more than 75% with up to 1000 μg/mL extraction concentrations, which could be classified into the class 1 standard. During 5 days incubation, the cell viability is still higher than 75.2% in all L-TPU, indicating that they exhibit good biocompatibility. The cell viability of SC-TPU was also measured, as displayed in Figure S4. It is clear that all SC-TPU show high cell viability after 5 days of incubation. Further, the morphology and growth of the cells are observed, as shown in Figure 7(e). It can be seen that the morphology of L929 cells cultured in the extraction are same as those of the control group, indicating that the cells are in a healthy state of growth. The results observed by a fluorescence microscope after stained with Calcein-AM/PI solution found the the majority of L929 cells in every group exhibit a green and spindle-like morphology. A small number of the cell with red morphology are also observed, which may be due to cell metabolism. These results reveal that the synthesized PLA-based TPU possess good biocompatibility.