2.1. Materials
Chemicals, including calcium chloride (CaCl2), magnesium chloride (MgCl2), sodium phosphate dibasic (Na2HPO4), and poly(vinyl alcohol) (PVA), were purchased from Sigma-Aldrich (St. Louis, MO, USA). HAG (Ca10(PO4)6(OH)2, Bongros™) with a typical diameter of 1 ~ 2 mm was obtained from CGBIO Inc. (Korea).
2.2. Scalable synthesis of WH NPs
WHNPs in this study were synthesized with a wet precipitation method. In brief, the aqueous solutions of 0.1 M CaCl2 and 0.1 M MgCl2 were mixed well with a specific ratio under 500 rpm stirring. Next, 21 mL of 0.1 M Na2HPO4 was added to the above mixture. The ratio of Mg2+, Ca2+, and PO43− was equal to 2:8:7. Subsequently, the reaction mixture temperature was increased to 70 ℃ and kept for 24 h. The obtained NPs were separated with centrifugation, washed with deionized water, and dried into powder at 60 ℃ for the following WHHAGs fabrication process.
2.3. Preparation of WHHAGs
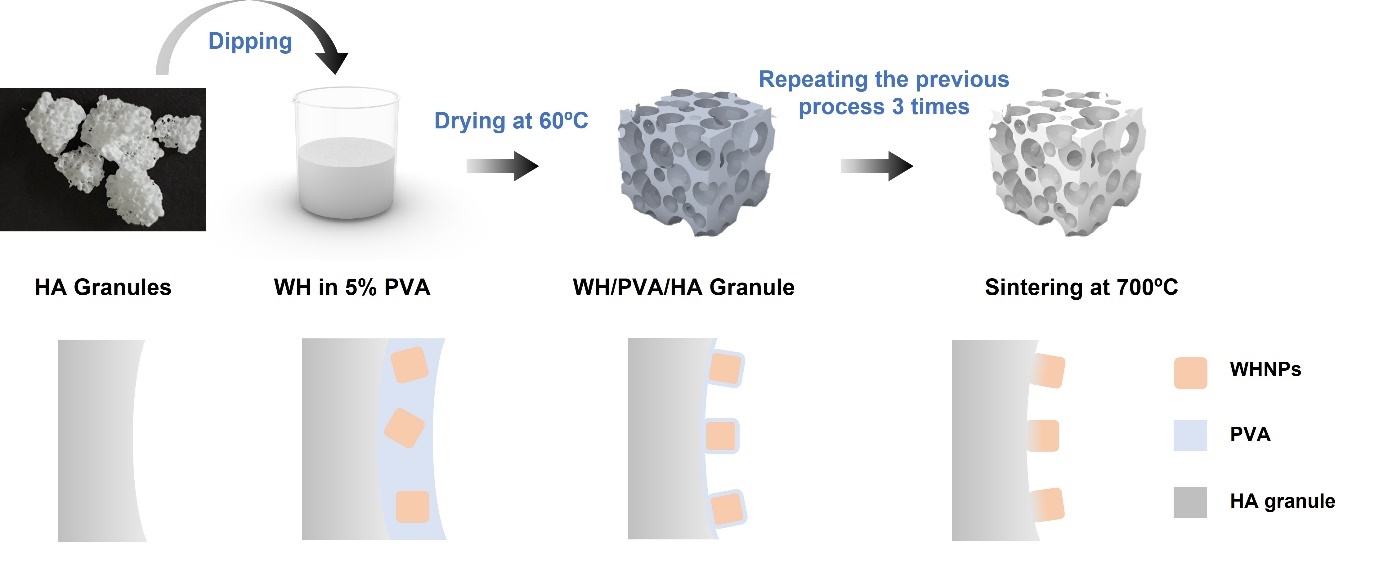
The fabrication process of WHHAGs is shown in Scheme 1. Briefly, WH NPs were dispersed well in 5% PVA solution (FDA approved and biologically compatible) to be 20 mg/mL using the sonic treatment for 30 min. Then, HAGs with the size of 1–2 mm were immersed in the prepared WH solution and dried under 60°C for 3 h. Finally, the WH-coated HAGs were sintered at 700°C for 2h in a tube furnace to remove the polymer completely and enhance the bonding of the WH layer to HAGs to be WHHAGs.
2.4. Characterization of the synthesized WH NPs and WHHAGs
The morphology and structure of WH NPs were characterized using transmission electron microscopy (TEM; H-7600, Hitachi, Japan) and high-resolution TEM (HRTEM; FEI, Talos F200X; Thermo Scientific). An X-ray powder diffractometer (Empyrean series-2; PANalytical, Netherlands) of CNU Chemistry Core Facility using Cu Kα radiation was used to characterize the crystal phase. Fourier transform infrared spectroscopy (FTIR) was performed using PerkinElmer Spectrum Two (Perkin-Elmer, UK). Morphologies and structures of WHHAGs were characterized using field emission scanning electron microscopy (FE-SEM; Hitachi S-4800, Japan).
2.5. Cell cultures
MG63 cells isolated from the bone of patients with osteosarcoma, were obtained from the American Type Culture Collection (ATCC, Mannassas, VA, USA). They were cultured in Dulbecco Modified Eagle’s Medium (DMEM, Welgene, Gyeongsan, Korea) supplemented with 10% fetal bovine serum (FBS, Welgene), 2 mM L-glutamine, 100 u/mL penicillin, and 100 µg/mL streptomycin (Thermo Scientific Inc., Waltham, MA, USA). These cells were incubated in a humidified incubator at 37°C in an air atmosphere containing 5% CO2.
2.6. Cell proliferation and cell cycle assay
MG63 cells were seeded in 96 well plates (2×10⁴ cells/well) and cultured for 24 h. Then, the WHHAGs were treated in new media at each concentration (NT, WHHAG0.1, WHHAG1, WHHAG10, WHHAG24, WHHAG50, which represent non-treated, 0.1, 1, 10, 25, and 50 µg/ml, respectively. After the incubation for 24, 48, and 72 h, cell viability reagent (CCK-8: Dojindo, Kumamoto, Japan) was added to each well to make a total of 10%, and a microplate reader (Sunrise Remote Control) was utilized to check cell proliferation after 4 h, and a microplate reader (Tecan, Austria) was used to measure the absorbance at 450 nm.
The cell cycle of MG63 cells was evaluated using a Muse™Cell Cycle Kit (MCH100106, Millipore Co., Billerica, MA, USA) according to the manufacturer’s instructions. Briefly, MG63 cells were cultured in 100 mm2 dishes (3 × 10⁵ cells/dish), then treated with three different concentrations of WHHAGs (10, 25, and 50 µg/mL) for 72 h. Total cells from subset groups were harvested by centrifugation at 3,000× g for 5 min and fixed with 70% EtOH at 20°C for 3 h. The fixed cells were washed with 1× PBS and resuspended in 200 µL of cell cycle reagent. Following incubation at 37°C in a CO2 incubator for 30 min, cell cycles were analyzed using fluorescence-activated cell sorting (FACS, Millipore Co.).
2.7. Alkaline phosphatase (ALP) staining
ALP is one essential enzyme for bone formation and the early indicator of osteogenic differentiation[38]. The osteogenic differentiation capacity of WHHAGs was evaluated by ALP staining. Briefly, MG63 cells were seeded in a 24 well plate at 3 × 10⁴ cells/well, cultured for 24 h, and then differentiated by treatment with a differentiation medium (50 µg/ml ascorbic acid, 0.1 µM dexamethasone and 10 mM β-glycerophosphate) to induce differentiation. The WHHAGs were treated with the differentiation medium at a concentration of 50 ug/ml. The culture medium was replaced every 3 days. After 7 and 14 days, differentiation-induced cells were treated according to the manual using the ALP staining kit (Cell Biolabs, Inc., San Diego, USA). ALP activities were confirmed through the degree of cell staining observed directly using optical microscopy.
2.8. Western blot analysis
The expression levels of the lipid metabolism-related proteins were quantified with the Western blot assay as described elsewhere[39, 40]. The total proteins were extracted from MG63 cells using Pro-Prep Protein Extraction Solution (iNtRON Biotechnology, Seongnam, Korea) and quantified with SMARTTM BCA Protein Assay Kit (Thermo Scientific Inc.). An appropriate amount of protein (30 µg) was collected from total cell lysate, loaded equally, and separated by 4–20% sodium dodecyl sulfate–polyacrylamide gel electrophoresis (SDS‐PAGE) for 2 h, after which the resolved proteins were transferred to nitrocellulose membranes at 40 V for 2 h. Each membrane was incubated overnight at 4°C with the primary antibodies, diluted in 1:1,000 (Table S1). The probed membranes were washed with a washing buffer (137 mM NaCl, 2.7 mM KCl, 10 mM Na2HPO4, and 0.05% Tween 20) and incubated with 1:2,000 diluted horseradish peroxidase (HRP)‐conjugated goat anti‐rabbit IgG (Invitrogen) at room temperature for 1 h. The membrane blots were developed using an Amersham ECL Select Western Blotting detection reagent (GE Healthcare, Little Chalfont, UK). The chemiluminescence signals originating from the specific bands were detected using FluorChemi®FC2 (Alpha Innotech Co., San Leandro, CA, USA).
2.9. Quantitative reverse transcription-polymerase chain reaction (RT-qPCR) analysis
The transcription levels of osteocalcin (OCN), ALP, runt‑related transcription factor 2 (RUNX2), bone morphogenetic protein-2 (BMP2), type I collagen (Col-I), and Vascular endothelial growth factor (VEGF) genes were quantified by RT-qPCR. Briefly, the total RNA of the subset groups was extracted with RNAzol (Tel‐Test Inc., Friendswood, TX, USA) from MG63 cells according to the manufacturer’s guidelines. The total RNA molecules were quantified using a Nano-300 Micro-Spectrophotometer (Allsheng Instruments Co. Ltd., Hangzhou, China), and the complementary DNA was synthesized using a mixture of the total RNA (5 µg), oligo‐dT primer (Invitrogen, Carlsbad, CA, USA), dNTP, and reverse transcriptase (Superscript II, Invitrogen) on a T100TM thermal cycler (Bio-Rad, Hercules, CA, US). Using the synthesized cDNA template, qPCR was conducted from 2× Power SYBR Green (Toyobo Co., Osaka, Japan) with the following cycles: 15 sec at 95°C, 30 sec at 55°C, and 60 sec at 70°C. The cDNA for OCN, ALP, RUNX2, BMP2, Col-I, and VEGF genes are amplified using the specific primer sequences (Table S2). In the exponential phase of PCR amplification, the reaction cycle in which the PCR product exceeds this fluorescence intensity threshold is considered the threshold cycle (Ct). The expression of the target gene was quantified relative to that of the housekeeping gene β‐actin, based on a comparison of the Ct values at a constant fluorescence intensity according to Livak and Schmittgen’s method[41].
2.10. Animals and Surgical Procedure
A total of 28 male Wistar rats were purchased from SMATCO corporation (Osan, Korea) and used for this study. The rats used in this experiment were between 7 weeks of age and weighed 250–300 g, and were provided with free access to food and water through cages. All experimental procedures were performed according to the ethical guidelines of Pusan National University Institutional Animal Care and Use Committee (PNUIACUC, South Korea), which comply with the regulation of the International Association for Study of Pain (IASP) in animals. (PNU-2020-2616). The rats were divided into four groups: Group 1 is the negative control group (four rats, non-treated (NT) group), Group 2 is the reference control or bovine hydroxyapatite (Bio-Oss®, Geistlich Pharma AG, Wolhusen, Switzerland) group (eight rats, Bio-Oss group), Group 3 is the WH coated HAG group (eight rats, WHHAGs group) and Group 4 is the WHHAGs with rhBMP-2 (Cowell BMP, Cowell medi inc., Busan, Korea) group (eight rats, WHHAGs + BMP group).
The rats were anesthetized with an intraperitoneal injection of a ketamine/xylazine cocktail at the concentration of 100 mg/kg ketamine (Yuhan, Seoul, Korea) and 10 mg/kg xylazine (Rompun, BAYER KOREA Ltd., Seoul, Korea). To prevent infection, the surgical site was shaved with an electric shaver and disinfected with betadine (povidone-iodine) using sterile tools and gloves. Then, 0.3 mL of lidocaine solution (1:100,000 epinephrine) was injected subcutaneously into calvarial soft tissue as a local anesthetic agent (Lidocaine HCl 2% injection, Huons, Seongnam, Korea). From the local anesthesia stage, the limbs of the rats were spread and fixed to the disinfected surgical plate with a prone position using adhesive tape. A full-thickness flap was elevated, and 7 mm bone defects in diameter were created by bone trephine bur (Osstem Inc., Seoul, Korea). Then, 7 mm diameter bone fragments were removed carefully to avoid tearing dura. The calvaria defects in the Bio-Oss group, the WHHAGs group, and WHHAGs + BMP group were filled with Bio-Oss granules, WHHAGs, and WHHAGs with rhBMP-2, respectively (Fig. 1). Also, the calvaria defects in the NT group remained untreated for 8 weeks. The flap was repositioned and sutured with a synthetic absorbable sterile suture (Coated VICRYL (polyglactin 910), 4 − 0 size) using a simple interrupted suture method.
2.11. Micro-CT Analysis
3D skull images of respective rat groups were obtained using a micro-CT system (Quantum FX micro CT, PerkinElmer, Waltham, USA) to evaluate the regeneration of newly formed bone in the defect site at the moment of 4 and 8 weeks after surgery. The CT scans were obtained at 90 kVp, 108 µA with a field-of-view (FOV) of 20 mm and voxel size of 39 µm. After scanning, a 3D image analysis was conducted using software (Analyze 12.0, AnalyzeDirect Inc., Overland Park, USA) where the region of interest (ROI) was defined as a cylindrical area covering calvarial defect (7.03mm (d.) × 2.92mm (h.)). Finally, bone volume/tissue volume (BV/TV, %) and bone mineral density (BMD, mg/cm3) were calculated within the selected ROI.
2.12. Histomorphometry Analysis
Hematoxylin-Eosin (H&E) stain: Four mice from each group were sacrificed, and calvaria bones were isolated for 4 and 8 weeks after surgery. All tissue samples were calcified in 10% ethylenediaminetetraacetic acid (EDTA) (Sigma-Aldrich) for 4 weeks and then embedded in paraffin. Tissue sections (5 µm) were subjected to H&E staining. The post-calcification of calvaria bone tissue was tested by the preclinical center of the Daegu Gyeongbuk Advanced Medical Innovation Foundation (DGMIF).
Masson’s trichrome stain: Experiments were performed to observe cells and extracellular matrix related to collagen and bone type in the stained samples. The dyeing process is as follows: A 5 µm-thick paraffin tissue section prepared to observe mineralized and non-mineralized bone tissue according to the degree of collagen production was removed from xylene and immersed in a Bouin solution at room temperature overnight. The tissue samples were rinsed with distilled water several times until the yellow color of the tissue disappeared. After that, nuclear staining was performed in Weigert′s iron hematoxylin solution for 10 minutes, washed in running water for 10 minutes, and then stained in Biebrich Scarlet-acid fuchsin solution for 10 minutes. After rinsing several times with distilled water, it was treated in a phosphomolybdic-phosphotungstic acid solution for 10 minutes. After dyeing in Aniline blue solution for 5 minutes, the samples were rinsed several times with distilled water, applied 1% acetic acid solution for 1 to 3 minutes, and then rinsed several times with distilled water. Finally, it was sealed through dehydration and transparent processes. The post-calcification of calvaria bone tissue was tested by the preclinical center of DGMIF
2.13. Statistical Analysis
All of the measurements were statistically analyzed using a statistical program (SPSS 14.0, SPSS Inc., Chicago, USA). The differences in the BV/TV ratio and BMD were analyzed utilizing Student’s t-test with P < 0.05 being considered significant.