Ethics statement
All experiments were performed according to the European Communities Council Directive (86/609/EEC) norms and approved by the Animal Husbandry Department of Heilongjiang Animal Care and Use Committee. All fishes involved in this research were bred following the guidelines of the Animal Husbandry Department of Heilongjiang, P.R. China. All efforts were made to minimise the pain.
Gonadal sampling of rainbow trout
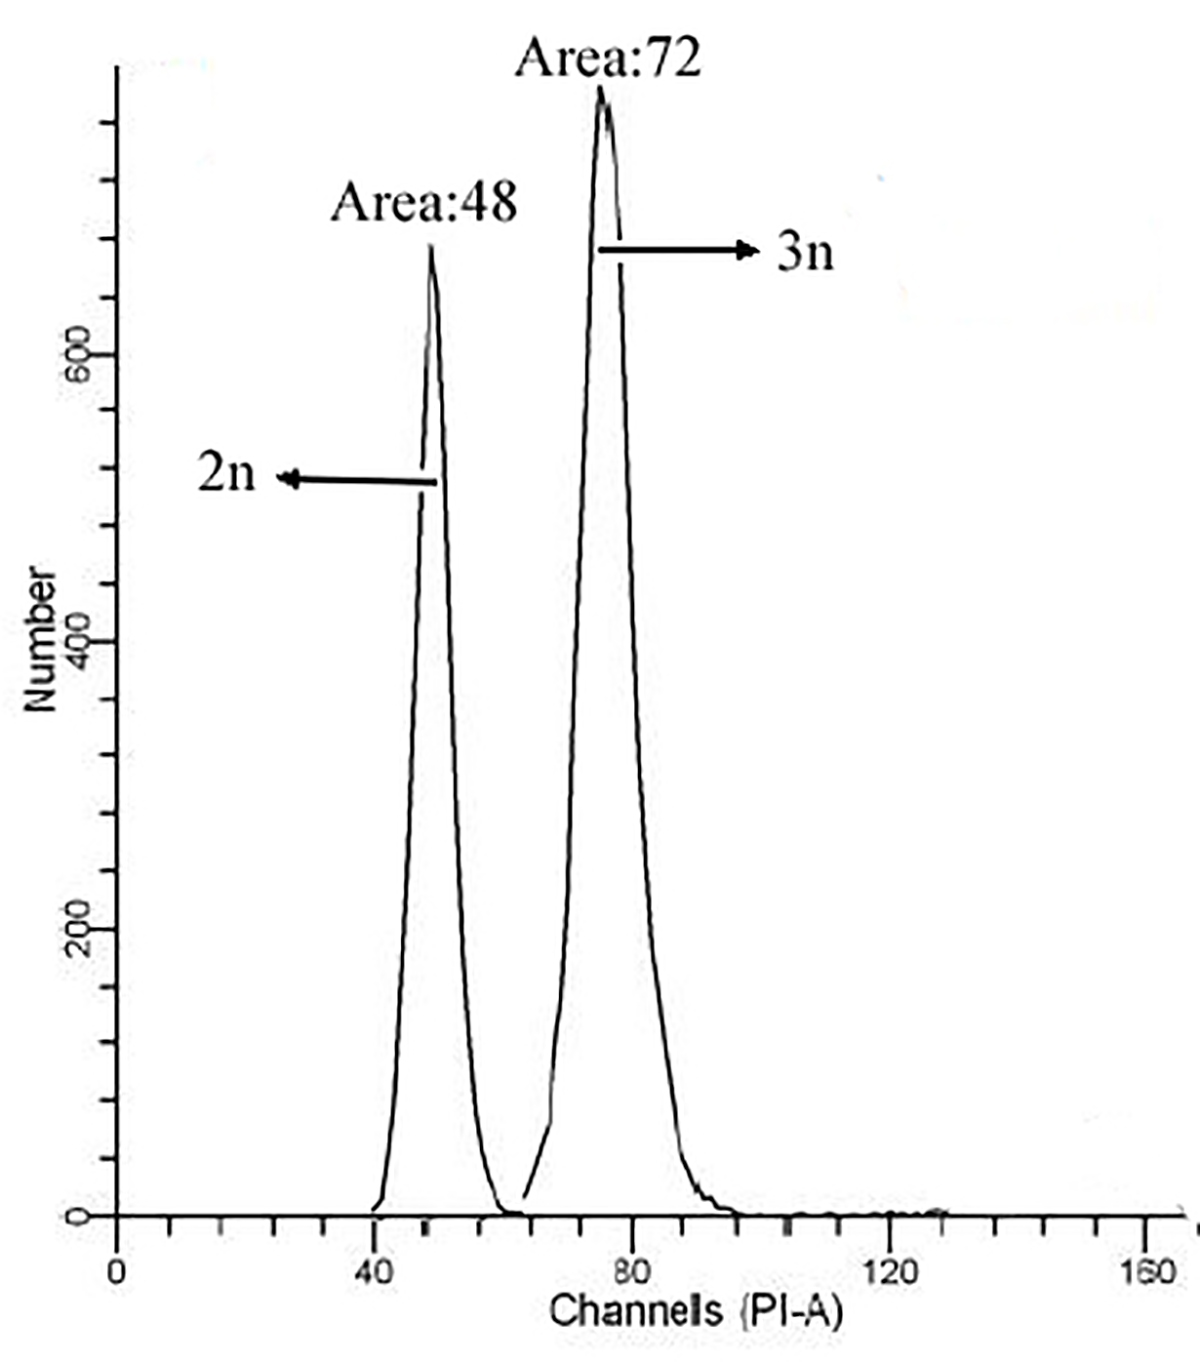
Triploid all-female (XXX) and diploid all-female (XX) rainbow trouts were obtained from Bohai experimental station of Heilongjiang River Fisheries Research Institute (Harbin, China). The triploid all-female eggs were obtained from the normal female eggs (XX) fertilised with pseudo-male semen (XX), and then the fertilised eggs were shocked by hydrostatic pressure. The ploidy of eggs was verified by Ploidy Analyser (Sysmex, Japan), the result of ploidy identification of gonad samples were as shown in Supplementary Fig. S1, and the triploid rate could reach up to 99%. The embryos were incubated at 12 °C from fertilisation until 24 days post-fertilisation (dpf) and transferred to a hatch pool at 12+0.2 °C. The fries were transferred to a cement pool when they were grown to achieve around 40 g weight. To minimize suffering of the fish, before tissue collection, fish were euthanized with an overdose of anaesthesia in MS-222 (Sigma, St. Louis, MO, USA) as reported previously (Chang et al., 2017). The gonadal part of the fry at 65 dpf was isolated under an anatomic microscope. Gonadal samples from 3 diploid female (XX) fishes and 3 triploid female (XXX) fishes were obtained, and the gonadal tissues of XX and XXX at 180 dpf and 600 dpf were sampled, respectively. The sample size of each ploidy at each time point was 3. All gonads were sampled and stored at – 80 °C for further experiments.
Sequencing and differential expression analysis of mRNAs and lncRNAs
The Trizol reagent (Invitrogen, CA, USA) was used to extract the total RNA, and only RIN of number >7.0, the RNA samples would be kept for the next experiments. The Epicentre Ribo-Zero Gold Kit (Illumina, San Diego, USA) was used to deplete ribosomal RNA of the total RNA. Under high temperature, RNA fractions were fragmented into small pieces. The mRNA-Seq sample preparation kit (Illumina, San Diego, USA) was used for RNA fragments to reverse-transcription to construct the final cDNA library. The average size for the paired-end libraries was 300 bp (+), and then the paired-end sequencing was performed on an Illumina Hiseq 4000 following the vendor’s recommended protocol. Firstly, transcripts that overlapped with the known mRNAs and transcripts shorter than 200 bp were discarded. Cutadapt was used to fastq quality control as following steps: (1) reads with Adaptor were removed; (2) reads containing N (N indicates that the base information cannot be determined) at a rate greater than 5% were removed; (3) low quality (the number of bases with quality value Q≤10 accounts for more than 20% of the whole read) reads were removed. The clean and filtered reads were aligned to the reference genome of Oncorhynchus mykiss (https://www.ncbi.nlm.nih.gov/genome/?term=Oncorhynchus%20mykiss, Omyk_1.0) using HISAT (v2.0.4) (min_intron_length=20,max_intron_length=500000). The valid reads and the percentage of mapped reads for each sample were shown as in Supplementary Table. S1. Thereafter, we utilised CPC (Kong et al., 2007) and CNCI (Sun et al., 2013) to predict transcripts having coding potentials. All transcripts with a CPC score of <−1 and CNCI score of <0 were removed. The remaining transcripts were considered as lncRNAs. StringTie (Frazee et al., 2015) was used to estimate the expression level of mRNAs and lncRNAs by calculating FPKM (Punta et al., 2012), the parameter of StringTie was set as stringtie_abundance=1. The differentially expressed mRNAs and lncRNAs were selected with log2 (fold change) >1 or log2 (fold change) <−1 and FDR< 0.05 as significant cutoff values using R package Ballgown (Agarwal et al., 2015), the parameter was set as remove_low_copy=0. The RNA-Seq raw data were deposited into the repository of SRA-NCBI, the BioProject number was PRJNA606210, and the BioSample IDs were SAMN14091286- SAMN14091303.
Sequencing and differential expression analysis of miRNAs
The TruSeq Small RNA Sample Prep Kits (Illumina, San Diego, USA) was used to construct the cDNA libraries. The cDNA product was purified by gel electrophoresis. After recovery, the purified library was concentrated by ethanol precipitation. The cDNA library was validated by DNA-1000 chip (Agilent Technologies 2100 Bioanalyzer, Agilent, CA, USA). The sequencing of cDNA libraries was performed using Illumina Hiseq 2500 through single-read strategy (1 × 50 bp). Raw reads were subjected to the ACGT101-miR tool (LC Sciences, Houston, Texas, USA) to remove adapter dimers, junk, low complexity, common RNA families (rRNA, tRNA, snRNA, snoRNA) and repeats (Ambady et al., 2012). Two aligners (Bowtie and Megablast) were used by ACGT101-miR, and their corresponding parameters were set as the following: Bowtie was used for reads to align against the mRNA sequence of Oncorhynchus mykiss (ftp://ftp.ncbi.nlm.nih.gov/genomes/all/GCF/002/163/495/GCF_002163495.1_Omyk_1.0/GCF_002163495.1_Omyk_1.0_cds_from_genomic.fna.gz), Rfam, Repbase and miRBase 22.0 database setting seed length = 16 and mismatch = 1. Megablast was used to align pre-miRNAs against the reference genome applying a 90% identity threshold. The unique sequences mapping to miRNAs' annotated loci on the genome of O. mykiss were identified as known miRNAs. The unique sequences mapping to the other arm of O. mykiss known pre-miRNAs, opposite to the annotated mature miRNA-containing arm, were considered to be novel 5p- or 3p- derived miRNA candidates. The remaining sequences were mapped to other selected species precursors (with the exclusion of the genome of O. mykiss) in miRBase 22.0, and the mapped pre-miRNAs were further aligned against the genome of O. mykiss to determine their genomic locations. The above two we defined as known miRNAs. The unmapped sequences were aligned against the genome of O. mykiss, and the hairpin RNA structure-containing sequences were predicted from the flank 80 nt sequences using RNAfold software (http://rna.tbi.univie.ac. at/cgi-bin/RNAfold.cgi). The criteria for secondary structure prediction were: (1) number of nucleotides in one bulge in stem (≤12) (2) number of base pairs in the stem region of the predicted hairpin (≥16) (3) cutoff of free energy (kCal/mol ≤-15) (4) length of hairpin (up and down stems + terminal loop ≥50) (5) length of hairpin loop (≤20). (6) number of nucleotides in one bulge in mature region (≤8) (7) number of biased errors in one bulge in mature region (≤4) (8) number of biased bulges in mature region (≤2) (9) number of errors in mature region (≤7) (10) number of base pairs in the mature region of the predicted hairpin (≥12) (11) percent of mature in stem (≥80). Finally, the effective sequences of miRNAs were further analyzed. The differential expression of the miRNAs based on normalised read counts were assessed through Student's t-test, setting a significance threshold of 0.05 in each performed test.
Construction of ceRNA network of miRNA-mRNA/lncRNA
The DE lncRNAs and 3′ UTR sequences of DE mRNAs were predicted as candidate miRNA targets using TargetScan (Agarwal et al., 2015) and miRanda (Betel et al., 2010). The threshold value of TargetScan for seed length scanned against the lncRNAs and 3’ UTRs of mRNAs database was context score percentile > 50, and the threshold free energy (kcal/mol) of miRanda was established as Max_Energy<-10. The miRNA-target selection was performed according to the intersection between the two tools. These lncRNAs are regarded as competing endogenous RNAs (ceRNA) to bind miRNA competitively and affect mRNA (miRNA target gene) expression indirectly. The output of the ad-hoc perl scripts of DE miRNA-mRNA and miRNA-lncRNA of different developmental period were as shown in Supplementary Table. S2 and Table. S3. The ceRNA regulatory cascades (miRNA-mRNA /lncRNA) were built by local perl scripts. The information including all of the above interaction was imported into Cytoscape (3.7.1) to construct a predicted miRNA-mRNA/lncRNA interaction network.
Functional analysis of DE mRNA
Gene Ontology (GO) enrichment analysis and Kyoto Encyclopaedia of Genes and Genomes (KEGG) pathway analyses were performed on the predicted target DE mRNAs of DE miRNA and DE lncRNAs in the ceRNA network, and DE mRNAs of different developmental period. For the non-model species, the specific steps of functional analysis were as follows: Firstly, the transcripts of the reference Oncorhynchus mykiss genome were used to align against the GO (go_20160702) and KEGG (release_78.1) database by Diamond with the parameter of E-value=1*E-5 (Buchfink et al., 2015). The comparison results of all transcripts for each gene which were integrated and removed duplicate were as the functional annotations of GO and KEGG. The local scripts were used for enrichment analysis. Then, the number of significantly DE genes (S gene number), the number of background genes (B gene number), the number of total significantly DE genes (TS gene number) and the number of total background genes (TB gene number) for each GO term/KEGG pathway were counted by GO and KEGG functional annotations. Pval was obtained by hypergeometric test. Both GO terms and KEGG pathways were considered to be significantly enriched with FDR < 0.05.
Validation of RNAs in the network by real-time PCR
Real-time PCR was performed for validation of the RNAs involved in the RNA-Seq. The same RNA samples were used for deep sequencing. A total of 10 lncRNAs, 12 mRNAs, and 11 miRNAs were detected from the real-time PCR expression. The qRT-PCR primers are shown in the Supplementary Table S4. For lncRNAs and mRNAs, the PrimeScript RT Reagent Kit (Takara, Dalian, China) was used for reverse transcription. Real-time PCR was performed using FastStart Universal SYBR® Green Master Mix (Roche, Switzerland) using CFX96 C1000 touch Thermal Cycler (BIO-RAD, America). Beta-actin was used as the reference gene. As for miRNAs, All-in-One™ miRNA qRT-PCR Detection Kit (GeneCopoeia, America) was used for RNA reverse transcription and real-time PCR. The miRNA expression was normalised by the expression of 18s rRNA. All experiments were strictly performed following the instructions. The Ct values were measured, and the value of target sequence normalised to reference sequence was calculated as 2-ΔΔCt. One-way ANOVA was used to assess the differences between the different groups. Statistical analysis was performed using SPSS 13.0 for Microsoft Windows. The significance was expressed as a P-value of <0.05.