Data from n=9 Landrace pigs were selected from an already published study cohort from our group, where dobutamine stress testing was performed (12, 16-18). The experimental protocols were approved by the local bioethics committee of Berlin, Germany (G0138/17) and conform to the "European Convention for the Protection of Vertebrate Animals used for Experimental and other Scientific Purposes" (Council of Europe No 123, Strasbourg 1985).
Experimental protocol and CMR acquisition
Briefly, female Landrace pigs were acutely instrumented, and the animals were transported to the MRI facility for measurements, where the pigs were ventilated with an MRI-compatible machine (Titus, Dräger Medical, Germany). After baseline measurements (BL), dobutamine (Dob) stress was performed. Dobutamine infusion was titrated, aiming at a 25% heart rate increase compared to baseline values. MR imaging was performed on a 3T clinical MR scanner (Ingenia, Philips Healthcare). 4D PC data were acquired with a 3D T1-weighted fast field echo (FFE) sequence with flow encoding gradients in three orthogonal axes (FH, RL, AP), in combination with retrospective gating to the electrocardiograph (ECG) cycle with 25 heart phases. Data were acquired in sagittal orientation, covering the entire heart and outflow tract. An anterior- and posterior phased array coil was employed for signal reception. Typical scan parameters were as follows: Acquired FOV FH/RL/AP = 180 × 87 × 288 mm³, acquired resolution = 2.8 × 2.8 × 2.8 mm³, reconstructed resolution = 1.5 × 1.5 × 2.8mm³, VENC along all three axes = 250 cm/s, TR/TE/flip = 3.8 ms/2.4 ms/5°, SENSE acceleration factor 2, bandwidth 2500 Hz / pixel. The scan time was on the order of 10 minutes. After the MRI measurements were concluded, the animals were transported back to the operating room for sacrifice.
CMR image analysis
The resulting magnitude image and three velocities encoded images were imported in the software MEVISFlow (Fraunhofer MEVIS, Bremen, Germany) (19). Pre-processing was applied, with noise-masking, antialiasing, automatic correction for eddy currents, and phase unwrapping as provided by MEVISFlow (20). It became apparent that the vector fields were not always imported correctly. A vector field correction was necessary to obtain the correct vector fields, which meant inverting the x and z axes for almost all scans. Moreover, not all imported scans started at the correct time in the cardiac cycle due to the triggering of the MRI acquisition being half a heartbeat later than the r-wave. This was manually corrected by rearranging the timepoints. Afterward, the pulmonary trunk (PT) and pulmonary arteries were located and segmented manually, which resulted in a mask. Regions of interest (ROI) were placed by manually encircling the vessel of interest at three locations (Figure 1): in the pulmonary trunk, before the vessel starts to dilate, at the left pulmonary artery (LPA) just after the first branch and in the right pulmonary artery (RPA) at the same height as in the LPA. These ROIs were propagated through time over one cardiac cycle.
The hemodynamic parameters obtained were:
- Flow: forward and backward flows
- Regurgitant fraction
- Peak flow
- Peak velocity
- Normalized Flow Displacement (NFD)

Statistical analysis
Data were analysed using Microsoft Excel and IBM SPSS Statistics version 23.0 software (SPSS Inc., Chicago, IL, USA) for Windows. Figures were made with GraphPad Prism version 8. All data are presented as mean ± SD. The Shapiro–Wilk test was used to determine whether the data were normally distributed. Data between groups at different inotropic states were analysed by one-way ANOVA for repeated measurements. Post-hoc testing was performed by Tukey's test. Nonparametric variables were compared using the Wilcoxon test. A p-value of < 0.05 was considered statistically significant.
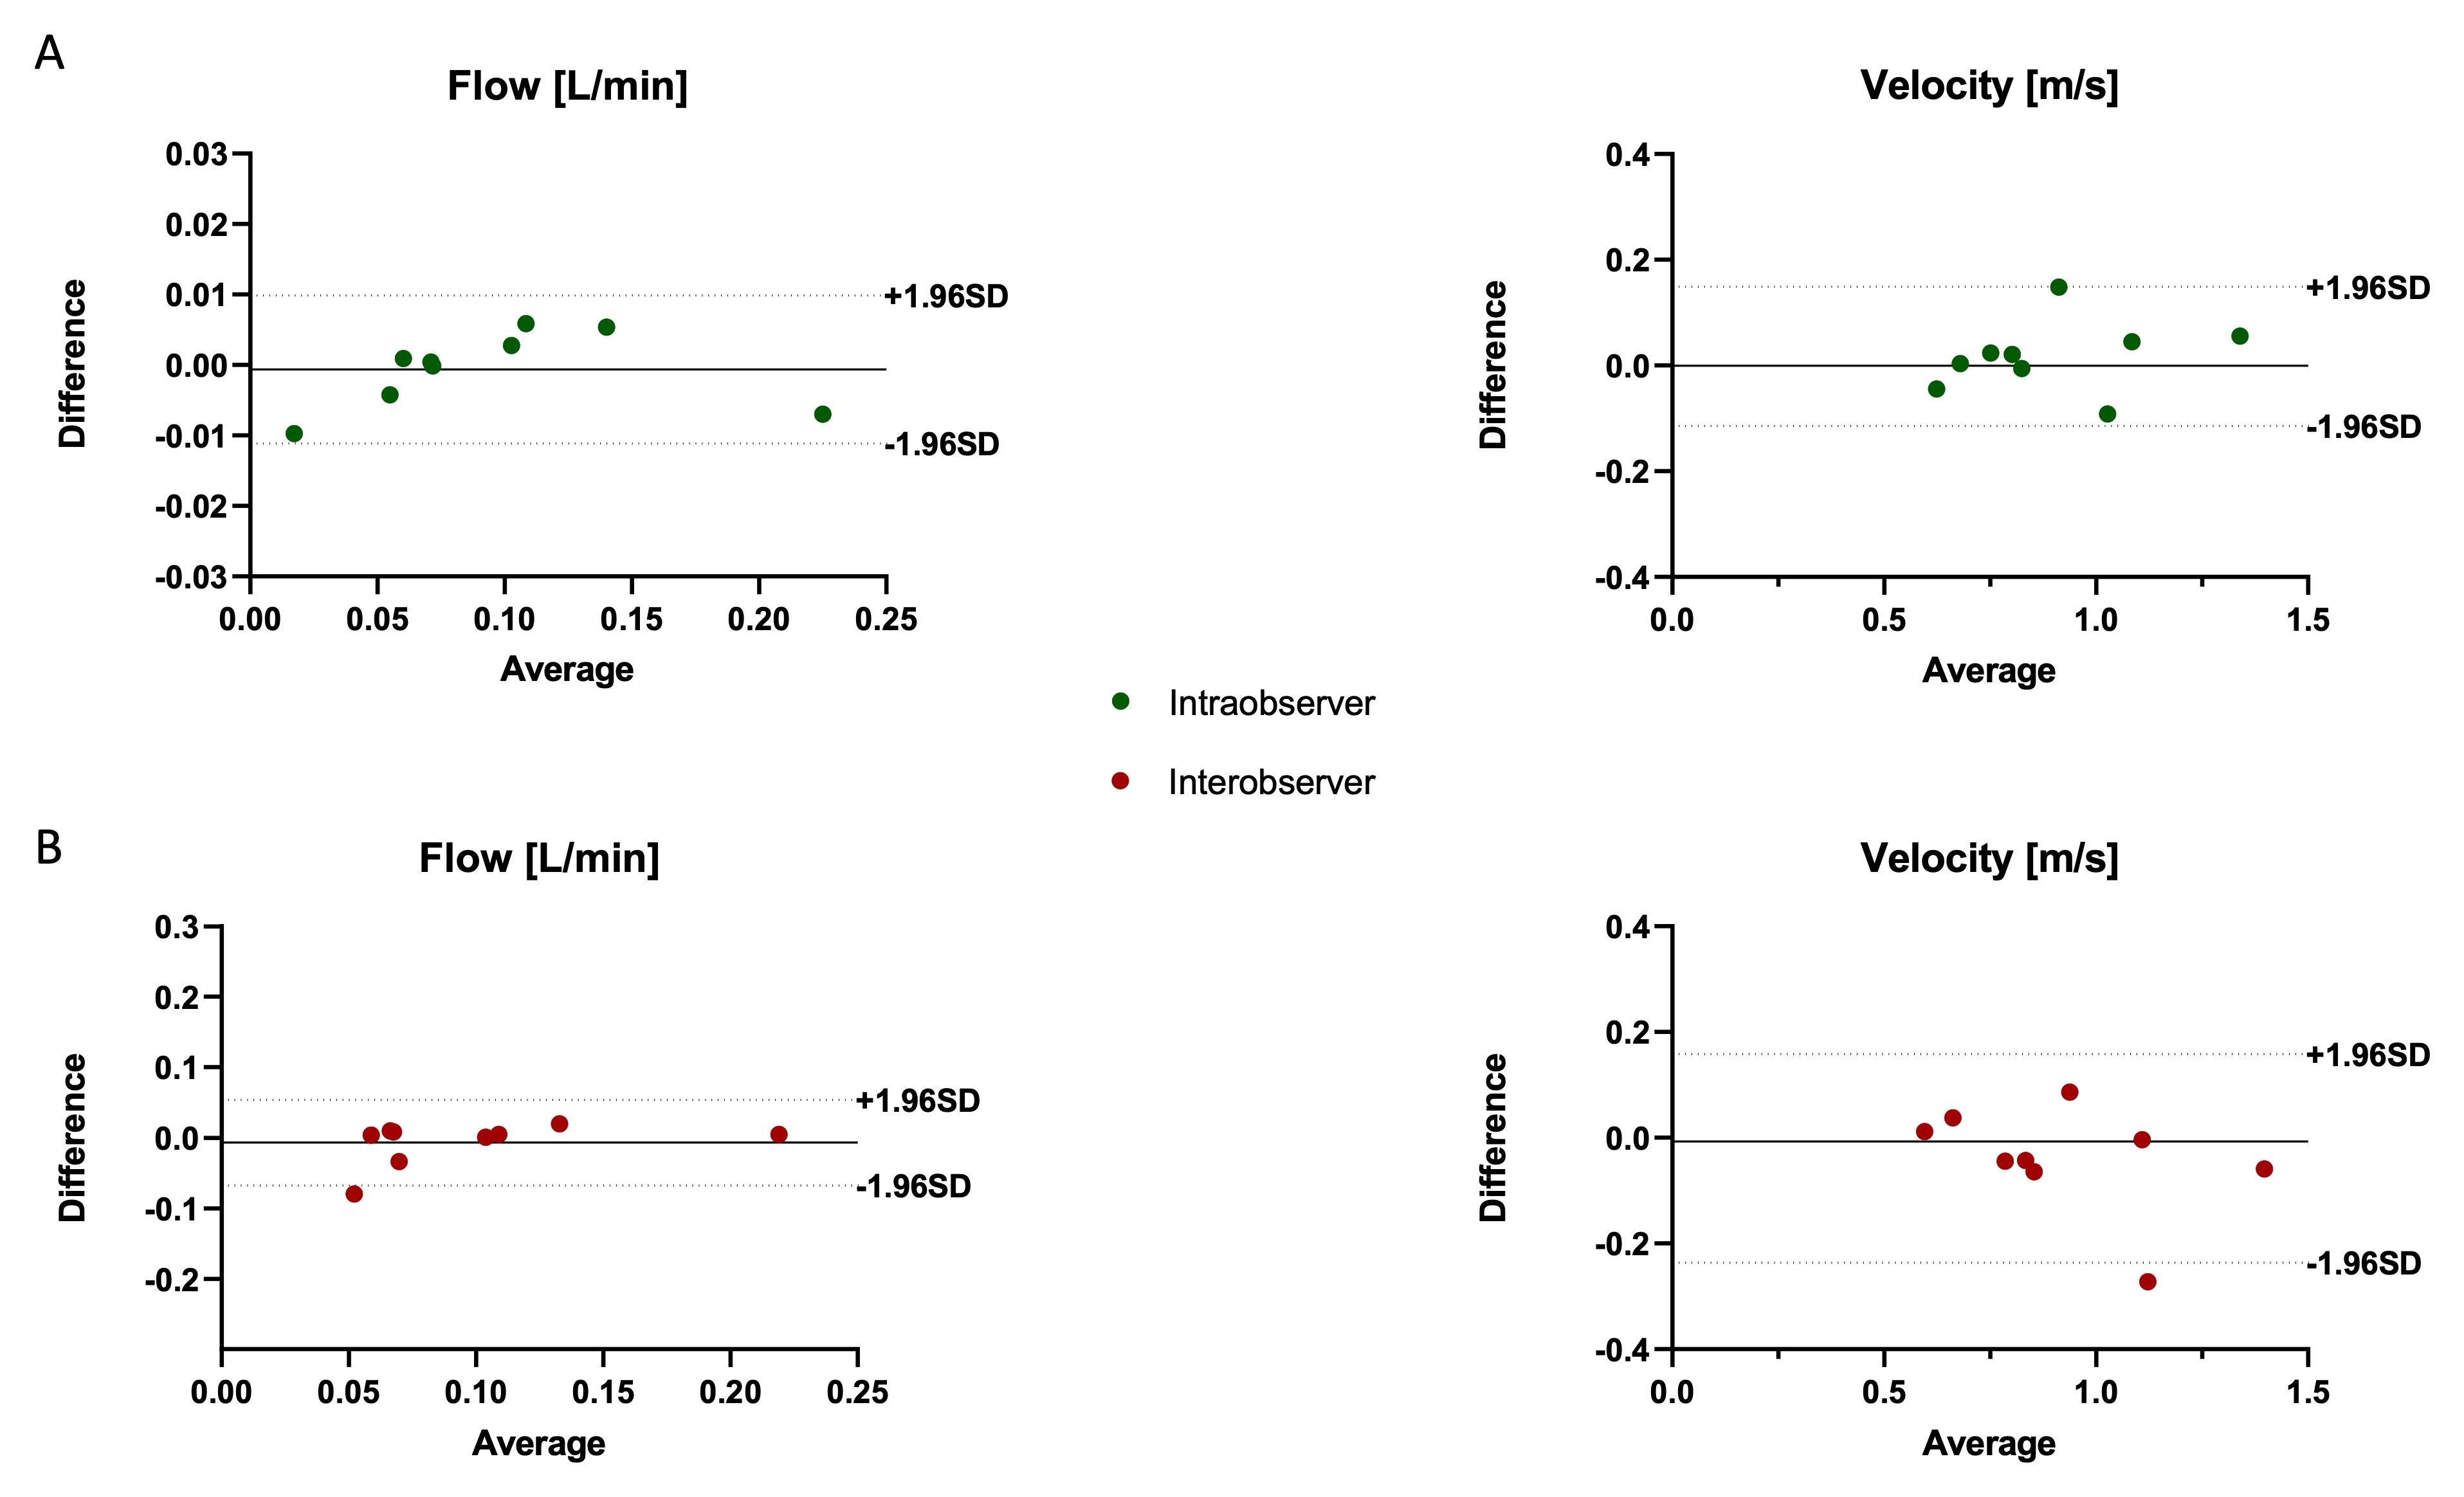
Reproducibility testing
Inter- and intra-observer reproducibility was quantified using intra-class correlation coefficient (ICC). Agreement was considered excellent for ICC >0.74, good for ICC 0.60–0.74, fair for ICC 0.40–0.59, and poor for ICC <0.40. Data analysis was repeated after four weeks to assess intra-observer agreement. All the operators took the measurements twice, and the average values were taken.