Classifier assessments of modified Marsh score components
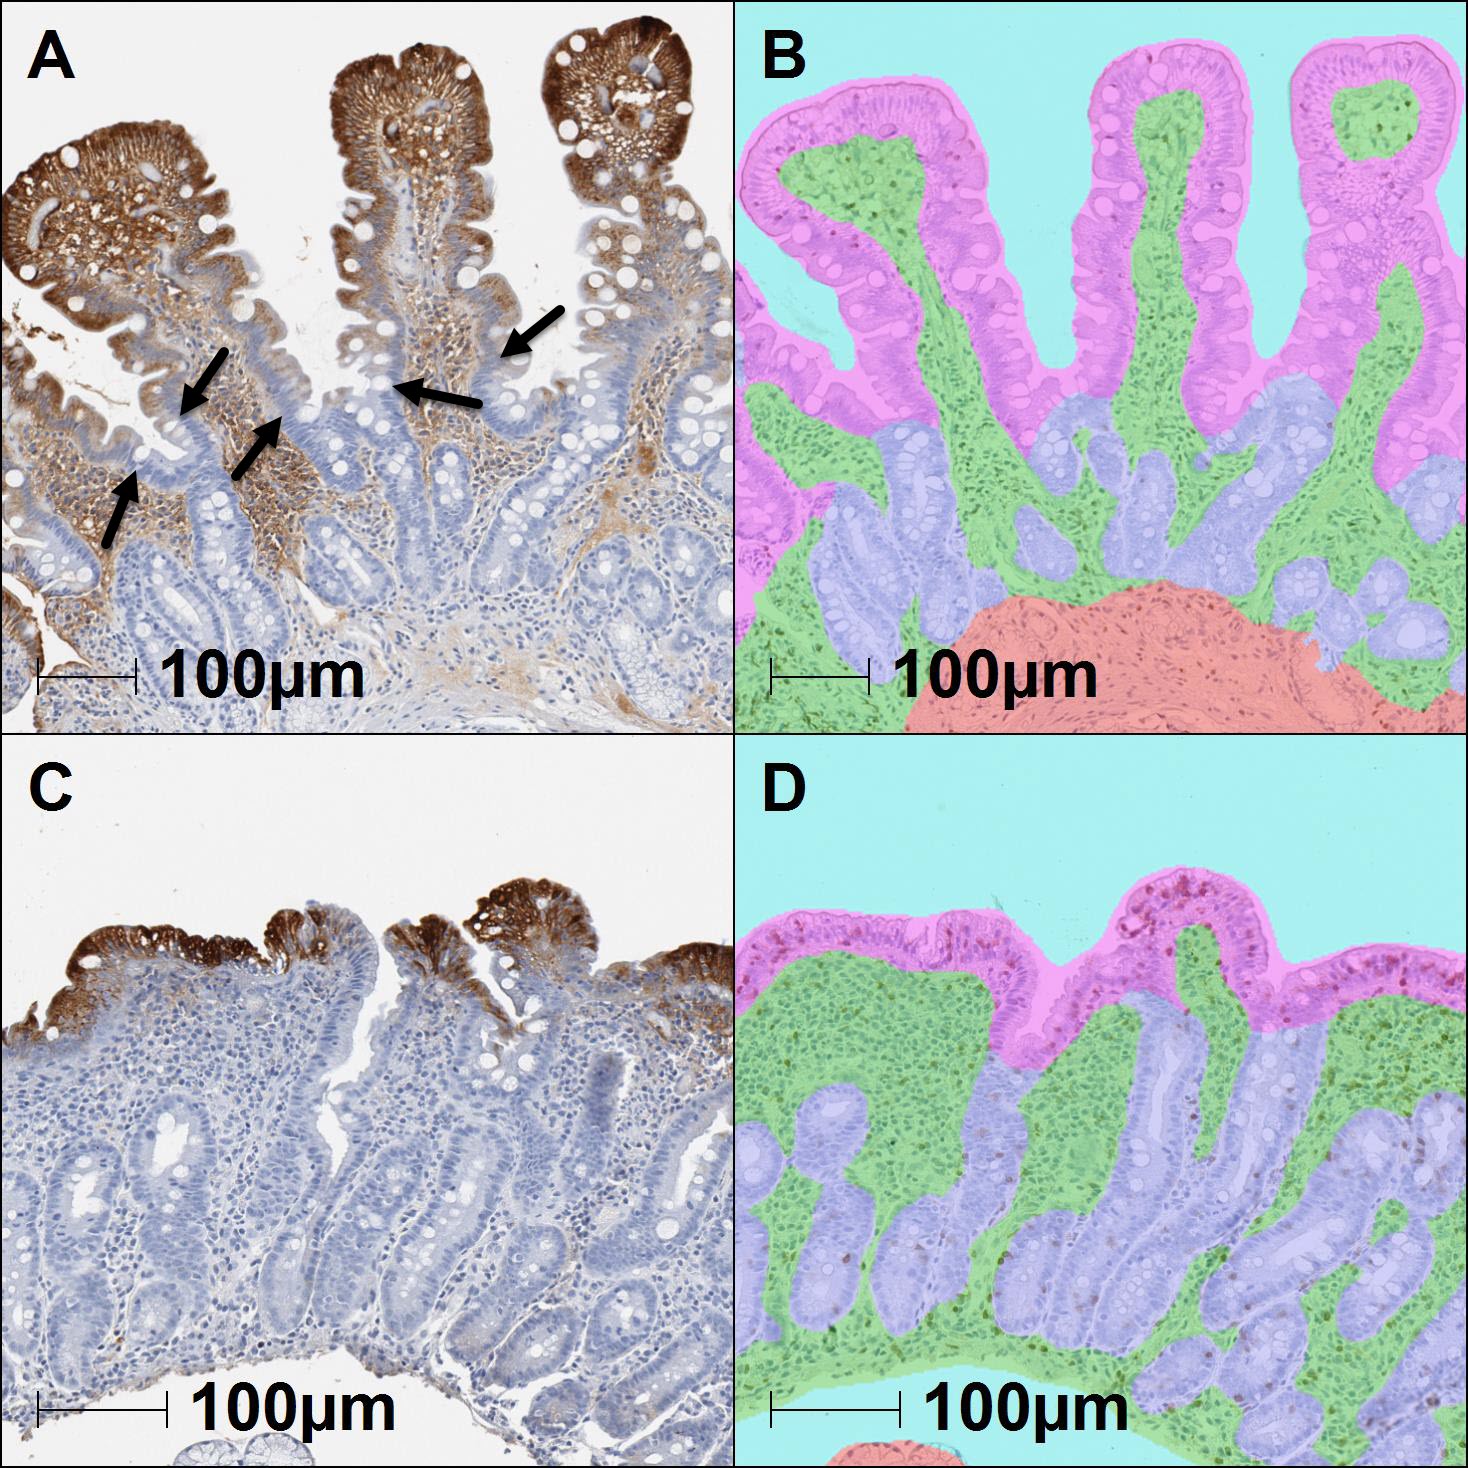
For an initial evaluation of the trained classifiers, we hypothesized that normalized areas of the villous and crypt epithelial compartments could be used as a surrogate for the assessments of villus height and crypt hyperplasia included in the modified Marsh classification. Therefore, quantitative class area measurements associated with the highlighted overlay regions identified from analyzed biopsy tissues (N=116) were exported from the analysis software for comparison with manually obtained scores. Representative classified tissue overlays are shown in comparison with the raw histology images for reference (Fig. 1). Based upon a prior report highlighting the use of IHC to increase the precision of morphometry measurements [12], ApoA4 IHC was performed as an aid to evaluate the ability of the classifier to distinguish the villus-crypt border (Supplemental Figure 1). Most images demonstrated an overlay consistent with ApoA4 IHC immunoreactivity, though some areas of discordance were observed at the base of villi and a few of the samples failed to stain. As a surrogate for villus height, the total area classified as villous epithelium divided by the total area classified as lamina propria was calculated per sample. Comparison of this ratio to the reference modified Marsh score categories demonstrated a significant correlation of decreased normalized area with an increased manual score indicative of villus blunting (Fig.2A). The median villous epithelium/lamina propria area ratio was 0.81 for Type 0-2 samples and 0.29 for Type 3a-3c, (95% CI -0.66 to -0.43, Eta squared=0.4423, p<0.0001).
A similar approach was used as an assessment of crypt hyperplasia by dividing the total area classified as crypt epithelium divided by the total area classified as villous epithelium. Comparison of this ratio to the manual score categories demonstrated a significant correlation of increased normalized area with increased Marsh type indicating crypt hyperplasia (Fig.2B). The median crypt epithelium/villous area ratio was 0.59 for Type 0-1 samples and 1.64 for Type 2-3 samples, (95% CI 0.89 to 1.62, Eta squared=0.2937, p<0.0001). For the assessment of intraepithelial lymphocytosis, the %CD3 VE (CD3 positive cells/enterocytes) measured specifically in the villous epithelial compartment was employed. Comparison of these values with reference modified Marsh score categories demonstrated a significant correlation of increased %CD3 VE with increased manual score signifying intraepithelial lymphocytosis (Fig.2C). The median %CD3 VE was 13.4% for Type 0 and 41.9% for Type 1-3, Eta squared=0.4058, p<0.0001. Once the assessments of villus height and crypt hyperplasia were generated, we investigated the possibility of using these to create a surrogate measure for a villus height to crypt depth ratio. The median values of this relationship were 1.70 for Type 0-1 samples and 0.61 for Type 2-3a-c, 95% CI -1.38 to -0.61 Eta squared= 0.1897, p<0.0001 (Fig.2D). Classifier features plotted by “Type 0-1” and “Type 2-3” categories were also investigated and showed similar results (Supplemental Fig. 2).
The potential for the amount of tissue collected in the endoscopic duodenal biopsy samples to impact classifier performance was assessed by comparing tissue areas for the Type 0-1 and Type 2-3 samples. The median size of the Type 0-1 samples was 5.0 mm2 and 7.1 mm2 for the Type 2-3 samples, which was not statistically different (Supplemental Fig. 3A). The range of all biopsy sample sizes was 0.6mm2 to 28.1mm2. Additionally, an assessment of intraepithelial lymphocytosis in younger versus older patients was made. The %CD3 VE was not statistically different in Type 0-1 samples when comparing patients up to 20 years of age (median %CD3 VE=14.9%) and those 21 years of age and older (median %CD3 VE=17.4). Similarly, the %CD3 VE was not statistically different in Type 2-3 samples from patients up to 20 years of age compared (%CD3 VE=46.0%) to those 21 years and older (%CD3 VE=40.5%) (Supplemental Fig. 3B).
Creation of a machine learning combined feature score for exploratory celiac disease histology assessments
Because the modified Marsh types can be conceptualized as a unified category based upon assessment of 3 individual histologic features of celiac disease pathology, we sought to understand whether the individual machine learning outputs could be used to create a useful combined feature MLS. It was apparent from assessment of the individual features that not all had an equally strong correlation with the manually derived modified Marsh score categories. Association was strongest with the villous height measurement and weakest with the assessment of crypt hyperplasia (0.4499 vs. 0.2875, respectively) with the strength of the median %CD3 VE correlation falling in between (0.4012). Therefore, a regression analysis was performed on the subset of tissue samples (N=67) derived from patients who had more than one biopsy submitted for analysis to determine an appropriate weighting scheme for these variables. The resulting MLS can be expressed as either a continuous variable in decimal format or converted to an ordinal scale for direct comparison with the ground-truth modified Marsh scores as described in the Materials and Methods section.
Using this combined MLS approach, we next expanded the analysis to examine the relationship between the combined feature score and the reference modified Marsh type across the entire set of 116 samples (Fig. 3). A confusion matrix of these combined feature scores examined by individual Marsh type was also explored (Table 2). A heat map of this confusion matrix demonstrated performance of the converted MLS and ground-truth Marsh score (Supplemental Fig. 4). The median MLS for Type 0 samples was 0.73, while the median values for Type 3a and Type 3b were 2.04 and 2.80, respectively. The median values for Type 2 (2.67) and Type 3c (4.08) aligned with the general observation of increasing MLS with increasing Marsh score; however, the number of samples in these categories are few.
Because the performance of the combined MLS across both sample groups appeared promising, we sought to investigate the utility of this approach for categorizing the change in histologic features after clinical intervention. For this experiment, the combined feature score was evaluated in the context of paired biopsy samples captured from the same patient both before and after initiation of a gluten restricted diet (Fig. 4). This cohort of 28 patients included 27 matched sample pairs that demonstrated mucosal healing by modified Marsh score (i.e., a manual score response) and one that displayed no change in Marsh score (pair 5). In total, the disposition of the paired biopsy MLS result aligned with the Marsh score in 100% (N=27/27) of the cohort and in 96.4% (N=27/28) of all matched pairs due to the one patient whose biopsies did not demonstrate a change by Marsh score after diet restriction. (Table 3). Among paired biopsies, the median continuous MLS was 2.72 in “pre-biopsies” and 0.78 in “post-biopsies” with a range of 0.82-4.28 and -1.23-3.49 in ML scores, respectively.
Table 2 Confusion matrix of machine learning combined feature score converted to an ordinal scale compared with the modified Marsh type.
|
|
|
Machine Learning Score^
|
|
|
|
0
|
1
|
2
|
3a
|
3b
|
3c
|
|
Modified Marsh Score
|
0
|
16
|
20
|
6
|
0
|
0
|
0
|
|
1
|
2
|
4
|
4
|
0
|
0
|
0
|
|
2
|
0
|
0
|
1
|
1
|
0
|
0
|
|
3a
|
1
|
4
|
9
|
6
|
2
|
1
|
|
3b
|
0
|
2
|
13
|
11
|
4
|
7
|
|
3c
|
0
|
0
|
0
|
0
|
0
|
2
|
^The machine learning score was converted to an ordinal scale by assigning the closest number, using values of 3.0/3.333/3.666 for scores of 3a/3b/3c respectively.
Table 3 Evaluation of paired-biopsy samples
|
Matched Pair
|
Modified Marsh Score
|
Continuous Machine Learning Score
|
|
Pre-
Biopsy
|
Post- Biopsy
|
Manual Score Response
|
Pre- Biopsy
|
Post- Biopsy
|
Alignment with Manual Score
|
|
1
|
3b
|
0
|
Yes
|
3.95
|
1.63
|
Yes
|
|
2
|
3a
|
0
|
Yes
|
0.82
|
-0.20
|
Yes
|
|
3
|
3b
|
0
|
Yes
|
2.44
|
0.11 4
|
Yes
|
|
4
|
3b
|
1
|
Yes
|
2.22
|
0.21
|
Yes
|
|
5
|
3a
|
3a
|
No
|
2.46
|
3.49
|
No
|
|
6
|
3b
|
0
|
Yes
|
3.78
|
-0.21
|
Yes
|
|
7
|
3b
|
0
|
Yes
|
2.85
|
1.52
|
Yes
|
|
8
|
3a
|
0
|
Yes
|
2.65
|
0.02
|
Yes
|
|
9
|
3b
|
0
|
Yes
|
2.44
|
1.15
|
Yes
|
|
10
|
1
|
0
|
Yes
|
1.57
|
0.78
|
Yes
|
|
11
|
3b
|
3a
|
Yes
|
3.48
|
1.65
|
Yes
|
|
12
|
3b
|
0
|
Yes
|
3.56
|
0.61
|
Yes
|
|
13
|
3b
|
1
|
Yes
|
2.80
|
1.51
|
Yes
|
|
14
|
3a
|
0
|
Yes
|
3.56
|
0.56
|
Yes
|
|
15
|
3a
|
0
|
Yes
|
1.27
|
0.55
|
Yes
|
|
16
|
2
|
1
|
Yes
|
2.28
|
0.93
|
Yes
|
|
17
|
3b
|
0
|
Yes
|
2.36
|
1.65
|
Yes
|
|
18
|
3b
|
0
|
Yes
|
4.28
|
0.40
|
Yes
|
|
19
|
3a
|
0
|
Yes
|
2.60
|
0.00
|
Yes
|
|
20
|
3b
|
0
|
Yes
|
1.70
|
0.98
|
Yes
|
|
21
|
3c
|
3b
|
Yes
|
3.71
|
1.70
|
Yes
|
|
22
|
3a
|
0
|
Yes
|
1.80
|
0.78
|
Yes
|
|
23
|
3b
|
0
|
Yes
|
3.06
|
-1.23
|
Yes
|
|
24
|
3b
|
0
|
Yes
|
2.96
|
0.71
|
Yes
|
|
25
|
3a
|
0
|
Yes
|
2.51
|
0.47
|
Yes
|
|
26
|
3b
|
0
|
Yes
|
3.38
|
0.87
|
Yes
|
|
27
|
3b
|
3a
|
Yes
|
3.02
|
1.96
|
Yes
|
|
28
|
3b
|
0
|
Yes
|
3.13
|
1.13
|
Yes
|
Post-analysis assessment of discordant cases among paired biopsy samples
While most of the machine learning combined feature scores correlated with their associated manually derived modified Marsh results, some discrepancies were noted upon post-analysis assessment. As described in the regression analysis, the directional changes in the %CD3 VE data strongly aligned with ground truth Marsh scores in the paired samples that responded to diet restriction with only one case failing to show a similar directional response in %CD3 VE to the improvement in Marsh score. In that case (pair 28), the other features of surrogate villus height and crypt size aligned appropriately to the Marsh scores but the weight of the %CD3 VE affected the MLS. Similarly, only one case did not show a directional alignment in treatment response in the villus height surrogate feature. The weakest surrogate feature, crypt area, was discordant in 27% of the responding pairs. The classifier overlays for those cases were reviewed again and in most, no cause for the non-alignment was observed, such as errors in the classifier assignments. In some cases, it appeared that one possible cause could be related to the small sample size and sub-optimal orientation of the pre-biopsy resulting in minimal sampling of the crypts (pair 17).