3.1. Preparation and characterizations of FMA NPs
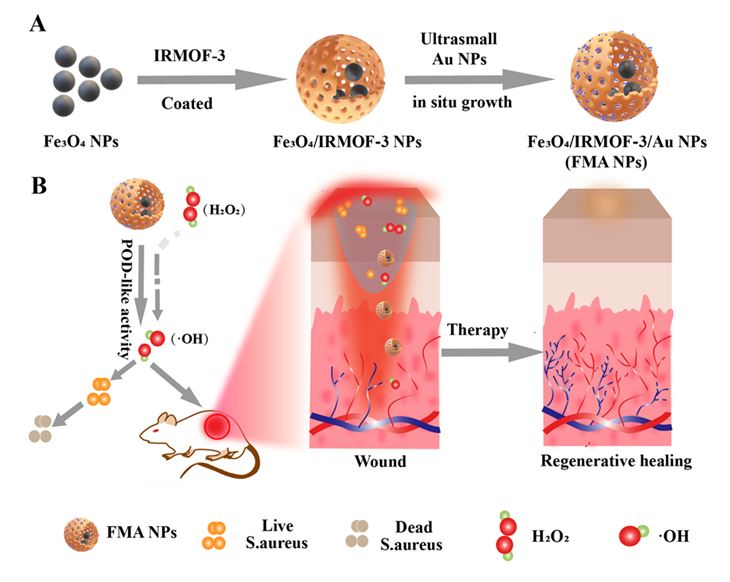
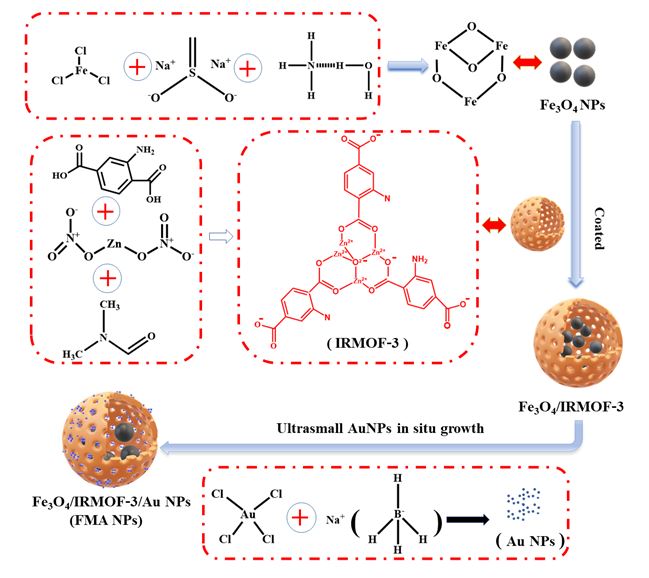
We developed an innovative nanocatalytic antibacterial nanosystem, i.e., IRMOF-3 modulated biomimetic hybrid FMA NPs, which was assembled with the ultrasmall Au NPs and Fe3O4 NPs with synergistically enhanced POD mimicking activities for infected wound healing without employing any antibiotic drugs. The Scheme 2 is illustrated with the synthesis process of the hybrid FMA nanozymes, which include: (i) prepare of superparamagnetic Fe3O4 NPs using partial reduction chemical co-precipitation method; (ii) modification of Fe3O4 NPs with highly porous IRMOF-3 shells to prepare Fe3O4@MOF NPs using the hydrothermal method; (iii) incorporating ultrasmall Au NPs into the pores of IRMOF-3 shells in situ growth, which enhanced their POD activities by cascade reaction to form flexible multiphase catalysts FMA NPs.
The as prepared nanocomposites were characterized as follows. The morphology patterns of the prepared Fe3O4, Fe3O4@MOF NPs and FMA NPs were characterized by TEM. TEM image shows that Fe3O4 NPs display a spherical or elliptic structure with a diameter of around 10 nm (Fig. S1A), and the Fe3O4@MOF NPs showed uniform spherical or more regular square structures (Fig. S1B). The schematic diagram of FMA NPs was shown in Fig. 1A. As shown in Fig. 1B and C, the TEM images of FMA NPs display a core-shell structure with an average particle size about 30 nm, and the ultrasmall and dispersed AuNPs were effectively wrapped into pore channels of IRMOF-3 shells, thus improving their catalytic performances. Elemental mapping analysis was employed to accurately assess the elemental composition of the FMA NPs catalysts. The results suggests that Au Fe, O, and Zn coexist with the FMA NPs in the energy spectrum range (Fig. 1D-I), and the uniform distribution of Au in FMA NPs was verified by EDS elemental mapping (Fig. 2A).
The composition of the fabricated various nanocomposites was analyzed under Fourier transform infrared spectroscopy (FTIR). The characteristic Fe-O-Fe spectral band appeared at 584 cm− 1 due to coating of the Fe3O4 NPs using IRMOF-3, the absorption peak of C-O single bond at 1044 cm− 1, and N-H stretching vibration peak shown at 3407 cm− 1, which corresponds to the typical amino functional group of IRMOF-3, indicating the successful coating of the IRMOF-3 on Fe3O4 NPs (Fig. 2B). After anchoring Au NPs into the pore space, the distinct absorption peak C-N of Fe3O4@MOF NPs appeared at 1645 cm− 1, indicating that the chemical structure of IRMOF-3 modification maintained intact. These above results suggested that FMA NPs were successfully prepared as expected.
To precisely analyze the composition of the Fe3O4@MOF and FMA NPs, the crystal structure of the fabricated complexes was analysed under a X-ray diffractometer (XRD). The diffraction peaks at 2θ = 35.2°, 41.5°, 50.6°, 63.0°, 67.3°, and 74.2° corresponding to the (220), (311), (400), (422), (511), and (440) crystal planes of the Fe3O4 NPs (JCPDS 65-3107) (Fig. 2C), and the diffraction peaks of MOF match well with the X-ray diffraction spectra reported in the corresponding literature [43, 44], indicating that the formation of the MOF shell layer did not change the crystal structure of the Fe3O4 NP. After the in situ formation of Au NPs. There no MOF peaks were detected in the core-shell structure of the final carrier. It has been shown that the crystallinity of MOF particles depends on the amount of solvent occupying the inner pores [45, 46]. Therefore, when the thinner MOF shell layer is heated during the synthesis process, the MOF shell layer is likely to undergo a crystalline to amorphous transition. However, the FMA NPs 2θ = 44.7°, 52.1°, 76.8° has a good correspondence with the crystalline planes of (111), (200), (220) of the standard card of Au NPs (JCPDS 04-0784), and also well preserved the characteristic diffraction peaks of Fe3O4 NPs, which also shows that Au NPs are well bound to the IRMOF-3 shells, and these results also prove the successful preparation of FMA NPs.
The hydration particle size distribution of various nanoparticles was analyzed with a DLS in DI water. As shown in Fig. 2D, Fe3O4 NPs have a broad particle size distribution with an average hydration particle of 320 nm, while the average hydration particle of Fe3O4@MOF NPs is 450 nm. The Au NPs loading increases the hydration particle size of FMA NPs to about 600 nm. The hydration particle size of Fe3O4 NPs, Fe3O4@MOF NPs and FMA NPs displayed a sequentially increased tendency, indicating the successful coating of the various modified layers. The zeta potential analysis showed that the charges of Fe3O4, Fe3O4@MOF and FMA NPs were at around − 23.1, -2.97 and − 14.7, respectively (Fig. 2E), and all the above results further indicated that the successful modification of different coating layers. In addition, the stability of FMA NPs in different media at different time points was investigated. As shown in Fig. 2F, the FMA NPs showed the best stability various medium after 24 h treatment in deionized water. The stability of FMA NPs in PBS buffer is the worst, which may be the presence of abundant salt ions in the buffer, and neutralized the charge on the surface of the nanocomposites, leading to the aggregation or precipitation of large particles. The stability in NaAc-HAc buffer solution was intermediate, and showed excellent stability in 10 h of the experiment, so the NaAc-HAc solution was selected for further experiments.
3.2. Evaluation of intrinsic POD mimicking activities of FMA NPs
Figure 3A illustrated the catalytic mechanism of FMA NPs, the FMA NPs catalyzed H2O2 into •OH radicals with a synergistic POD-like activity of Fe3O4 NPs and ultrasmall Au NPs, and then the colorless TMB is oxidized in the presence of •OH, thus showing blue color reaction. Compared with the catalytic activity of a single Fe3O4 NPs or ultrasmall Au NPs, the addition of Au NPs significantly increases its catalytic activity, so its catalytic rate could further improved Fig. S2 showed various absorption peaks at 652 nm of various formulations, the groups without catalysts including TMB + NaAc and TMB + H2O2 had a weak absorption peak, while other reaction systems with different catalysts had a strong absorption peak at 652 nm. In addition, the simulated enzyme activity of Fe3O4@MOF NPs was slightly below trend than that of the naked Fe3O4 NPs, which can be attributed to the fact that MOF occupies the surface of Fe3O4 NPs, leading to the reduction of the catalytic center. However, the catalytic ability of FMA NPs was significantly enhanced by the in situ incorporated Au NPs, which was attributed to the synergistic effects of Fe3O4 NPs and Au NPs. The simulated enzyme catalytic activity of different concentration catalysts with different concentration was also compared, the POD mimicking activity of various catalysts increased with the increasing concentration, and the absorbance of FMA NPs is highest, indicating the strongest POD activity (Fig. 3B).
The catalytic performance of enzymes is influenced by the reaction time, temperature, and pH. Therefore, the catalytic activities of different nanocomposites and natural POD were determined under the changing reaction conditions. As shown in Fig. 3C, the FMA NPs remain stable catalytic activities within a broad pH range (from 3.0 to 6.5), and the optimum reaction pH is 3.6. Figure 3D shows that FMA NPs possess a high catalytic activity between 20°C and 50°C, which overcomes the disadvantages of the natural POD that is sensitive to the temperature. Figure 3E shows that FMA NPs display significantly higher catalytic activities during the 30 min reaction time compared with the other groups, which is contributed to synergetic catalytic effects between AuNPs and Fe3O4 NPs. However, the activity of natural POD decreased after 15-min reaction time. Thus, compared with natural POD, FMA NPs displayed high and stable POD mimicking activities in a wide pH range, incubation temperature, and reaction time, and the optical reaction conditions of FSC nanozymes was at pH 3.6, reaction temperature 37°C, and reaction time of 15 min.
3.3. Steady-state Kinetic analysis
The kinetic parameters of the hybrid FMA nanozymes were determined with the varying TMB or H2O2 concentration under the optimal reaction conditions. The results showed that the catalytic reaction by FMA NPs fit the typical Michaelis-Menten model (Fig. 3F and G). Thus, we could use this model to evaluate the catalytic ability of FMA nanozymes. The related kinetic parameters (Km and Vmax) were derived from the Lineweaver-Burk plot, and the Km values were 0.34 and 0.24 mM for TMB and H2O2 on the basis of Lineweaver-Burk double reciprocal plot, respectively (Fig. 3F and G). Compared with other catalysts (Table S1), FMA nanozymes has a larger Vmax indicating a excellent catalytic efficiency. At the same catalyst concentration, the Kcat value (Vmax / [E], in which Kcat is the catalytic constant, [E] is the concentration of nanozyme or HRP) of FMA NPs is the largest, which indicates that the catalytic efficiency per nanoparticle is the highest.
3.4. Evaluation of biosafety in vitro
Excellent biocompatibility is one of an essential feature for nano-biomaterials which can be used in clinical applications, and the blood compatibility is an important indicator of biocompatibility [47], therefore, we investigated the hemolysis of FMA NPs. As shown in the Fig. 4A, seldom hemolysis effects were observed with the concentration at 0-400 µg/mL, and the hemolysis rate was well below 5%, indicating its superior hemocompatibility at the given concentrations and employing the FMA NPs to be employed for further antimicrobial treatment.
HUVECs and normal hepatocytes L-02 cells were served as the model cells to assess the in vitro cytotoxicity of FMA NPs. As shown in Fig. 4B and C, after treatment with FMA NPs for 24 h, the cell viabilities for the HUVECs and normal hepatocytes L-02 cells were still greater than 95% at low concentrations, and the cell viability of HUVECs and hepatocytes L-02 cells was kept above 90% even at a 400 µg/mL high concentration of FMA NPs, indicating high biosafety of FMA NPs. Therefore, these results showed that the fabricated FMA NPs had excellent biocompatibility and negligible toxicity.
We also used fluorescence FDA/PI double labeling to assess cell viability of hepatocytes L-02 cells and HUVECs after FMA NPs treatment, and the living cells were stained by FDA, and showed green fluorescence, while the dead cells were stained by PI and displayed red fluorescent [48]. As shown in Fig. 5A-B, compared with control, a small amount of cells were dead after the addition of co-incubated 12 h with different nanoparticles, respectively, but the percentage of both live cells was around 95% at 200 µg/mL of each nanoparticle. Even in the presence at 400 µg/mL concentration of FMA NPs, the viability of HUVECs and hepatocytes L-02 cells was 91% and 92% (Fig. 5C and D). These results indicated that the fabricated nanoparticles displayed negligible toxic effects.
3.5 Analysis of antibacterial performances in vitro
The antibacterial performance of FMA NPs was measured in vitro using the plate counting method. As shown in Fig. 6A, it was found that there was slightly decreased in the number of CFU with only FMA NPs or H2O2 treatment compared with the control, indicating that FMA NPs or H2O2 did not have a significant effect on bacterial viability. In contrast, the treatment with FMA NPs and a low-dose of H2O2 had a remarkable inhibiting effect on bacterial growth, and the antibacterial rate were 76% and 72% for E. coli and S. aureus with low concentration (200 µg/mL) FMA NPs and H2O2 treatment. Especially, the antibacterial activities for E. coli and S. aureus could achieve 97% and 98% using the 400 µg/mL FMA NPs and H2O2 treatment, which was attributed to the production of abundant toxic·OH radicals.
3.6 Analysis of the morphology of the treated bacterial species
The morphological changes of the treated E. coli and S. aureus using different formulations were detected by SEM. The untreated E. coli and S. aureus showed morphologically rod-like and spherical with smooth surface respectively. When treated with H2O2, E. coli and S. aureus rarely displayed observable changes. After treatment with FMA NPs, the overall bacterial morphology showed a few changes, indicating a slight antibacterial activity against E. coli and S. aureus. While co-treatment with FMA NPs and H2O2 disrupted bacterial integrity, especially, after the treatment using a high concentration of FMA NPs and H2O2, the morphology of bacteria had been destroyed, with unclear borders between bacteria, different degrees of depression on the surface, and most of the bacterial morphology had been cleaved because of the generation of toxic ·OH (Fig. 6D). These results were consistent with the colony-forming unit method, which were further confirmed with the improved antibacterial effects of FMA NPs and H2O2.
3.7 Biofilm clearance test analysis
Biofilm formation was performed to analyze the effects of various formulations using crystalline violet staining. The biofilm was slightly removed from the bottom of the 24-well microplates when treated with the FMA NPs or H2O2, while the treatment with combined FMA NPs and H2O2 caused significant biofilm removal. As shown in Fig. 7A and B, the treatment using a high concentration of FMA NPs (400 µg/mL) and H2O2 displayed the strongest anti-biofilm effects on the tested E. coli and S. aureus, and the inhibition rate of biofilm for E. coli and S. aureus reached to 83% and 91%, respectively. We also investigated the ring-breaking ability on biofilms by incubating different formulations with pre-formed biofilms. Compared with control, biofilms were barely cleared under the treatment with H2O2 and FMA NPs, while the inhibition for E. coli and S. aureus achieved 75% and 85%with FMA NPs and H2O2 treatment (Fig. S3A and B). These results also demonstrated that the obviously enhanced antibacterial abilities of FMA NPs and H2O2.
3.8 Analysis of live and dead bacteria
To further investigate the enhanced antibacterial abilities of FMA NPs, nucleic acid dyes SYTO9 and PI were employed for live/dead cell assays. As shown in Fig. 7C and D, the green fluorescence signal of E. coli and S. aureus was predominant in the control group, which indicated that there were almost no dead bacteria. After treatments with H2O2 or FMA NPs, only a little red fluorescence could be observed by reason of the low antibacterial efficiency, while co-treatment with H2O2 and FMA NPs, the number of dead bacteria significantly increased because of the production of highly toxic ·OH radicals as shown by the predominant red fluorescence signal, which suggested that the antibacterial efficiency could greatly enhance and, further cause a large amount of bacterial death (Fig. 7C and D). Especially associated with the high concentration of FMA NPs and H2O2 treatment, the green fluorescence signal almost disappeared, indicating that the bactericidal ability depends on the concentration of FMA NPs.
3.9 Evaluation of wound healing effects
Given that the excellent antibacterial performances were observed, evaluation in vivo was employed to investigate the prospect of FMA NPs in wound healing. The twenty KM mice with the wound on their backs were divided randomly into five groups. Subsequently, 107 CFU/mL S. aureus were dropped to prepare the bacteria-infected wounds. Various formulations were injected into the wound after 1-day infection. Figure 8A showed the treatment process of animal model. As shown in Fig. 8B, a relatively slow wound healing was displayed in the control, and treatment with H2O2 or FMA NPs, which was attributed to the low catalytic ability. By comparison the wound healing rate of the mice reached more than 80% after 3 days post-injection when treated with FMA NPs and H2O2, and the wound had crusted and completed healing after 9 days post-injection, and its healing rate was remarkablely higher than that of the other groups (Fig. 8C), indicating the promoting healing effects caused by ·OH radicals to the bacterial species in wounds. Significantly, the FMA NPs and H2O2 significantly accelerated the healing process compared with the control. More importantly, the body weight of the treated mice did not change obviously, indicating that the non-toxicity of the designed FMA nanozymes in vivo (Fig. 8D).
To assess the wound-healing efficiency of various mice, hematoxylin and eosin (H&E) staining were performed for histological analysis of the mice’s wound tissues. As shown in Fig. 9A, compared with the lower wound closure with incomplete epidermal layers and inflammatory cells observed after H2O2 treatment, an intact epidermal layer was observed on the wounds after treatment using FMA NPs and H2O2, and especially the mice displayed a high degree of wound re-epithelialization with a high concentration treatment. Thus, the prepared hybrid FMA nanozymes displayed an excellent ability of wound healing in vivo. Moreover, the H&E staining of the main organs of the treated mice display no lesions, indicating the FMA nanozymes display the good biosafety in vivo (Fig. 9B).