Study area and collection of parasite data
We used bird data and parasite genetic data collected as part of an earlier study, see details in Gupta et al. [32]. Briefly, birds were captured using mist-nets at 52 localities across four major Sky Island groups, separated by three biogeographic barriers, spanning 600 km in the southern Western Ghats mountain range during 2011-2013 (Fig. 2). Blood samples (50-100 μl) were collected from the ulnar vein of the bird with a heparinized micro-hematocrit capillary tube and immediately stored in blood lysis buffer. Avian haemosporidian infection was identified by amplifying parasite’s partial mitochondrial cytochrome b gene (478bp) [62]. Positive infections were sequenced and paired DNA sequences were aligned in Geneious 9.1.5 [63]. Unique haemosporidian lineages were identified by comparing parasite sequences with publicly available sequences in NCBI and in the MalAvi database [22].
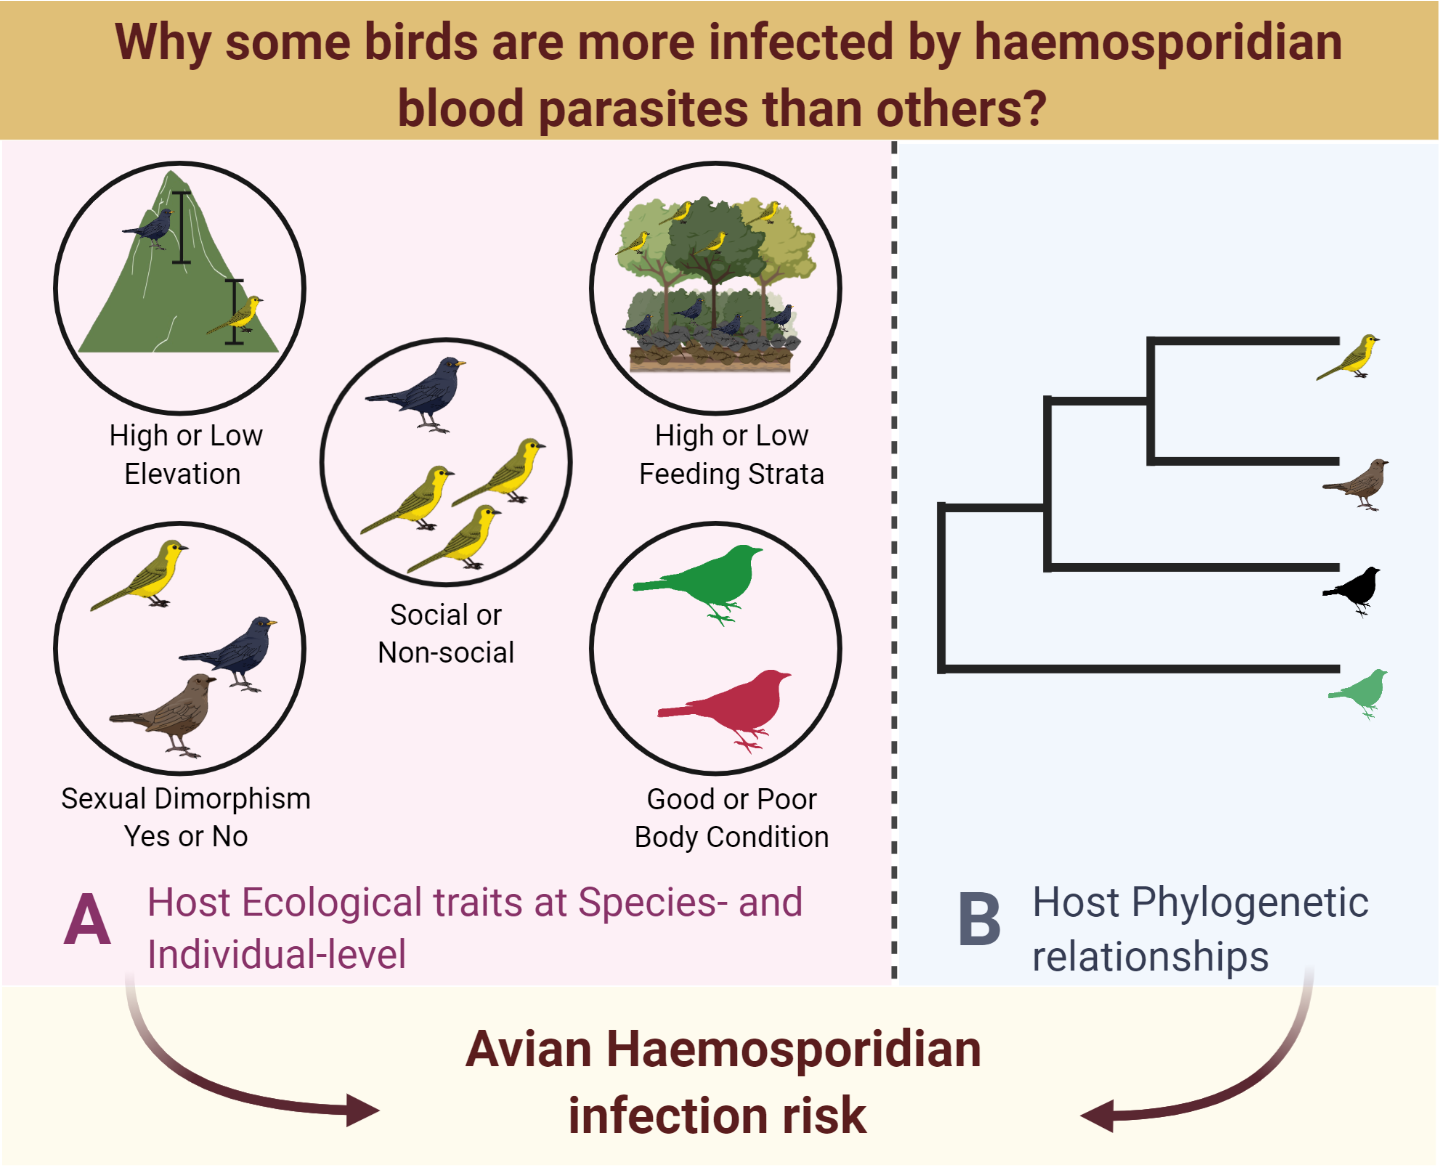
Ecological trait data
We collected data on host ecological traits based on the current understanding of vectors transmitting avian haemosporidians and included traits that increase hosts’ exposure and/or host susceptibility to parasitism. Data on ecological traits of host species was collected from previous field observations by C.K. Vishnudas (CKV) and V.V. Robin (VVR) and additionally sourced from the Wilman dataset [64]. Our dataset included seven species-specific variables: foraging strata (High/Low), roosting behavior (Social/Non-social), host habitat type (Forest/Grassland), elevational range (Specialist/Generalist), genetic connectivity (Breaks/No breaks), sexual dimorphism (Yes/No) as categorical variables and minimum species elevation as a covariate (details in Additional file 1: Table S1, S2). Briefly, birds were classified into two categories based on their foraging strata: Low (ground foraging) and High (understory to mid-level foraging) based on Somasundaram et al. [65] and Wilman et al. [64], with the former being given precedence as it reported data specific to the Western Ghats. Species roosting behavior was categorized into social and non-social based on field observations by CKV and VVR. Host habitat type was based on species habitat preferences: Forest (species preferring evergreen, semi-evergreen, moist-deciduous, dry-deciduous, scrub habitat) or Grassland (open country, grassland) based on Ali and Ripley [78] and field observations by CKV and VVR. Species elevational range was classified into two categories: Specialists (species restricted to high-elevations, occurring above 1400 m) and Generalists (species having a wider distribution ranging from low to high elevations) as assessed in an earlier study [56]. Genetic connectivity was classified as: Breaks/No breaks (species with evidence of genetic divergence or no evidence of genetic divergence due to the biogeographical gaps, respectively) based on Robin et al. [56]. Sexual dimorphism was classified into two categories: Yes/No (species with differences in plumage between sexes or no plumage differences between sexes, respectively) based on Ali and Ripley [78]. We used bird distribution data to estimate the Minimum elevational distribution extent of the bird species (details in Additional file 1: Table S2).
At the individual level, the ecological trait data consisted of four variables associated with body size, fluctuating asymmetry (FA) and body condition. The body size variables included tarsus and wing measurements (details in Additional file 1: Table S2). We calculated a measure of fluctuating asymmetry with respect to tarsus (FATarsus) as per Van Dongen [66]. We also estimated individual body condition, a commonly used proxy of infection-induced fitness cost [20], based on scaled mass index as proposed by Peig and Green [67], which accounts for covariance between body size and body mass components. The condition score was calculated by standardizing body mass at a fixed value of a linear body measurement based on the scaling relationship between mass and length. We used body weight as the mass measurement and wing length measurement as the length variable because average wing length was most strongly correlated with body weight on a log-log scale (Pearson correlation, r = 0.80, p <0.001, details in Additional file 1: Table S2). All individual measurement variables were standardized by a z-transform within each species (i.e., a unit increase in the measurement indicates one standard deviation increase over the mean value for the species).
Statistical Analyses
We built Bayesian phylogenetic mixed models (BPMM) to assess the association between infection risk and host ecological and morphometric traits using the R-package ‘MCMCglmm’ [68]. We used BPMM as it allowed us to control for statistical non-independence of trait data due to host phylogenetic relationships [69]. We modeled host infection status as a binary response variable (0 for uninfected, 1 for infected) with a logit link, for Plasmodium and Haemoproteus, and different species- and individual-level ecological traits as predictor variables. To account for shared ancestry between host species, we fitted a variance–covariance matrix of phylogenetic distances between host species generated from the host phylogeny as a random effect. We used host phylogeny based on cytochrome b sequence data (1143bp) from earlier studies [32,56]. We included sampling sites as another random effect to account for non-independence among the sampled individuals due to sampling design. We conducted two separate BPMM analyses with the host species ecological traits and individual trait data because we had complete morphometric measurements for only a subset of individuals (n = 991 individuals). We excluded all individuals without complete information from the individual level BPMM analysis. For both datasets, we first tested a fully parameterized model including all predictors and then ran subsequent reduced models by excluding non-significant predictors, one at a time based on p-values. We used weak, uninformative prior (normal distribution with mean of zero and very large variance) for the fixed effects, an expanded prior (χ 2 distribution with 1 degree of freedom) for the random effects and fixed residual variance at 1, based on recommendations by de Villemereuil et al. [70] and Hadfield [68]. We ran each model chain for 2 million iterations with burn-in of 100,000 and thinning intervals of 1000 iterations. Additionally, we conducted three independent MCMC runs for our final reduced model that included significant predictors from both species- and individual-level analyses. Analyses for each parasite genera (Plasmodium and Haemoproteus) were conducted separately.
We visually analyzed the trace plots for all model parameters to assess mixing properties and stationarity of chains. We assessed convergence of the MCMC chains by evaluating correlation between samples (autocorrelation <0.1) and Gelman-Rubin statistic (Potential scale reduction factor, PSRF < 1.1 preferred among chains) using R-package ‘coda’ [71]. We considered model parameters to be significant when the 95% credible intervals (CIs) of posterior estimates excluded zero and p-values were < 0.05. We evaluated the performance of our final reduced models using a suite of standard metrics including sensitivity, specificity and area under the receiver-operator curve (AUC) statistic, as implemented in the R-package ‘cutpointr’. We also calculated predicted infection probabilities for each species and evaluated the model fits by plotting the observed and predicted infection probabilities.
Furthermore, we calculated the proportion of the total variance explained by host species phylogeny by estimating phylogenetic heritability, equivalent to Pagel’s lambda (λ) to measure the degree of phylogenetic signal [72,73]. We estimated the mean and 95% highest posterior density (HPD) of λ for each MCMC chain by dividing the phylogenetic variance-covariance (VCV) matrix by the sum of the phylogenetic, location, and residual VCV matrices [73]. All statistical analyses and graphing were conducted in R ver. 3.6.2 [74].
Study area and collection of parasite data
We used bird data and parasite genetic data collected as part of an earlier study, see details in Gupta et al. [32]. Briefly, birds were captured using mist-nets at 52 localities across four major Sky Island groups, separated by three biogeographic barriers, spanning 600 km in the southern Western Ghats mountain range during 2011-2013 (Fig. 2). Blood samples (50-100 μl) were collected from the ulnar vein of the bird with a heparinized micro-hematocrit capillary tube and immediately stored in blood lysis buffer. Avian haemosporidian infection was identified by amplifying parasite’s partial mitochondrial cytochrome b gene (478bp) [62]. Positive infections were sequenced and paired DNA sequences were aligned in Geneious 9.1.5 [63]. Unique haemosporidian lineages were identified by comparing parasite sequences with publicly available sequences in NCBI and in the MalAvi database [22].
Ecological trait data
We collected data on host ecological traits based on the current understanding of vectors transmitting avian haemosporidians and included traits that increase hosts’ exposure and/or host susceptibility to parasitism. Data on ecological traits of host species was collected from previous field observations by C.K. Vishnudas (CKV) and V.V. Robin (VVR) and additionally sourced from the Wilman dataset [64]. Our dataset included seven species-specific variables: foraging strata (High/Low), roosting behavior (Social/Non-social), host habitat type (Forest/Grassland), elevational range (Specialist/Generalist), genetic connectivity (Breaks/No breaks), sexual dimorphism (Yes/No) as categorical variables and minimum species elevation as a covariate (details in Additional file 1: Table S1, S2). Briefly, birds were classified into two categories based on their foraging strata: Low (ground foraging) and High (understory to mid-level foraging) based on Somasundaram et al. [65] and Wilman et al. [64], with the former being given precedence as it reported data specific to the Western Ghats. Species roosting behavior was categorized into social and non-social based on field observations by CKV and VVR. Host habitat type was based on species habitat preferences: Forest (species preferring evergreen, semi-evergreen, moist-deciduous, dry-deciduous, scrub habitat) or Grassland (open country, grassland) based on Ali and Ripley [78] and field observations by CKV and VVR. Species elevational range was classified into two categories: Specialists (species restricted to high-elevations, occurring above 1400 m) and Generalists (species having a wider distribution ranging from low to high elevations) as assessed in an earlier study [56]. Genetic connectivity was classified as: Breaks/No breaks (species with evidence of genetic divergence or no evidence of genetic divergence due to the biogeographical gaps, respectively) based on Robin et al. [56]. Sexual dimorphism was classified into two categories: Yes/No (species with differences in plumage between sexes or no plumage differences between sexes, respectively) based on Ali and Ripley [78]. We used bird distribution data to estimate the Minimum elevational distribution extent of the bird species (details in Additional file 1: Table S2).
At the individual level, the ecological trait data consisted of four variables associated with body size, fluctuating asymmetry (FA) and body condition. The body size variables included tarsus and wing measurements (details in Additional file 1: Table S2). We calculated a measure of fluctuating asymmetry with respect to tarsus (FATarsus) as per Van Dongen [66]. We also estimated individual body condition, a commonly used proxy of infection-induced fitness cost [20], based on scaled mass index as proposed by Peig and Green [67], which accounts for covariance between body size and body mass components. The condition score was calculated by standardizing body mass at a fixed value of a linear body measurement based on the scaling relationship between mass and length. We used body weight as the mass measurement and wing length measurement as the length variable because average wing length was most strongly correlated with body weight on a log-log scale (Pearson correlation, r = 0.80, p <0.001, details in Additional file 1: Table S2). All individual measurement variables were standardized by a z-transform within each species (i.e., a unit increase in the measurement indicates one standard deviation increase over the mean value for the species).
Statistical Analyses
We built Bayesian phylogenetic mixed models (BPMM) to assess the association between infection risk and host ecological and morphometric traits using the R-package ‘MCMCglmm’ [68]. We used BPMM as it allowed us to control for statistical non-independence of trait data due to host phylogenetic relationships [69]. We modeled host infection status as a binary response variable (0 for uninfected, 1 for infected) with a logit link, for Plasmodium and Haemoproteus, and different species- and individual-level ecological traits as predictor variables. To account for shared ancestry between host species, we fitted a variance–covariance matrix of phylogenetic distances between host species generated from the host phylogeny as a random effect. We used host phylogeny based on cytochrome b sequence data (1143bp) from earlier studies [32,56]. We included sampling sites as another random effect to account for non-independence among the sampled individuals due to sampling design. We conducted two separate BPMM analyses with the host species ecological traits and individual trait data because we had complete morphometric measurements for only a subset of individuals (n = 991 individuals). We excluded all individuals without complete information from the individual level BPMM analysis. For both datasets, we first tested a fully parameterized model including all predictors and then ran subsequent reduced models by excluding non-significant predictors, one at a time based on p-values. We used weak, uninformative prior (normal distribution with mean of zero and very large variance) for the fixed effects, an expanded prior (χ 2 distribution with 1 degree of freedom) for the random effects and fixed residual variance at 1, based on recommendations by de Villemereuil et al. [70] and Hadfield [68]. We ran each model chain for 2 million iterations with burn-in of 100,000 and thinning intervals of 1000 iterations. Additionally, we conducted three independent MCMC runs for our final reduced model that included significant predictors from both species- and individual-level analyses. Analyses for each parasite genera (Plasmodium and Haemoproteus) were conducted separately.
We visually analyzed the trace plots for all model parameters to assess mixing properties and stationarity of chains. We assessed convergence of the MCMC chains by evaluating correlation between samples (autocorrelation <0.1) and Gelman-Rubin statistic (Potential scale reduction factor, PSRF < 1.1 preferred among chains) using R-package ‘coda’ [71]. We considered model parameters to be significant when the 95% credible intervals (CIs) of posterior estimates excluded zero and p-values were < 0.05. We evaluated the performance of our final reduced models using a suite of standard metrics including sensitivity, specificity and area under the receiver-operator curve (AUC) statistic, as implemented in the R-package ‘cutpointr’. We also calculated predicted infection probabilities for each species and evaluated the model fits by plotting the observed and predicted infection probabilities.
Furthermore, we calculated the proportion of the total variance explained by host species phylogeny by estimating phylogenetic heritability, equivalent to Pagel’s lambda (λ) to measure the degree of phylogenetic signal [72,73]. We estimated the mean and 95% highest posterior density (HPD) of λ for each MCMC chain by dividing the phylogenetic variance-covariance (VCV) matrix by the sum of the phylogenetic, location, and residual VCV matrices [73]. All statistical analyses and graphing were conducted in R ver. 3.6.2 [74].