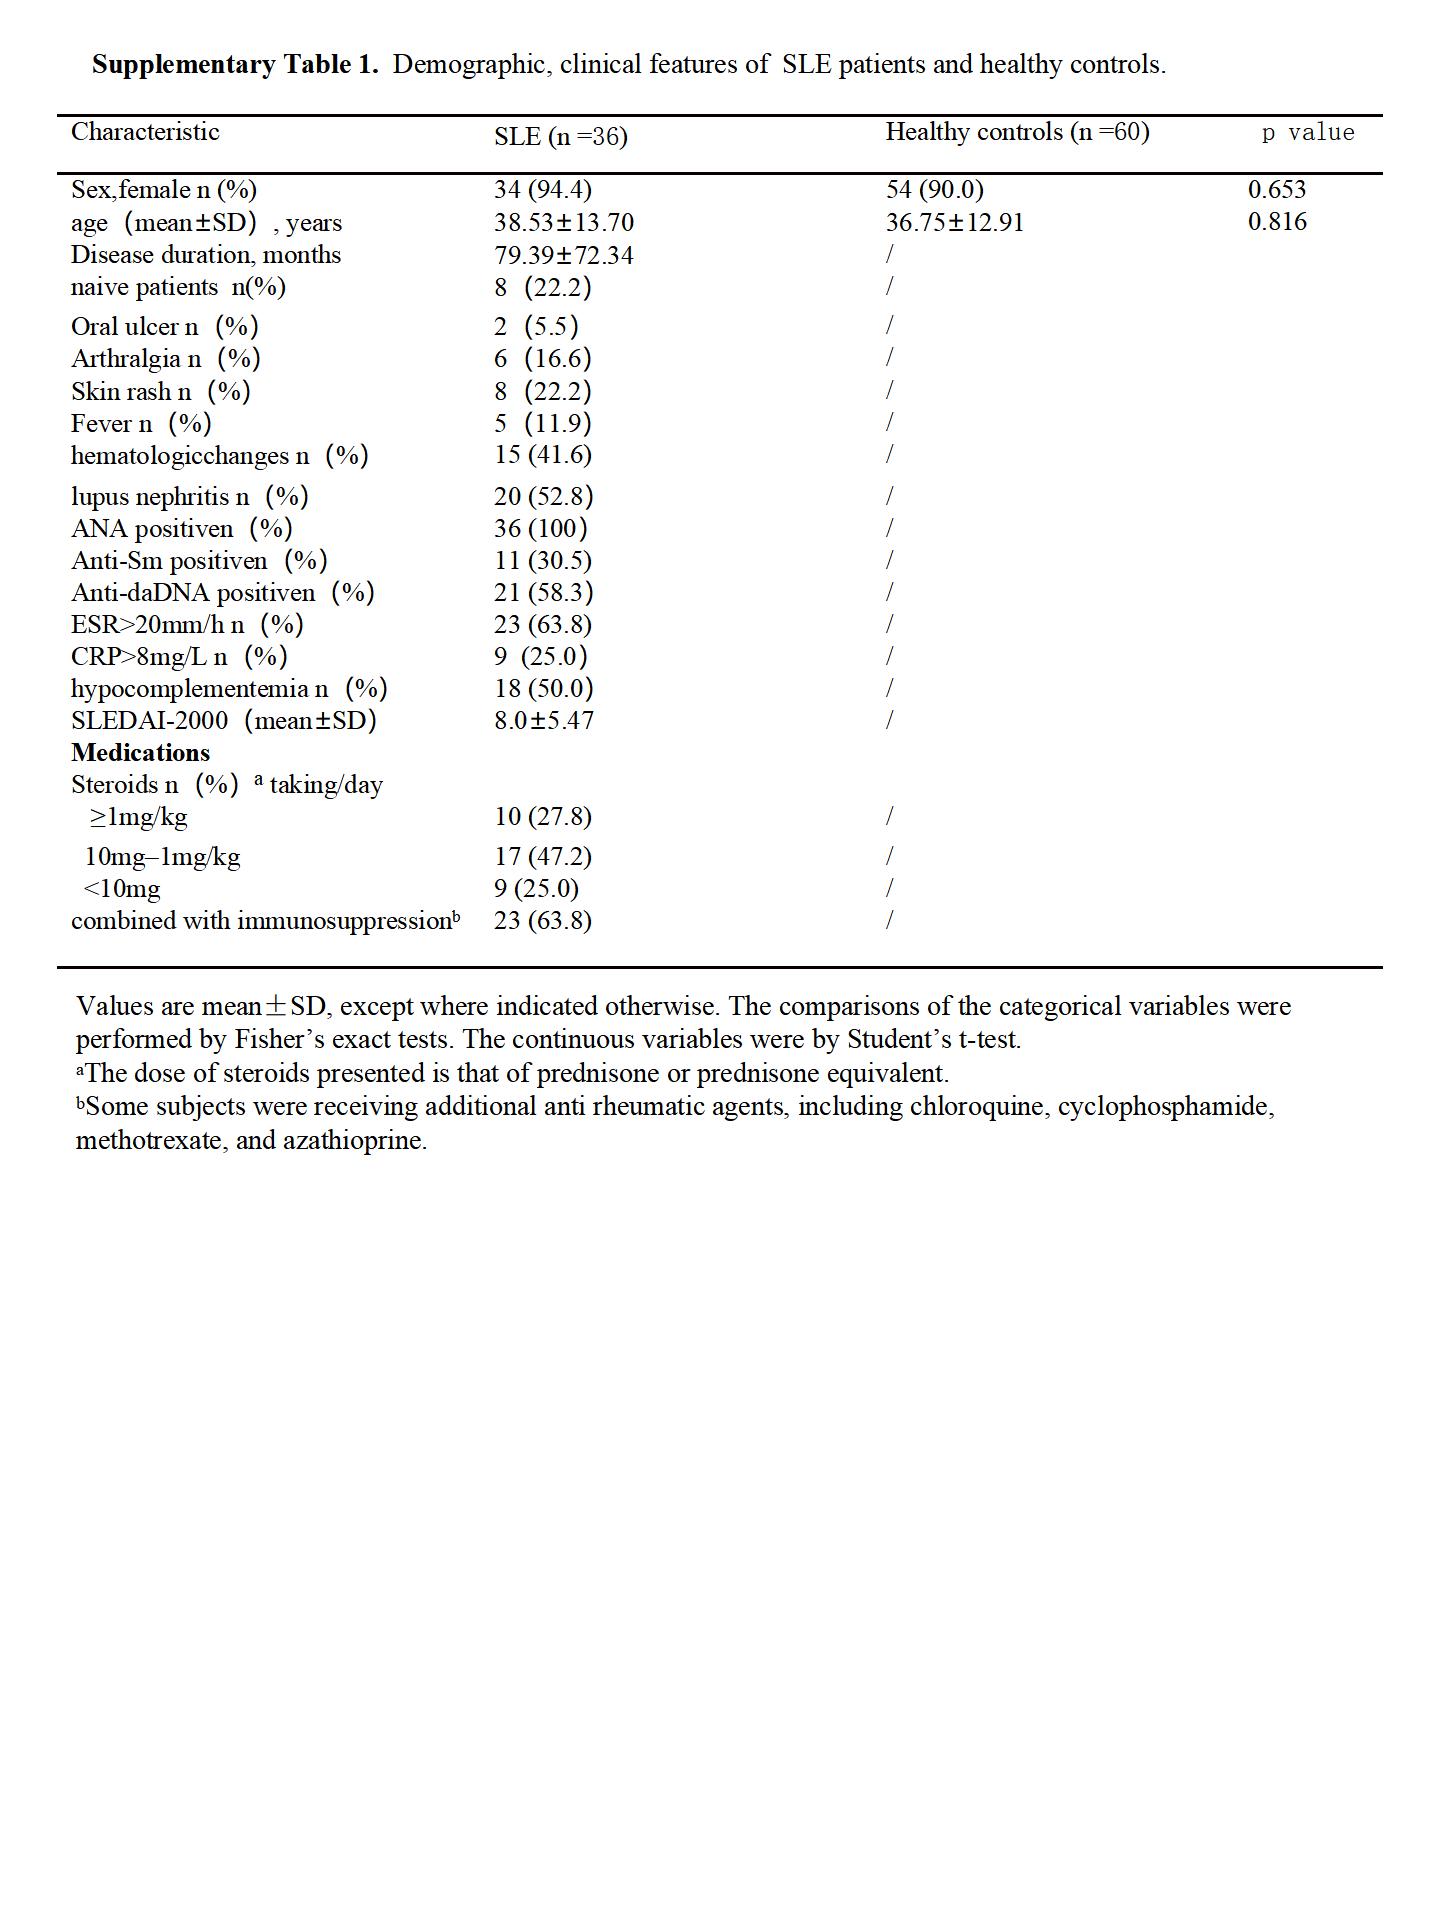
Study subjects. We enrolled 36 SLE patients admitted to the Second Affiliated Hospital of Xiamen Medical college according to the American College of Rheumatology 1997 revised criteria for SLE. Thirty age- and sex-matched healthy controls were drawn from healthy volunteers with no personal history of autoimmune disease or immunosuppressive therapy. All participants signed written informed consent for this study. The study was performed according to the current National Health and Family Planning Commission of China ethical standards and approved by the hospital ethics committee.
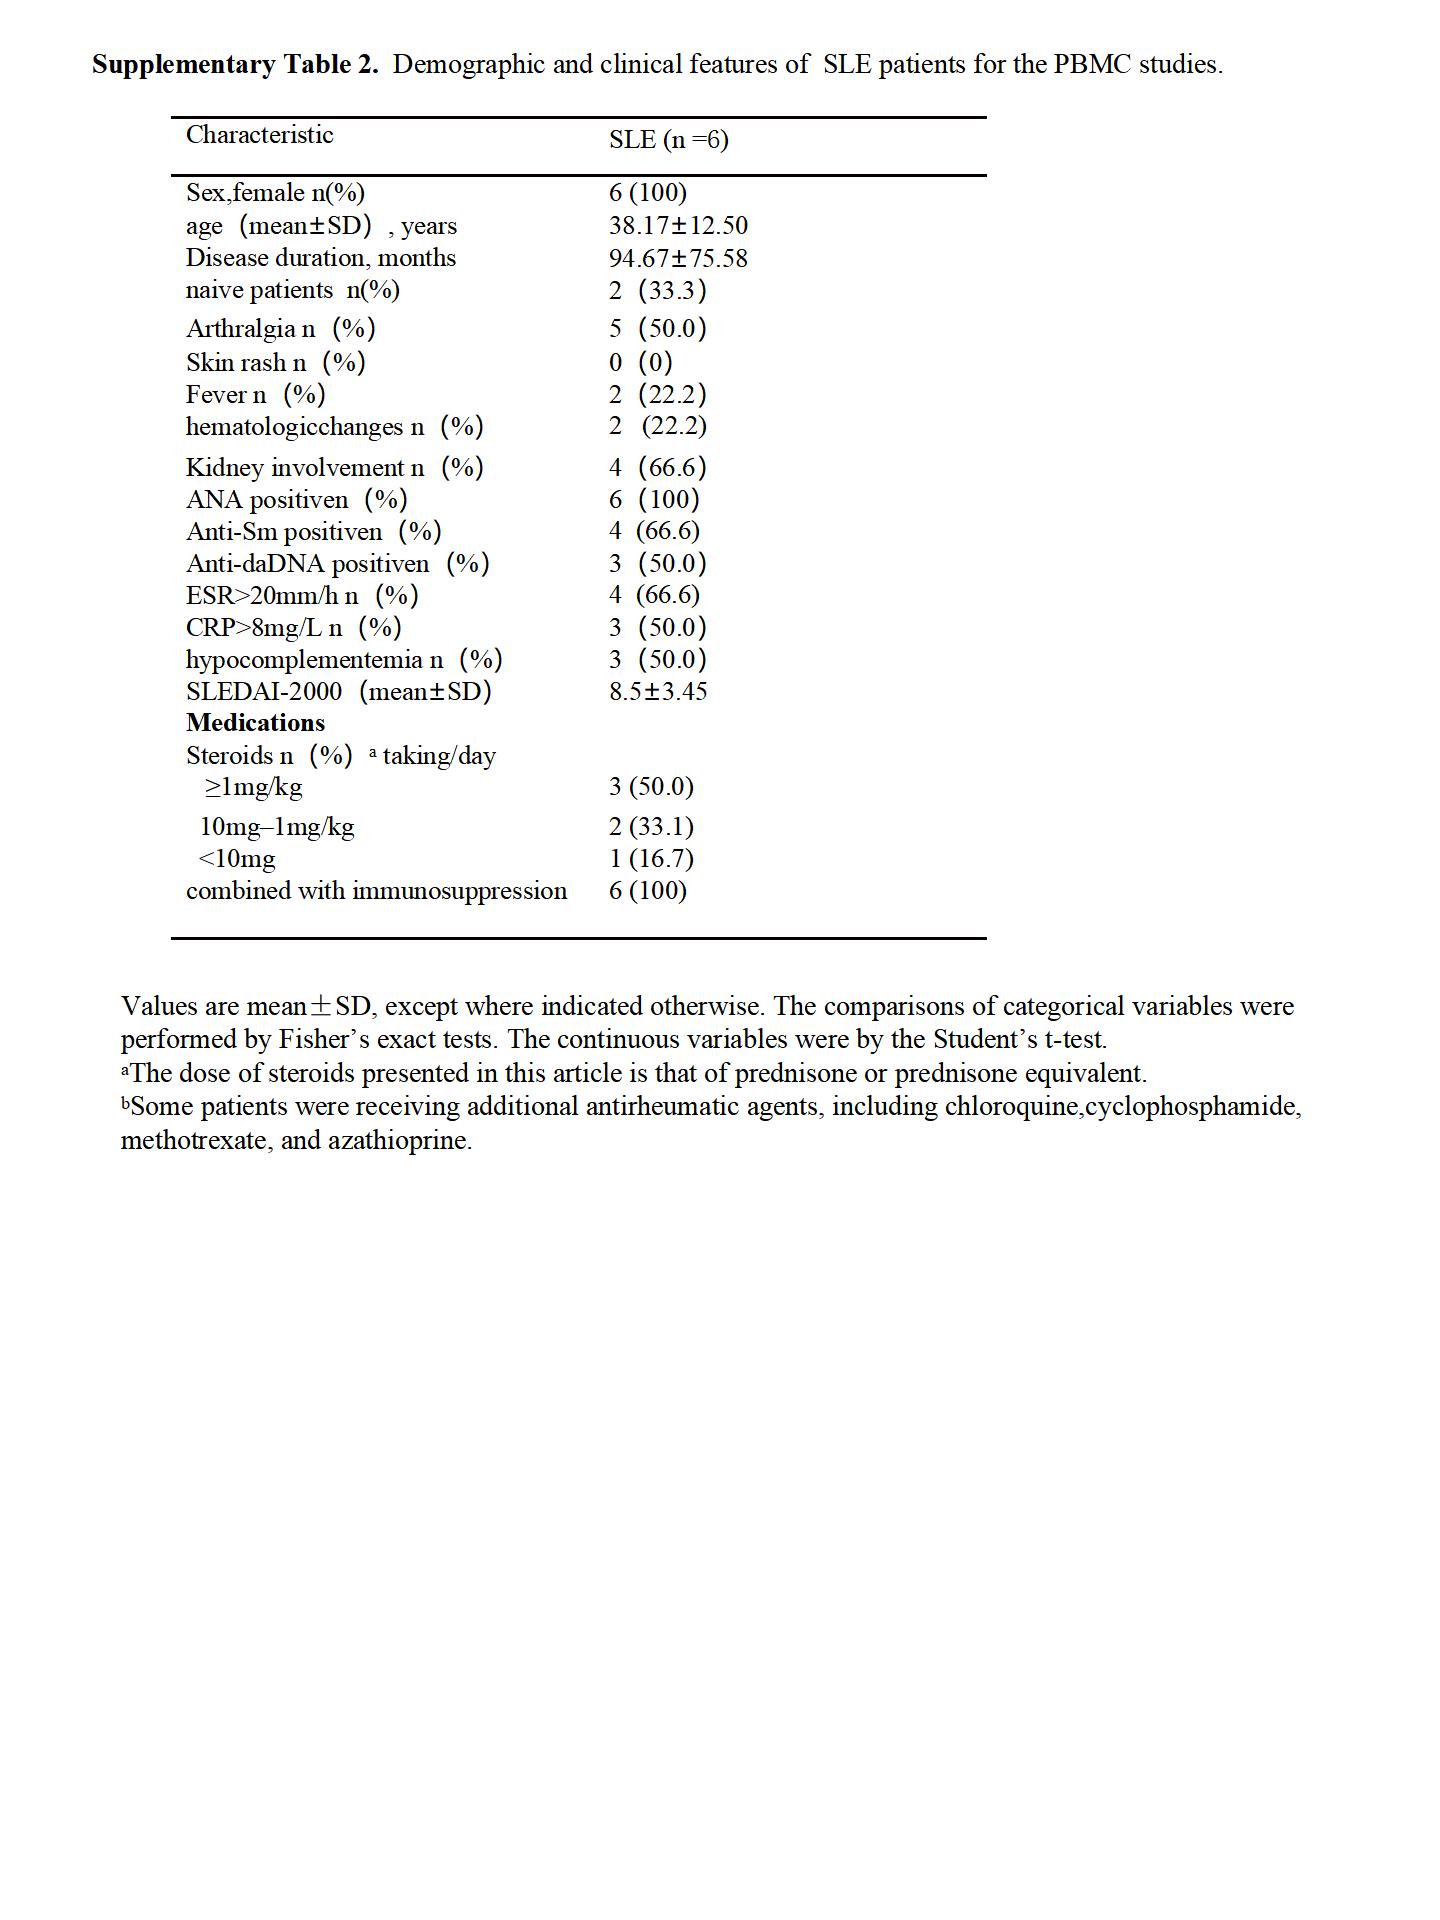
Study samples. Approximately 15–25 ml of venous blood was drawn from all study subjects into heparinized tubes and centrifuged at 2000 rpm for 10 min at 4℃ to extract plasma, which was stored at -80℃. PBMCs were isolated from heparinized blood by density-gradient centrifugation using Ficoll-Paque Plus medium (GE Healthcare) in accordance with the manufacture’s instructions.
Cells and reagents. Human THP1 monocytes or PBMCs were cultured in RPMI 1640 medium (Gibco) supplemented with 10% fetal bovine serum (FBS;Gibco) and 1% penicillin-streptomycin (Hyclone,USA in a humidified atmosphere containing 5% CO2 at 37℃. The pCMV6-RhoA plasmid overexpressing human-RhoA and pCMV6-Ctrl plasmid were purchased from ORiGENE. The two plasmids were confirmed by DNA sequencing and were prepared for transfection using an EndoFree Plasmid Maxi kit (Qiagen). The correct mRNA and protein expression of the clone plasmid were confirmed by reverse transcription-quantitative PCR (RT-qPCR) and Western blot analysis, respectively. RhoA small-interfering RNA (siRNA) sequences and siRNA Universal negative control were obtained from Sigma-Aldrich. The siRhoA sequences were: sense: 5′-CAGAUACCGAUGUUAUACU-3′ and antisense: 5′-AGUAUAACAUCGGUAUCUG-3′.
Cell Transfection and stimulation. HEK-293 and THP1 cells were transfected with siRNAs (200 nM) or plasmid (4 µg/mL) and their controls using Lipofectamine RNAiMAX or Lipofectamine 2000 reagent following the manufacturer’s recommendations (Invitrogen). At 24–48 hours after transfection,the cells were stimulated with IFN-a (1,000 units/mL or 1,000U/mL, PBL Interferon Source) for 6 hours. The RhoA/ROCK inhibitor Y27632 (30,60,90 µM, Beyotime) was added 45 minutes before stimulation with IFN-a (1,000 units/mL,PBL Interferon Source).
Dual-luciferase reporter gene assay. HEK-293T cells were cultured in a 96-well plate and co-transfected with siRhoA (200 nM) or RhoA expression plasmids (4 µg/mL), or their controls together with a mixture of Renilla vector (10 ng, Promega) and ISRE-luciferase reporter gene vector (100 ng, Clontech) for 24 hours. IFN-a(1,000 units/mL) then was added for an additional 6 hours of incubation. The cells were harvested and lysed, and luciferase activity was measured using the Dual-Luciferase Reporter Assay System (Promega) and CYTATION3 (BioTek) instrumentation. The ratio of firefly luciferase activity to Renilla luciferase activity was calculated for each well. All experiments were performed in triplicate.
RNA extraction and real-time PCR (RT–PCR). Total RNA was isolated using the RNeasy Mini kit (Qiagen). To quantify mRNA expression, complementary DNA (cDNA) was synthesized from 500 ng of total RNA with the SuperScriptIII RT Reagent kit (Invitrogen) and amplified by real-time PCR (iTaqTM Universal SYBR Greensupermix; Bio-RAD). The endogenous expression of GAPDH was used as the internal control. The relative expression levels were calculated using the 2-ΔΔCt method. All of the experiments were performed on a ViiA7 Real-Time PCR System (Applied Biosystems).
The primers for RT-PCR were as follow: for GAPDH, forward 5’-CTCCTCCTGTTCGACAGTCA-3’and reverse 5’-CAATACGACCAAATCCGTT
G-3’; for RhoA, forward 5’-TCTTCGGAATGATGAGCAC-3’and reverse 5’-CTTTG
GTCTTTGCTGAACAC-3’; for IFIT3, forward 5’ –TGAGGTCACCAAGAATTC
CCTG-3’ and reverse 5’-CAATCTGGTTACACACTCTATCTTC-3’; for OAS1, forward 5’-GAAGGCAGCTCACGAAAC-3’and reverse5’-TTCTTAAAGCATGGG
TAATTC-3’, for MX1, forward 5’-GGGTAGCCACTGGACTGA-3’and reverse 5’-AGGTGGAGCGATTCTGAG-3’.
Calculation of type I IFN scores. Type I IFN scores were calculated according to the relative expression (RE) of the type I IFN-inducible genes MX1, OAS1, IFIT3, and CXCL10. The mean ± SD level of these genes in the healthy control (hc) group (meanhc and SDhc) were used to standardize the expression levels per gene for each study subject. The type I IFN scores were calculated by summing up the individual RE of each gene after normalization to the healthy control value as follows: ∑(REsubject − Meanhc)/SDhc (23, 10). An IFN-score was regarded positive when it was higher than the mean + 2SD of HC values (11).
Enzyme-linked immunosorbent assay (ELISA). The CXCL10 concentrations of plasma samples and cell culture supernatants were analyzed by specific ELISAs (R&D Systems) in accordance with the manufacturer’s instructions.
Western blotting. HEK-293T cells were seeded into 6-well plates and 5×10⁵ HEK-293T cells per well transfected with siRhoA (200 nM) or RhoA over-expression plasmids (4 µ/mL), or their controls; 48 hours after incubation, the cells were treated with IFN-a (1,000 units/mL) for an additional 6 hours or RhoA/ROCK inhibitor Y27632 (60 µM, Beyotime ) was added for an additional 45 minutes before adding IFN-a. The cells then were harvested and lysed at different time points and subjected to sodium dodecyl sulfate-polyacrylamide gel electrophoresis and transferred onto polyvinylidene difluoride membranes for immunoblotting followed by protein detection with SuperSignal West Femto Maximum Sensitivity Substrate (Pierce). The visualized proteins were scanned and signal intensities quantified using Image J. The specified primary antibodies were directed against RhoA (Santa Cruz Biotechnology, diluted 1:200), and total and phosphorylated STAT1 and STAT2, (Proteintech, diluted 1:3000), and β-actin (Abcam, diluted 1:5000). The secondary antibodies were horseradish-peroxidase (HRP)-linked anti-mouse IgG antibody (Proteintech 1:0000), and HRP-linked anti-rabbit IgG antibody (Proteintech, diluted 1:10000).
Statistical analysis. Descriptive data were presented as mean ± standard deviations (SDs). Continuous variables were analyzed using the Student t-test or nonparametric Mann-Whitney test for comparisons of two groups. Correlations were calculated using Spearman r test. Data were analyzed with Prism 5 (GraphPad Software, Inc, San Diego, CA, USA). P values of 0.05 or less were considered statistically significant.