Cell culture
Eight human NSCLC cell lines including A549, H1299, H292, PC9, H1975, H358, H460, and 293T were obtained from the American Tissue Culture Collection (ATCC) (Manassas, VA, USA). Eight cell lines were cultured with DMEM or 1640 medium supplemented with 10% fetal bovine serum (FBS) and penicillin sodium. Cells were cultured at 37°C in a humidified incubator with 5% carbon dioxide. BSEA cells were obtained from Shanghai Cancer Institute.
Human NSCLC samples
All of the 69 pairs of human NSCLC tissues and adjacent normal lung tissues were obtained from patients who had surgery in Huashan Hospital Fudan University from 2018 to 2019. The clinical information of all cases has been shown in Table 1. Because of sample size, only 40 pairs of samples can extract protein samples other than RNA samples. All human tissues were frozen immediately and stored in liquid nitrogen. Written informed consent has been collected from each patient. All procedures were carried out in accordance with the ethical code of the Declaration of Helsinki.
Table 1
Clinicopathologic features of 40 patients with lung cancer
| Characteristics | Number of case% | PHF12 expression |
| | | Mean ± SD | P value |
| Age | | | |
| ≤ 60 | 22 (32) | 0.0060 ± 0.0060 | 0.879 |
| \(>\)60 | 47 (68) | 0.0063 ± 0.0057 | |
| Gender | | | |
| Female | 25 (36) | 0.0065 ± 0.0071 | 0.740 |
| Male | 44 (64) | 0.0060 ± 0.0049 | |
| Tumor size(cm) | | | |
| ≤ 3 | 26 (38) | 0.0065 ± 0.0077 | 0.707 |
| \(>\)3 | 43 (62) | 0.0060 ± 0.0042 | |
| Tissue | | | |
| NSCLC | 69 | 0.0062 ± 0.005 | 0.015 |
| Noncancerous | 69 | 0.0057 ± 0.0053 | |
| Clinical stage | | | |
| I + II | 54 (78) | 0.0057 ± 0.0050 | 0.271 |
| III + IV | 15 (22) | 0.0081 ± 0.0078 | |
| Metastasis | | | |
| No | 35 (51) | 0.0053 ± 0.0042 | 0.200 |
| Yes | 34 (49) | 0.0071 ± 0.0069 | |
| *P < 0.05, **P < 0.01 and ***P < 0.001. |
| The bold formatting used in the table was considered to have a significant difference. |
Western blot
Tissue Protein Extraction Reagent (Thermo Fisher, Waltham, USA) was used to extract protein from tumor tissues and cell lines. BCA Protein Assay Kit was used to measure the concentration of protein. Protein lysates were isolated with 6%-10% SDS-PAGE electrophoresis. Marker and protein blot were transferred to PVDF membrane. All membranes were sealed with 5% milk and incubated with diluted primary antibody 4°C overnight. Incubate a species-specific secondary antibody at room temperature for 1 hour before fluorescent luminescence. Antibodies used for this study were anti-PHF12 (Proteintech, 24485-1-AP, 1:1000); anti-HDAC1 (Proteintech, 10197-1-AP, 1:1000); anti-EGFR (Proteintech, 18986-1-AP, 1:500); anti-ErbB2 (Proteintech, 18299-1-AP, 1:500); anti-p-AKT (Proteintech, 66444, 1:500); anti-AKT (Proteintech, 10176-2-AP, 1:500)anti-p-mTOR(CST, 5536S, 1:500); anti-mTOR (CST, 2983S, 1:500); anti-β-actin (Proteintech, 81115-1-RR, 1:5000).
RNA extraction and real-time qPCR
TRIzol reagent was used to extract total RNA samples according to the manufacturer’s protocol. PrimeScript RT Reagent Kit from TaKaRa was used to reverse transcribe all the RNA samples. cDNA samples were used to perform Real-time qPCR using SYBR Green Premix according to the protocol. The primers used were:
PHF12: F ATCGTGTACGACTTGGACACA
R CCACCTTCCTTGCAGCTATCG
HDAC1: F CTACTACGACGGGGATGTTGG
R GAGTCATGCGGATTCGGTGAG
EGFR: F AGGCACGAGTAACAAGCTCAC
R ATGAGGACATAACCAGCCACC
ERBB2: F TGCAGGGAAACCTGGAACTC
R ACAGGGGTGGTATTGTTCAGC
β-actin: F GTCATTCCAAATATGAGATGCGT
R GCATTACATAATTACACGAAAGCA
Transient transfection and Lentivirus constructs
All si-RNA oligonucleotides for PHF12 were designed and synthesized by RiboBio (Guangzhou, China). Cells were placed at 50–60% density in 6 dishes plates and transfected by siRNAs and Lipo2000 Reagent. Si-RNA used in this study were:
Si-PHF12#1: GTGTCCGAATCACATCGAA;
Si-PHF12#2: GGACCTCCGTTGACAGATT.
Sh-PHF12, HA-PHF12 and HA-HDAC1 was cloned into the lentiviral expression vector pWPXL. 12µg Sh-PHF12, HA-PHF12 and HA-HDAC1 plasmid, 9µg psPAX2, and 3.6µg pMD2.G were transfected into 293T cells together with 60µL Lipo2000. Virus was collected after 48 hours and filtered by membrane. Cells was infected with a 1:1 ratio of culture medium to viral liquid for 48 hours.
Cell proliferation, migration, and invasion assays
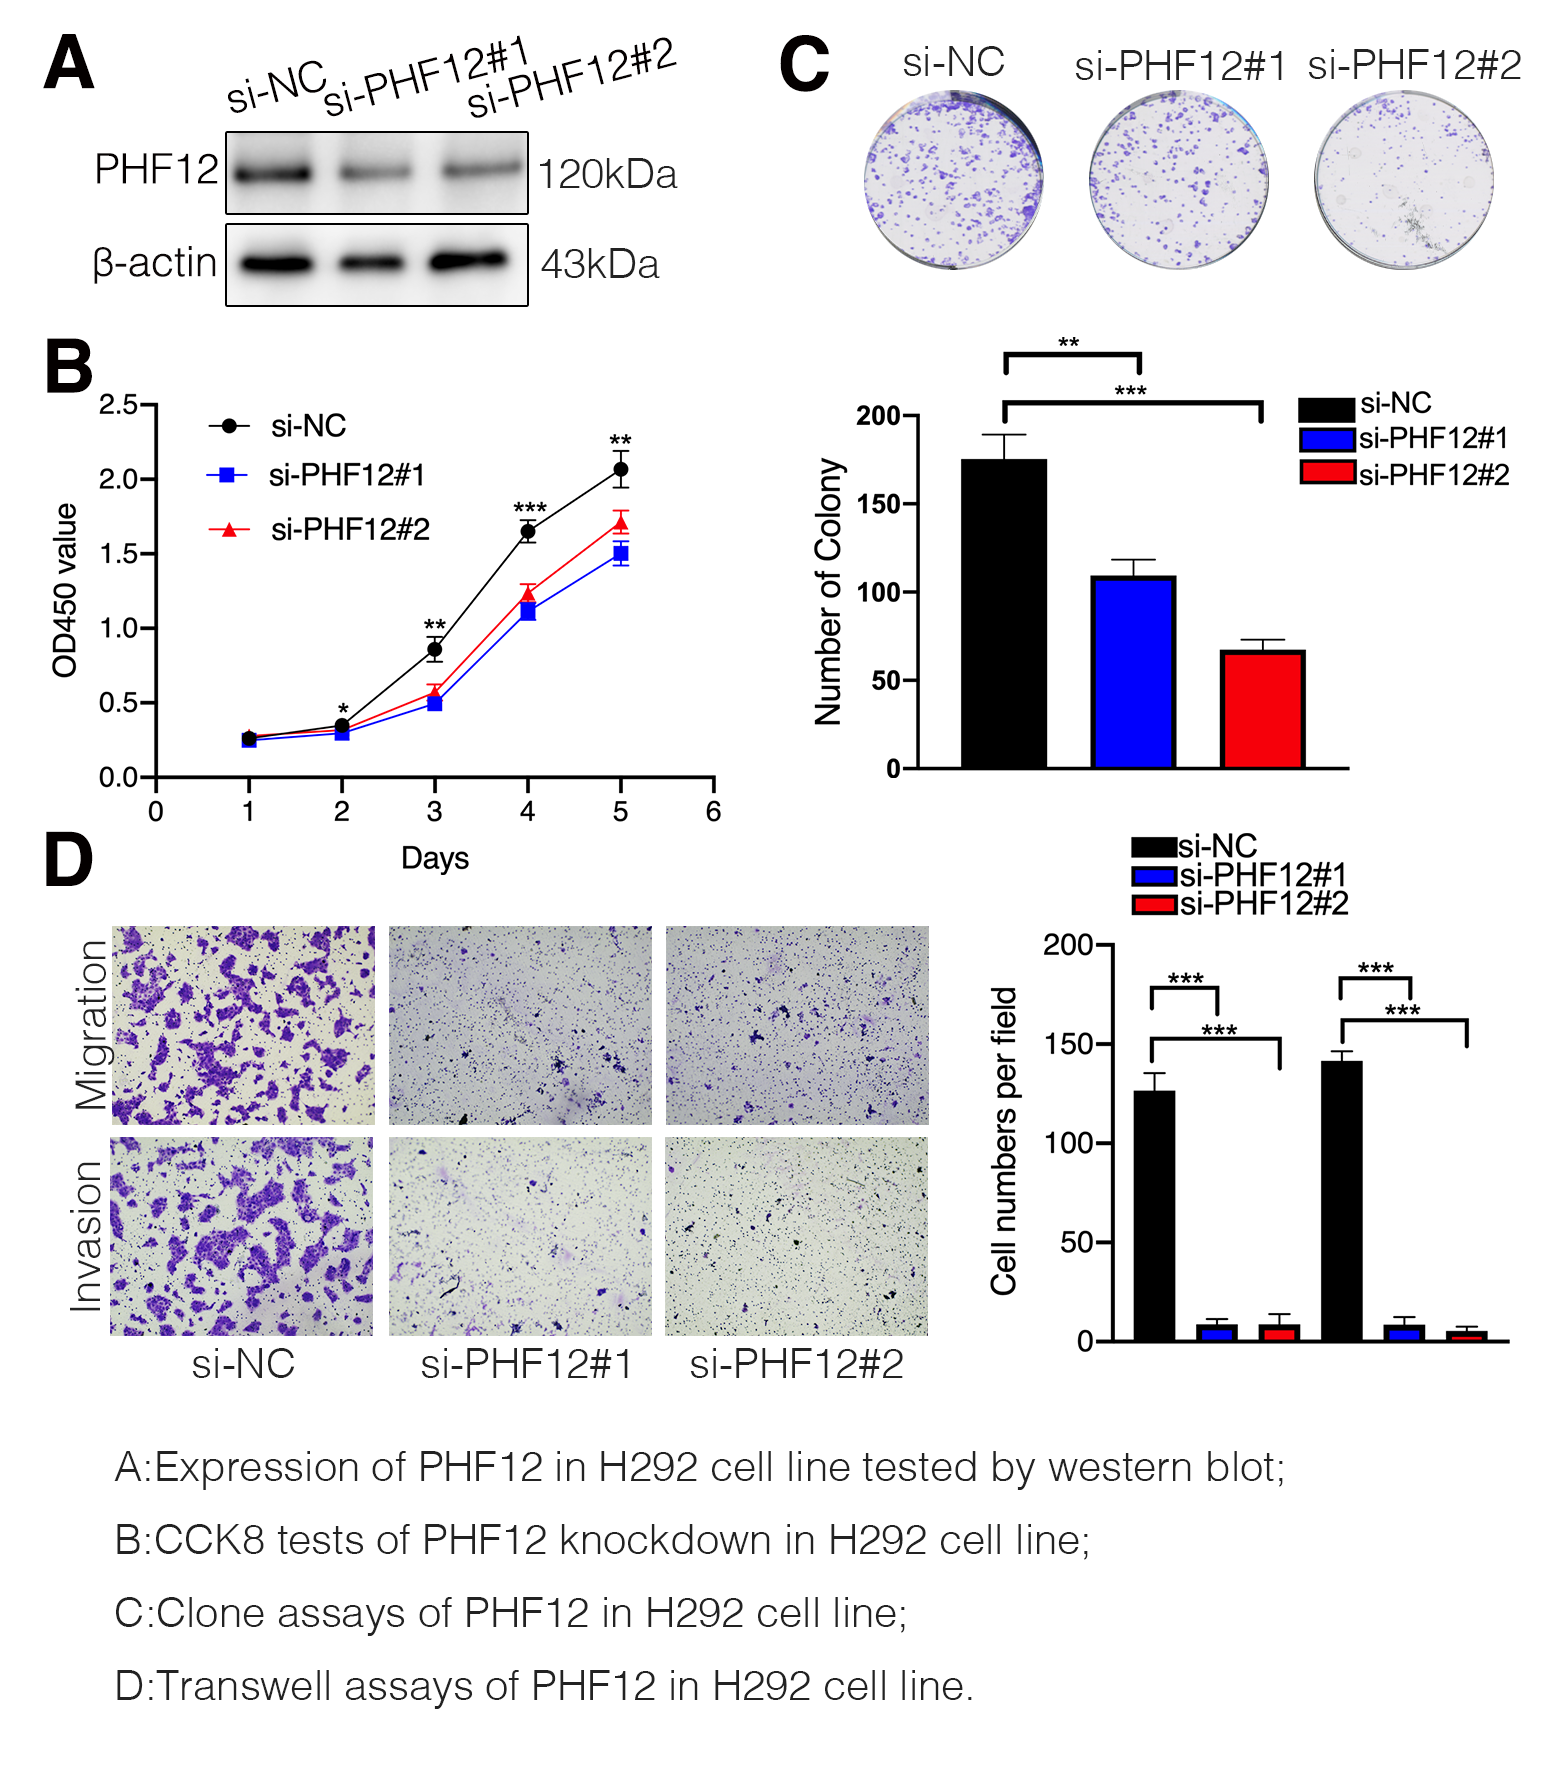
Cell proliferation is measured by CCK8 assay and Clone formation assay. Cells were plated in 6 dishes plate and transfected with si-RNAs for 48 hours. For CCK8 assay, cells were placed with a density of 800 cells per well with 200 volume culture medium. Cells should be plated with a density of 500 cells per dish. For transwell assay, 5×10⁴ cells for migration and 1×10⁵ cells for invasion were placed in the upper chamber with 200µL serum-free culture medium and 800µL culture medium with 10% FBS were added in the lower chamber. Chambers were placed at 37°C for 24 hours. Cells were fixed with methanol for 30 mins and stained with 5% crystal violet for 10 mins.
Chromatin Immunoprecipitation Assay
A549, H1299, H292 cell lines were fixed and immunoprecipitated using ChIP assay kit (Beyotime) according to the manufacturer’s protocol. The condition of ultrasonic processing to cut DNA is 10 seconds a cycle, a total of three cycles. Illumina sequencing platform PE150 mode for high throughput sequencing. Results of ChIP-seq was attached in Supplementary file 1&2.
Antibody used for immunoprecipitation is anti-PHF12 (Novus: NB100-81671, 1:100). Primers used to amplify the specific region of PHF12 is:
F: CCCATCAAGATTACCTCACGC
R: TGGAGCGCCGATGGGAG.
Immunofluorescence
A549, H1299, and H292 cells were placed in chambers with a density of 500 cells per well. All cells were fixed with 4% paraformaldehyde for 30 mins and incubated with antibody 4°C overnight. After washing with PBST for 3 times, cells were probed with species-specific secondary antibody. Anti-body used in this study was anti-PHF12 (Thermofisher, PA5-54400, 1:200).
Xenograft model
3×10⁶ A549 and PC9 cells with stable PHF12 knockdown and overexpression were transplanted in five-week-old BALB/nu nude female mice. The diameter of the tumor was measured every two days. All the BALB nude mice were sacrificed 21 days after inoculation. All experiments were subject to approval by the Animal Care and Use Committee of Shanghai Cancer Institute.
Statistical analysis
All data were collected and analyzed by Graphpad Prism version 5.0 (GraphPad Software, La Jolla, CA, USA). Comparisons between two groups should be made with student’s t-test. Kaplan-Meier was used to analyze survival curve and log-rank test. Spearman’s correlation test was used to analyze the correlations of PHF12 and HDAC1. When value of P < 0.05, it can be considered statistically significant. Every representative experiment was repeated three times.