2.1. Materials and animals
Mometasone furoate (MF), Isopropyl palmitate (IPP), Isopropyl myristate (IPM), 2,4-dinitrofluorobenzene (DNFB) were purchased from Shanghai Macklin Biochemical Co., Ltd. (Shanghai, China). N-methyl-2-pyrrolidone (NMP), Oleinic acid (OA) was purchased from Alfa Aesar (MA, USA). Maisine® CC, Labrafac™ lipophile WL 1349(LWL1349), Gelot™ 64,Labrafil®M1944CS (LM1944), Plurol®Oleique CC 497 (Polyglyceryl-3 oleate, POCC), Transcutol®P (TP), Lauroglycol®FCC (FCC) were purchased from GATTEFOSSé (Shanghai, China);HPLC grade methanol was purchased from Tianjin Concord technology Co., Ltd. (Tianjin, China); All of the reagents used in the cream were of reagent grade and obtained commercially. The structures of the MF and permeation enhancers in formulation are shown in Fig. 1.
Wistar rats (male, 200 ± 20 g), mice (male, 20 ± 2.0 g) and Japanese white rabbits (male, 2.0 ± 0.5 kg) were provided by the Experimental Animal Center of Shenyang Pharmaceutical University(Shenyang, China). All animal experiments were conducted in accordance with NIH Guidelines to Care and Use of Laboratory Animals and the Guide to animal use published by the Life Science Research Center of Shenyang Pharmaceutical University (SYPUIACUC-C2021-6-1-18).
2.2.Formulation optimization
2.2.1.Preparation of creams
The main components of the O/W cream are the oil phase, the water phase and the emulsifier. Screening of four oil phases (Maisine® CC, LWL 1349, IPP, and Cetyl alcohol) and emulsifier (Tween 80, Span 60, Gelot® 64, LM1944). The amount of emulsifier in the formulations was determined based on the hydrophilic-lipophilic balance (HLB) values, as shown in Eq. (1), where A% and B% represented the weight ratio (w/w) of the emulsifier and co-emulsifier.
HLB = HLBA × A% + HLBB × B% (1)
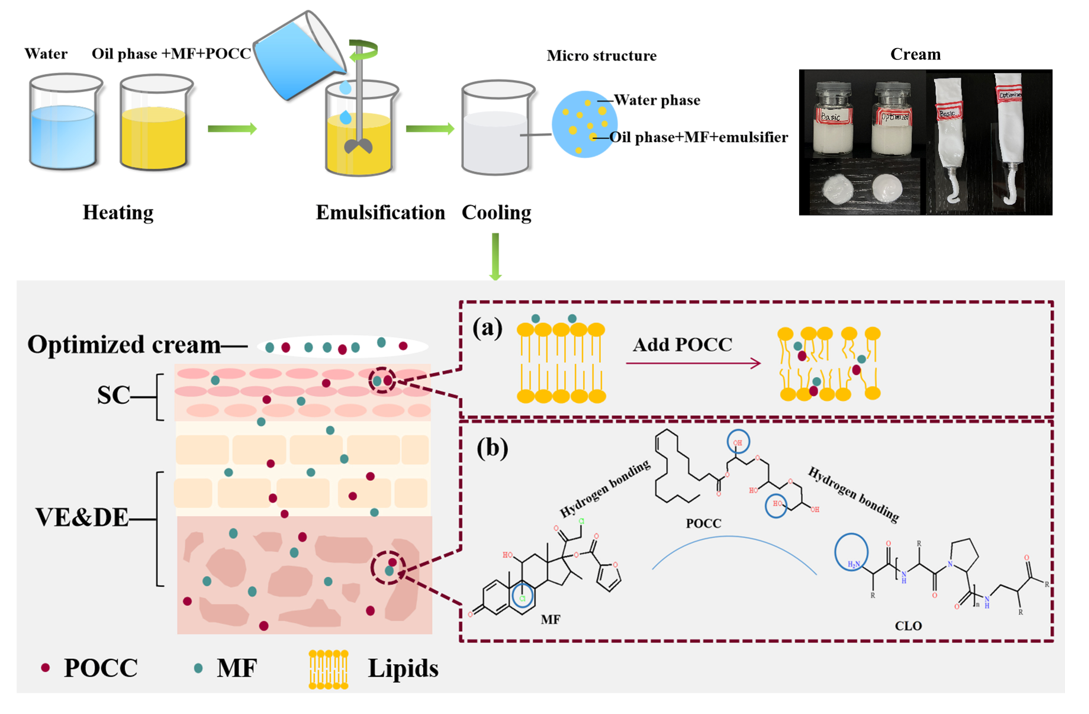
The cream was prepared using the emulsification method, following these steps: 0.05% (w/w) of MF was dissolved in NMP (The saturated solubility of MF in NMP is 6.76 mg/mL), then oil phase and emulsifier were added to the dissolved drug, melted at 75°C and stirred well. The aqueous phase included deionized water and propylene glycol mixed uniformly at 75°C. The aqueous phase was added to the oil phase of the same temperature by mixing for 5 min at 500 rpm with magnetic stirring (CJJ-6, Shanghai, China) until the primary cream was formed. Upon emulsification, the system was continued to be stirred at 500 rpm until it reached room temperature.
2.2.2. Stability study
The creams underwent a stability test to ensure their quality. Centrifugal stability experiments were performed to detect whether phase separation occurred in the cream by centrifuging 1 g of cream at 25°C for 30 min at 5000 r/min on 1 day, 7 days, 14 days, 21 days and 28 days after the preparation of the cream. Meanwhile, the prepared creams were placed at 8°C ± 2°C, 25°C ± 2°C and 40°C ± 2°C and the appearance of the creams and phase separation were observed at the same time intervals as in centrifugal experiments[10].
2.2.3. In vitro skin permeation/retention study
To compare the effects of different chemical enhancers on the transdermal absorption of MF in creams, in vitro skin permeation/retention experiments were conducted. Male rats were anesthetized with urethane (20%, w/v) and the abdominal hair was carefully shaved off using clippers and electric shavers. The entire skin from the shaved area was excised and the subcutaneous adipose tissue was removed. Microscopic examination was performed to ensure that the skin was undamaged[11]. The excised skin samples were stored at -70°C and utilized within a month.
The in vitro drug skin administration study involved skin retention and permeation studies to observe skin absorption behaviors of the drug. The experiments were conducted using Franz diffusion cells at a temperature of 32°C. The diffusion cells consisted of a donor cell and a receptor cell and were placed in an upright transdermal diffusion system. A cream formulation weighing 250 mg (containing 0.125 mg or 0.250 mg of MF) was applied to the skin, and 15% PEG 400 (4 ml) was used as the receptor fluid to maintain a sink condition. After 8 hours 1.0 ml of receptor fluid was withdrawn for analysis. At the end of the drug skin permeation/retention study, the skin was removed from the diffusion cell to collect the retained drug. The residual cream on the skin was wiped off using a water-moistened cotton swab (recovery rate > 98%). The skin diffusion area was then excised, immersed in methanol and sonicated for 30 minutes. After centrifugation for 5 minutes at 16,000 rpm, the drug content was determined using high-performance liquid chromatography (HPLC) with a C18 column (200 mm × 4.6 mm, 5µm) for sample separation. The flow rate was set at 1.0 ml/min, and the column temperature was maintained at 40°C. The mobile phase consisted of a mixture of methanol and distilled water in a ratio of 80:20.
2.2.4. Box‑Behnken Design determines optimized formulation
The Box‑Behnken Design (BBD) response surface methodology is an optimization method capable of integrated experimental design and mathematical modeling with good predictability[12]. After determining the types of excipients through stability study, Design Expert software V13.0.1.0 was employed to select the key influencing factors: IPP, POCC and PG, and determine their respective dosages. The experimental design was based on the BBD, which incorporates three levels of experiments. The dosage ranges for the three excipients are presented in Table 1. The response variable chosen for this study was the skin retention (Y) of the creams. The BBD consisted of 17 experimental runs, allowing us to develop a mathematical model that established the relationship between the independent variables (IPP, POCC, PG) and the response variable (skin retention). Through the fitting model, the formula with the highest predicted skin retention was determined. This formula was subsequently verified through the "in vitro skin permeation/retention study" to confirm the optimized formulation.
Table 1
Variables and Levels in the Box-Behnken Design
| Independent variables | Levels |
| Units | Low | High |
| IPP-A | % | 3 | 5 |
| POCC-B | % | 5 | 10 |
| PG-C | % | 2 | 5 |
| Dependent variables | Low | High | Objective |
| Skin retention-Y | 0 | 100 | Maximize |
2.3. Formulation evaluation
2.3.1. Macro and micro structure
The creams were subjected to macroscopic observation to assess their overall appearance. Additionally, microscopic observation was performed using optical microscopy (XSP-2CA, Shanghai). To facilitate the examination, the samples were appropriately diluted. To simulate the actual conditions during the in vitro permeation/retention study, the creams used in this particular section were aged for 24 h prior to examination.
2.3.2. Particle size measurement
Approximately 1 g of the cream was added to 100 ml of water for pre-dispersion. Using a Malvern Laser Particle Size Analyzer (Mastersizer 2000MU), the pre-dispersed sample was added to the cuvette with a shade of approximately 10%-15% and the test was averaged over three times.
2.3.3. Rheology
A rheological investigation was conducted to characterize the cream's fluidity using an AR 2000 rheometer from TA Instruments (USA). A 0.5 g sample of the MF cream was applied to a parallel-plate geometry with a diameter of 20 mm. Prior to the rheological analysis, a 2-minute equilibration period was employed to eliminate potential factors that could influence the test results[13].
Oscillation strain sweep: The cream was subjected to varying shear strain ranging from 0.01–100% at a frequency of 1 rad/s to identify its linear viscoelastic region (LVR). The values of the storage modulus (G') and loss modulus (G") were then utilized to assess the cream's viscoelastic properties.
The steady flow behavior: In order to examine the flow characteristics of the different creams under controlled shear conditions, a shear rate range of 0.01–100 s− 1 was selected and all samples were subjected to this specific test condition for data acquisition.
Thixotropy test: The shear rate is systematically increased from 0 to 20 s− 1 and subsequently decreased back to 0, allowing for the measurement of shear stress changes corresponding to the rate. These measurements generate a closed curve referred to as the thixotropic loop or thixotropic ring. This curve can be served as an indicator of the cream's thixotropic behavior.
2.3.4 Skin irritation experiment
The skin irritation experiment was performed on the abdomen of male rabbits[14]. The abdominal hair of the rabbits was shaved 12 h prior to dosing to ensure the integrity of the skin. Four groups were designed: the basic formulation group, the optimized formulation group, acutely broken skin group (sandpapered the skin and applied the optimized formulation after bleeding spots appeared) and positive control group (0.5 ml of 10% SDS applied for 8 h). 0.5g of cream was taken and applied to the skin, covered with gauze and fixed with tape. Photographs were taken 1h and 8h after administration and 0h, 24h and 48h after wiping with warm water.
2.4. In vivo tissue distribution study
The in vivo tissue distribution experiment was conducted to validate the findings from the in vitro experiment. The abdominal hair of male Kunming mice (20 g ± 2 g) was removed 24 h in advance, provided by the Experimental Animal Center of Shenyang Pharmaceutical University. The cream (250mg) was applied to the skin with an area of 1.77 cm2 and blood samples (0.5ml) were collected at 1, 2, 3, 5, 8, 12, 16, 24, 32, 48 h[15], that the remaining creams were wiped clean at 8 h. After the designated time points, the mice were euthanized, and the skin and muscle at the administration site were collected. The detection method of drug concentration in tissue was consistent with that in the in vitro test. And the plasma was treated as follows: the samples were centrifuged at 16,000 rpm for 5 min at 15°C. Then, internal standard (clascoterone, 100ng/ml, 10µl) and plasma (100µl) were eddied for 20 s. The extractant ethyl acetate (1ml) was added to the mixture and mixed for 3 min, then centrifuged for 5 min at -5°C, 16,000 rpm. The extraction solution was subsequently evaporated by nitrogen stream at 40 ± 1°C to dry. Finally, the mobile phase was added (200µl) to dissolve, eddied for 3 min, centrifuged at -5°C for 5 min and took supernatant to determine drug concentration. The supernatant was collected for LC-MS/MS analysis, which consisted of an Agilent 1290 Infinity II UHPLC system (Agilent Technology, Santa Clara, CA, USA) equipped with an AB Sciex API TRIPLE QUADTM 4500 mass spectrometer (Sciex, Framingham, MA, USA). For chromatography, a reversed-phase column (Waters Poroshell UPLC EC C18, 1.9µm, 2.1 × 50 mm) was used. The mobile phase was methanol: water (0.3% formic acid) = 80: 20 (v/v) with a flow rate of 0.3 ml/min. The column temperature was kept at 30°C.
2.5. Establishment of chronic atopic dermatitis model in mice
A mouse model of chronic atopic dermatitis was established through DNFB-induced sensitization to assess the effectiveness of the formulation[16].To establish the model, the abdominal region of the mice was shaved 24 hours prior to the experiment. On the first day, 100µl of a 7% DNFB acetone-olive oil solution was applied to the abdomen for sensitization. Subsequently, on the 5、8、11 and 14 days of the experiment, 20µl of a 0.5% DNFB solution was uniformly applied multiple times to the inner and outer surfaces of the right ear to induce excitation. The control group received an application of acetone-olive oil solution (4:1) on the abdomen and ears. Drug treatment commenced 24 hours after the final excitation, with the positive control group not receiving any treatment. The treatment groups included the Elocon® cream group, the basic formulation group and the optimized formulation group (n = 6). Each group received a daily application of 0.1 g of the respective cream, with the inner and outer surfaces of the right ear being gently rubbed using a glass rod for approximately 5s until the 3rd day after the final excitation. At the conclusion of the experiment, the mice were euthanized, and the middle section of the right and left ears were obtained using a 6 mm punch. The weight difference between the two ears was measured and the right ear was collected for histopathological examination after hematoxylin and eosin (H&E) staining.
2.6. Enhancement action mechanism characterization
To be effective, the drug contained in the cream must first be released from the matrix and then penetrate the skin to exert its pharmacological effect. This study comprehensively investigated the molecular mechanisms underlying the incorporation of POCC for the release of MF and its retention in the skin, through the application of in vitro release study, rheology, molecular modeling, tape stripping study, CLSM, ATR-FTIR, SAXS and molecular docking characterization.
2.6.1. In vitro release study
To investigate the impact of POCC addition on the drug release behavior of MF, drug release experiments were carried out through the diffusion cell mentioned previously. Instead of using skin, a semipermeable membrane known as Cellophane® was employed as a substitute. The 0.25g cream was applied onto the Cellophane® membrane, and samples (1.0ml) were collected at specific time points (0.5,1, 2, 4, 6, 8 h). To maintain a sink condition, an equal volume of fresh 30% ethanol was immediately added to the cells after each collection[17]. The determination of drug concentration in the collected samples followed the same protocol as the "In vitro skin permeation/retention study."
2.6.2. Molecular modeling
The molecular modeling study was conducted using Materials Studio software (version 7.0, Accelrys Inc., San Diego, CA, USA) to obtain molecular-level insights into the interactions between MF, POCC and IPP, as well as their correlation with the rheological properties of the creams. Firstly, all structures were geometrically optimized by Forcite module. Molecular docking was then performed in Blends module and atom-based geometric optimization was performed using COMPASS II force field. According to the principle of molecular dynamics, the cube box simulation system of drug and PSA was constructed by using Amorphous Cell module according to the optimized formula ratio[18].
Subsequently, the 30ps NVT balance was performed for each system. Then the 300ps molecular dynamics simulations of various systems in NPT were carried out at 305k and 101kPa, and the equilibrium structures were obtained. Finally, cohesive energy density (CED) and mean square displacement (MSD) were obtained. And diffusion coefficient (D') was calculated by Eq. (2), the Einstein’s Eq.:
$${D}^{{\prime }}=\frac{1}{2t}\underset{t\to \infty }{\text{lim}}⟨{\left[z\left(t\right)-z\left(0\right)\right]}^{2}⟩$$
2
Where t is time, and z (0) and z(t) are the z components of the particle positions at times 0 ps and t ps, respectively. D' was one-sixth of the slope of MSD - t curve in molecular dynamics simulations.
2.6.3. Tape stripping study
The tape stripping test was employed to investigate the distribution of MF within the stratum corneum (SC), viable epidermis and dermis (VE&DE). After an 8 h in vitro permeation/retention experiment, the skin was subjected to 10 consecutive tape stripping procedures using adhesive tapes to collect the retained amounts of MF in the SC and VE&DE layers, respectively[19]. The analysis of MF was conducted following the same method as the "In vitro skin permeation/retention study."
2.6.4. CLSM
CLSM was utilized to visualize the skin enhancement effect of POCC. The fluorescents probe FITC was used in this study. FITC shares structural similarities with MF, possessing carbonyl groups at the C3 position, and serves as the pharmacodynamic group of MF[4]. The FITC and POCC were added into ethanol, sonicated for 30 mins then centrifuged and the supernatants were used as donor solutions. FITC in ethanol without POCC was used as a control group. The obtained solution was added to the skin for 1 h. Afterward, the skin was washed with distilled water and dried with filter paper to remove the excess solution on its surface. The skin sample was directly sandwiched between a coverslip and a glass slide. CLSM analysis was performed with a LSM 710 Laser Scan Microscope (Carl Zeiss AG, Jena, Germany). FITC was excited at 488nm wavelength using an argon laser (FITC excitation 495nm, emission 521nm)[20]. Depth scans were conducted at 5µm intervals, reaching a maximum depth of 30µm.
2.6.5. ATR‑FTIR spectra
ATR-FTIR was conducted to examine the lateral organization and conformational ordering of skin lipids[21]. Four samples were studied: i) ethanol (EtOH); ii) EtOH with 0.05% MF; iii) EtOH with 10% POCC; iv) EtOH with 0.05% MF and 10% POCC. The control group consisted of skin treated with EtOH alone. The samples were added to the skin and left for 8h. Then, the skin surface was wiped with cotton. The whole skin and the VE&DE layer remaining after tape stripping were placed facing zinc selenide (ZnSe) crystals. The ATR-FTIR spectra were collected from instruments (Bruker, Ettlingrn, Germany) equipped with an ATR tool and MCT detectors in the frequency range of 4000 − 700 cm− 1.
2.6.6. Small‑angle X‑ray scattering (SAXS) spectra
Small-angle X-ray scattering (SAXS) was employed to investigate the structural changes in skin components, including lipids and proteins. SC samples were treated with a pH 7.4 phosphate buffer solution containing 10% (w/v) trypsin at 37°C. After 24h, each layer of skin was separated with tweezers, the SC layer was washed with deionized water, and the separated skin tissue was wiped with cotton before vacuum drying. Before the experiment, the SC layer was soaked in i) EtOH and ii) EtOH with 10% POCC solutions at room temperature for 8h, and then, the solvent was dried to obtain skin samples. The X-ray diffraction used an imaging plate system (R-Axis IV; Anton Pal, Austria), and the beam was the BL40B2 (Structural Biology II BeamLine) of Spring-8 (Anton Paar, Austria). The X-ray imaging plate area was 30 mm × 30 mm, the wavelength was 0.0709 nm, and the exposure time was 900 s. The reciprocal spacing (S = (2/λ) × sin θ) was calibrated from the lattice spacing of silver benzoate at room temperature (d = 5.838 nm, where d is the layered repetition distance), where 2θ is the scattering Angle [22]. Photon counting was performed at 1152 pixels in the range of S = 0.05–0.2 nm− 1 to determine the number of photons at each pixel.
2.6.7. Molecular docking
Molecular interactions between MF, POCC and skin/body fluids were studied by molecular docking. The collagen (COL) molecule was used as a model for the viable epidermis and dermis (VE&DE), while water (H2O) represented the body fluids. Key molecular parameters, such as the interaction parameter (χ) and the mixing energy (Emix), were calculated to provide insights into the MF-POCC-skin/body fluids interactions at a molecular level.