Data:
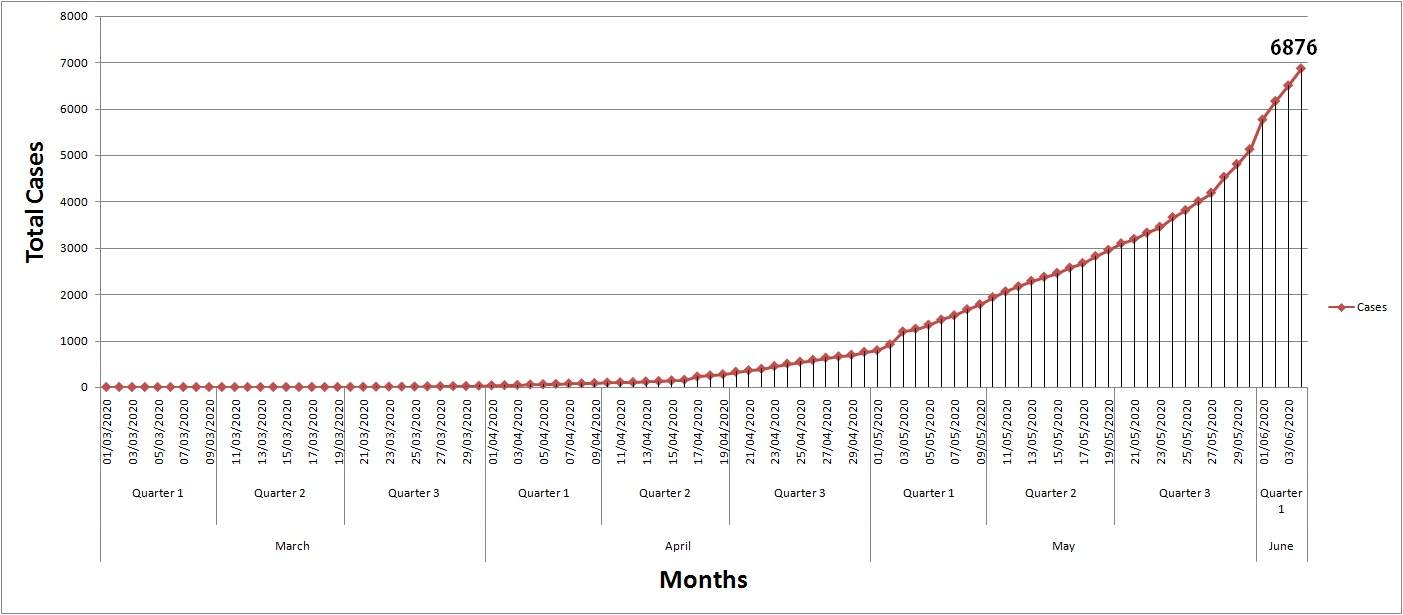
For our study, the required data of daily total confirmed cases and total active cases of COVID–19 infection collected for India as well as its state West Bengal from the (https://www.covid19india.org/), and excel of the patient database is used to build a time-series database for confirmed and active cases Using the Data Science Software called R. In this study, forecasting is done based on the data from March 1, 2020, to June 4 2020. This data is being used to build Forecast which includes all the Statistics and Graphs for mentioned model.
Methodology:
In the past few months, an increasing number of research related to forecasting the trend of pandemic COVID–19 cases are being published using different approaches in various part of the world. (Gupta and Pal 2020; Fanelli and Piazza 2020; Giordano et al. 2020; Tandon et al., 2020; Kumar et al. 2020; Benvenuto et al. 2020; Batista, 2020). The ARIMA model is one of them and nowadays used for forecasting case count for the prediction of epidemic diseases based on the time series modeling (Rios et al. 2000; Li et al. 2012; Zhang et al. 2014; Benvenuto et al., 2020).
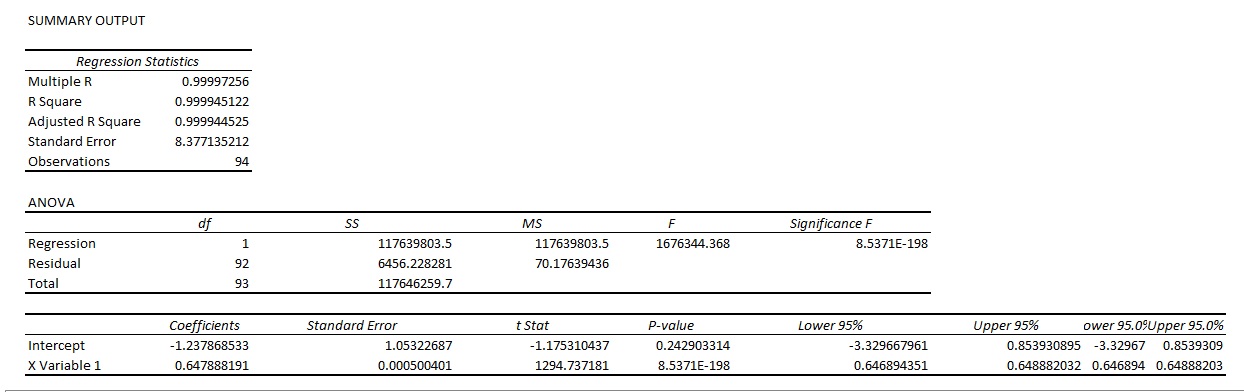
In this study, the well-known Autoregressive Integrated Moving Average (ARIMA) time-series model used for the further forecasting purpose. ARIMA model is one of the generalized forms of an autoregressive moving average (ARMA) model among the time series forecasting. We fit both models to understand the data better or to predict future points in the series (Forecasting). ARIMA model depends or always represented with the help of some parameters, and the model has expressed as ARIMA (p, d, q): p, d and q are non-negative integers.
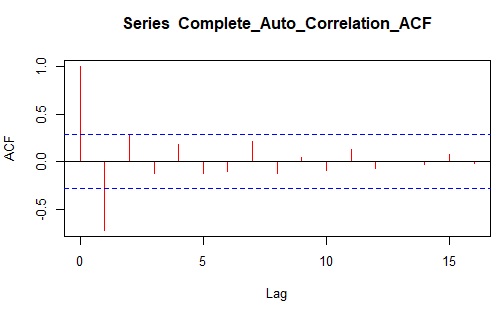
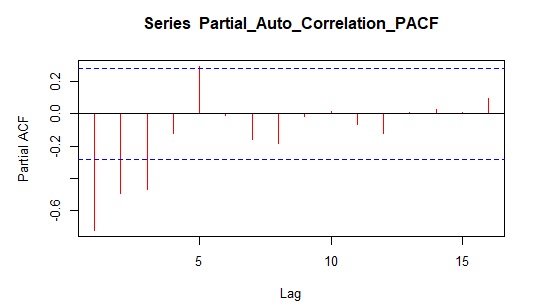
The parameters have their usual meaning, here, p stands for the order of auto-regression, d represents the degree of trend difference (the number of times the data have had past values subtracted) for the stationary of the trend and q signifies the order of moving average. This model combines auto regression lags under the stationary trend and moving average and predict better future values based on past and recent data. For this model, the degree of parameters p, d and q determine based on the partial Auto- correlation function (PACF) graph, The Augmented Dickey-Fuller Test to test the stationary of the time series observations and Complete Auto-Correlation Function (ACF) graph respectively (Forecasting COVID–19 cases in India)
We have applied the ARIMA model and Auto ARIMA model using R, to our considered time series data of COVID–19 cases in West Bengal for the forecasting the total confirmed and active cases for West Bengal and its majorly affected Districts. We selected Districts based on the criterion that chosen Districts should have at least 2 confirmed cases till June 2nd 2020. By using this selection criterion, West Bengal and its 24 Districts Alipurduar, Bankura, Birbhum, Cooch Behar,
Dakshin Dinajpur (South Dinajpur), Darjeeling, Hooghly, Howrah, Jalpaiguri, Jhargram, Kalimpong, Kolkata,Malda, Murshidabad, Nadia, North 24 Parganas, Paschim Medinipur (West Medinipur), Paschim (West) Burdwan (Bardhaman), Purba Burdwan (Bardhaman),
Purba Medinipur (East Medinipur), Purulia, South 24 Parganas, Uttar Dinajpur (North Dinajpur),
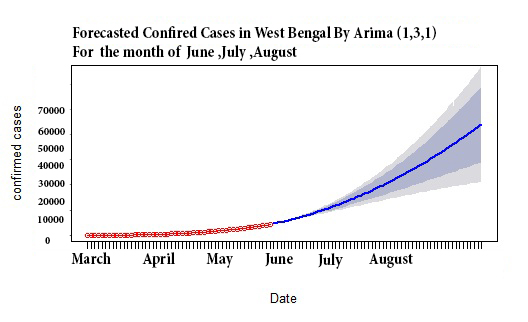
The cases are forecasted under the assumption that people will be maintaining condition similar to the partial lockdown situation and maintain physical distancing with self quarantine. After fitting the model, the built model is used to forecast confirmed and active cases COVID–19 cases for the next 80 days, i.e. from June 6rd, 2020, to August 3rd 2020.
The model for forecasting future confirmed and active cases of COVID–19 cases is represented as,
𝐴𝑅𝐼𝑀A (𝑝, d, q): 𝑋𝑡 = 𝛼1 𝑋𝑡 −1+𝛼2 𝑋𝑡 −2+𝛽1𝑍𝑡−1+𝛽2 𝑍𝑡 −2+ 𝑍t(i)
Where, 𝑍𝑡 = 𝑋𝑡−𝑋𝑡−1(ii)
Here, Xt is the predicted number of confirmed and active COVID–19 cases at tth day; α1, α2, β1 and β2 are parameters whereas Zt is the residual term for tth day.
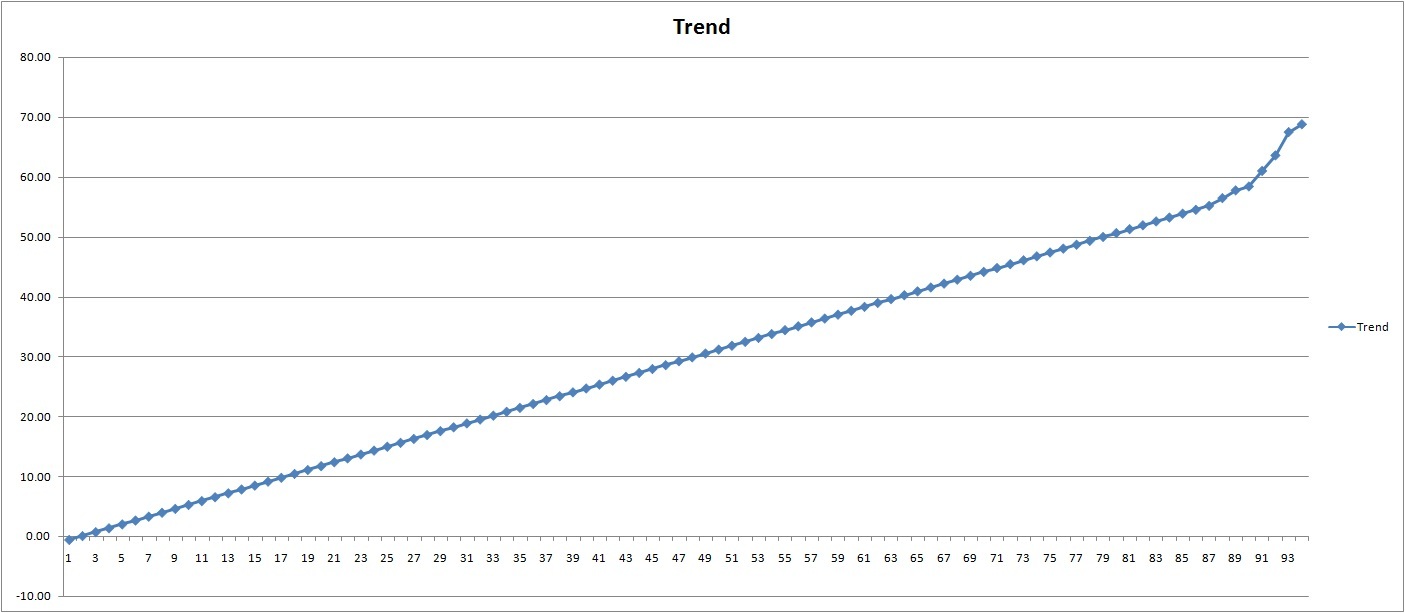
The trend of forthcoming incidences can be estimated from the previous cases, and a time series analysis is performed for this purpose
(Tandon et. al., 2020).
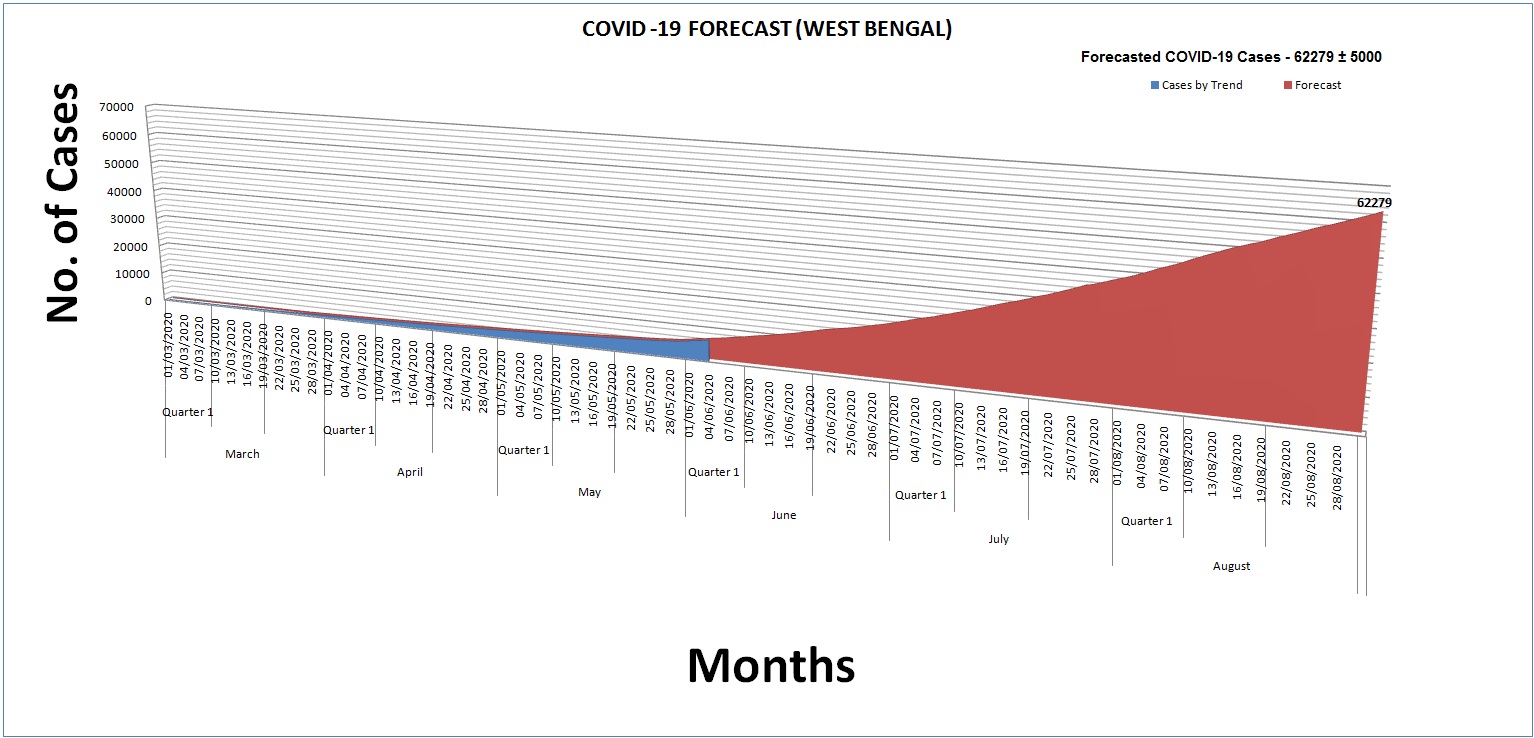
In our study, the forecasted cases are mainly used for preparing the government of West Bengal for the health infrastructure such as the number of isolation beds, ICU beds and ventilators, Quarantine centers etc. across the State. In further analysis, based on predicted active cases, we estimated the hike in number of cases by COVID–19 patients in the coming days. Based on this theory we can maximize the requirement of Quarantine centers, Alcohol based Sanitizers, Public sanitizing materials, ICUs and ventilators as the infection hit its peak, which the state may get in the month of July-August according to the forecast.
Our health infrastructure requirement is estimated based on the active cases as our projections are made on the basis on data till June 2nd when our country was observing the complete lockdown and starting of Lookdown 5.0. However, India is observing partial lockdown in Containment Zones currently and has removed lockdown in the Red, Yellow & Green Zones, so for being prudent, we will estimate the amount of active cases which are to be increased and also look into the Public Health Infrastructure of West Bengal.