Cdot(N) Characterization
Figure 7 shows the HR-TEM micrographs of oleylamine and Cdot(N) with different magnitudes. As shown in Fig. 6a, oleylamine is an agglomerate (size larger than 50 nm) and doesn't present a crystalline structure. Figure 7b shows that Cdot(N) has a small length of about 10 nm and gives an interplane space value of around 0.36, 0.29, and 0.25 nm, associated with different graphitic structure formations (McAllister et al. 2007; Lee et al. 2012). These changes in structure prove Cdot(N) formation from oleylamine.
Figure 8 shows the Raman spectra of the Cdot(N) and oleylamine. The Cdot(N) spectrum shows 1360 and 1600 cm-1 peaks related to the D and G bands (Ferrari and Robertson). The D band refers to the linkage of the C-C (sp3 hybridized carbon), and the G band refers to the C-C (sp2 hybridized carbon) link. The results agree with HR-TEM micrographs and conclude that graphitic carbon quantum dots have been obtained. The peaks at 973 cm-1 can be assigned to cis–CH deformations, a shoulder around 1260 cm-1 can be related to cis–CH symmetric rock, the peak around 1440 cm-1 can be ascribed to CH2 scissoring, and a strong peak at 1650 cm-1 with a tailing around 1670 can be related to cis– and trans–C = C stretches of oleylamine present in Cdot(N) structure (Baranov et al. 2019).
Characterization of Modified Membrane
HR-TEM and SEM.
The SiO2/Cdot(N)-MASI nanostructure synthesized in situ onto the Nylon membrane was analyzed by HR-TEM. SiO2/Cdot(N)/TiO2-MASIT and SiO2/Cdot(N)/TiO2-MASITp were analyzed by SEM coupled with the EDS probe. Figure 9 shows HR-TEM microscopy of SiO2/Cdot(N)-MASI in different magnitudes. As can be seen, the presence of regions with different colors indicates that the Cdot(N) was entirely encapsulated by the silica higher order structure, proving the SiO2/Cdot(N)-MASI nanostructure formation onto the nylon membrane. HR-TEM microscopy of SiO2/Cdot(N)/TiO2-MASIT and SiO2/Cdot(N)/TiO2-MASITp were the same as the HR-TEM microscopy of SiO2/Cdot(N)-MASI due small percentage of titanium (0.25, 0.5 and 1%). So, to prove the insertion of titanium in the SiO2/Cdot(N)/TiO2-MASIT and SiO2/Cdot(N)/TiO2-MASITp were performed of SEM, EDS and mapping of Si, C, and Ti of nanostructures formed onto the nylon membrane (Fig. 9). Figure 9 presents the results for a MASI membrane produced without a previous polymerization step. It is noteworthy to point out that titanium islands were formed. On the other hand, Fig. 10 presents the results from a pre-polymerization route, the SiO2/Cdot(N)/TiO2-MASITp. The elemental mapping shows a much more homogeneous distribution, probably due to better interaction between Cdot(N) and other species.
The FTIR spectrum of the nylon membrane (Fig. 12a) shows a band at 1473, 1415, 1371, 1278, 1197, 933, and 690 cm-1, which are related to a nylon membrane [27]. The FTIR spectra of MASI and MASITp membranes (Fig. 12b,c,d) show three peaks related to Si-O-Si bonds vibrational modes, around 1152 and 1072 cm -1 (BERTOLUZZA et al. 1982; Wang et al. 2006). The band at 820 cm-1 refers to Si-O-Si symmetric stretching vibration, proving the nanomaterial deposition agrees with SEM images. The band around 930 cm-1 also refers to silanols (Si-OH) groups [27,28]. These bands in MASITp are much more intense than the MASIT, indicating that the pre-polymerization process occurred more effectively, favoring the formation of framework silica. It is possible also to observe two other bands of interest when considering the titanium oxide-doped MASI and MASITp membranes (Figs. 12c and 12d). The band at 1250 cm-1 can be ascribed to vibrations of Si-C bonds, which are the product of a synergy between CdotN and SiO2. One can observe that the Si-C bands are substantially diminished throughout the titanium oxide percentage increase until it entirely vanishes, indicating that Si-O-Ti linkage was formed.
FTIR measurements showed no substantial difference between the MASI membranes' spectra with or without titanium isopropoxide's addition. This result results from a very low titanium load in the matrix [29].
Application of MASI and MASIp membranes.
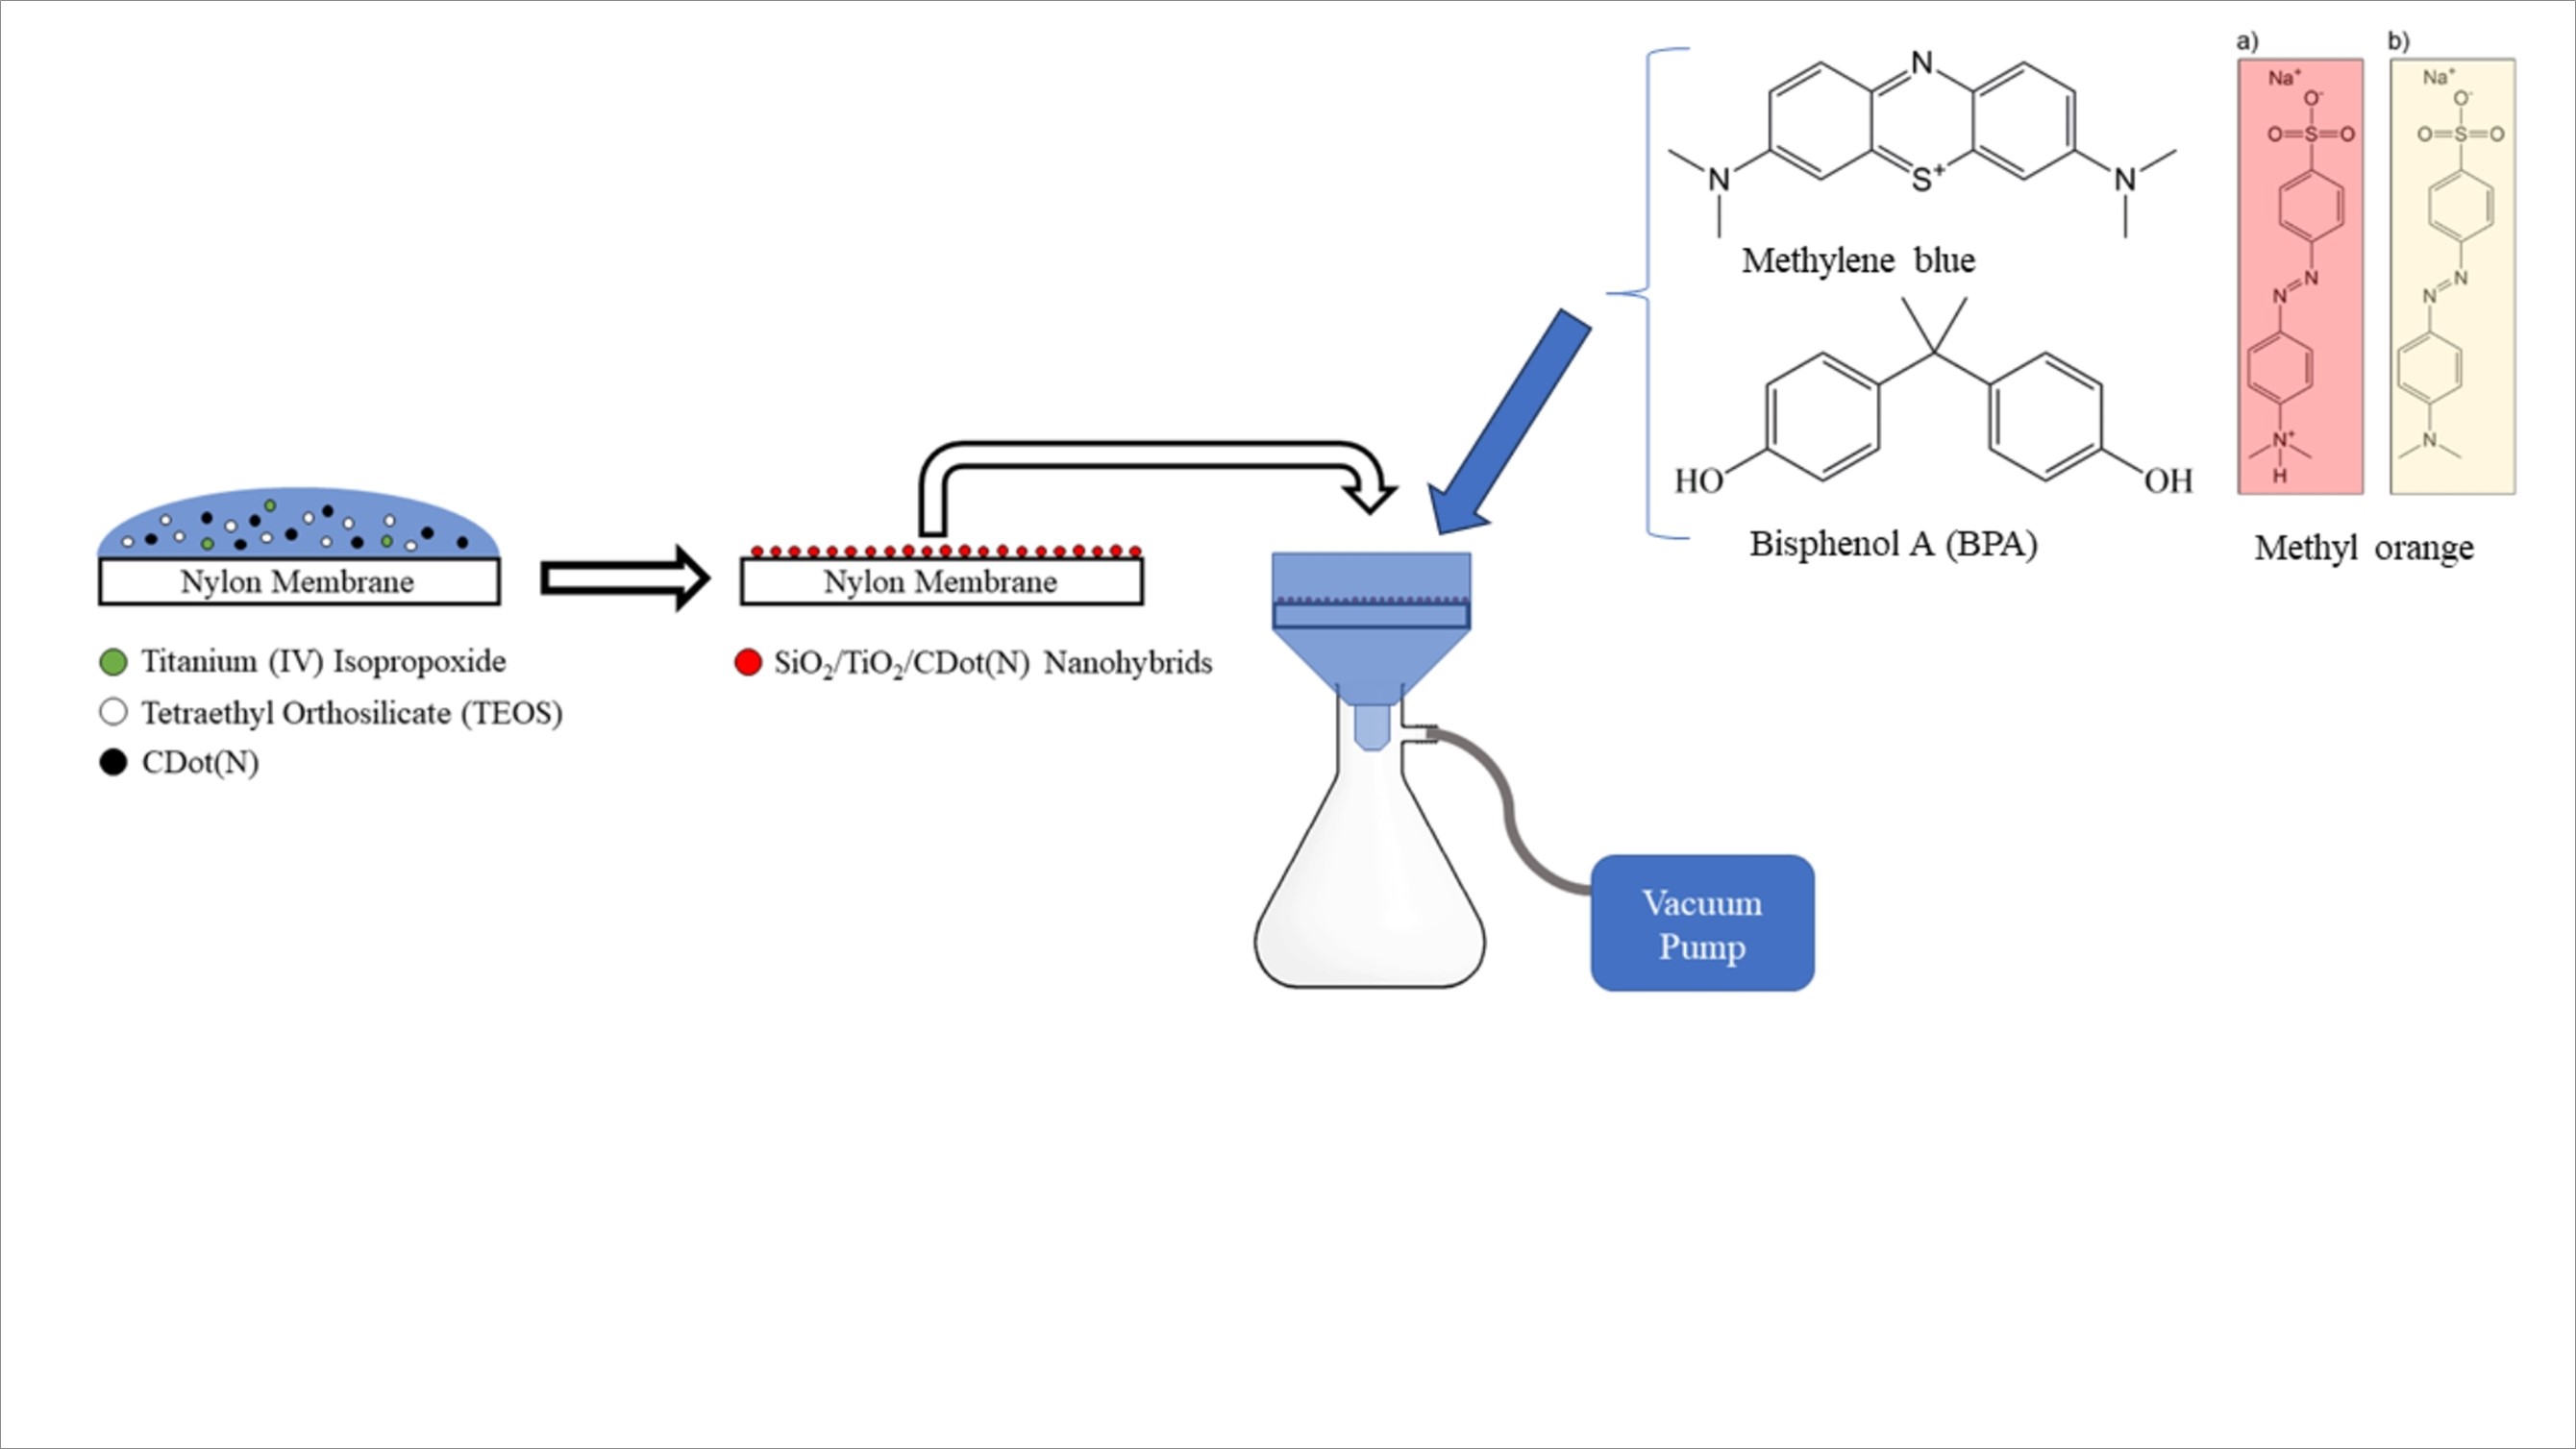
The retention efficiency of membranes was evaluated using methylene blue (cationic probe) and methyl orange (anionic probe). All membranes were tested with 20 mL of either a 40 µmol.L-1 of methylene blue solution or 80 µmol.L-1 of methyl orange solution.
Table 1 shows the MASI and MASIp membrane retention results for methylene blue. As can be seen, the different methods of synthesis applied for the obtention of membranes interfere with the retention tax of methylene blue. Entries 1 to 2 from Table 1 confirm that the membrane modification is mandatory to be effective, while entries 3 to 5 provide information on optimizing TEOS and aqueous extract added volume ratio (before the condensation reaction). The best ratio was the 2:1 ratio, which led to the highest membrane efficiency for methylene blue removal. The maximum operation time threshold set for MASI and MASIp membranes was 5 minutes. The same ratio was tested with the pre-polymerization protocol (entry six from Table 1), which shows the removal of 95% of methylene blue. After that, the pre-polymerization protocol shows a significant change in membrane efficiency compared to MASI obtained by aqueous extract 1:1, probably due to better silica distribution onto nylon membrane, as demonstrated by SEM mapping.
Table 1
Assays for methylene blue removal: a) added volume ratio of TEOS: aqueous extract 1:1; b) the added volume ratio of TEOS: aqueous extract 2:1; c) the added volume ratio of TEOS: aqueous extract 0.5:1. (Test performed in triplicate)
| Entry | Material | %R |
| 1 | Nylon membrane (Substrate) | 3 |
| 2 | Aqueous Solution Deposition | 46 |
| 3 | TEOS Deposition | 22 |
| 4 | In situ Cdot(N)@SiO2 (a) | 92 |
| 5 | In situ Cdot(N)@SiO2 (b) | 98 |
| 6 | In situ Cdot(N)@SiO2 (c) | 90 |
| 7 | In situ Cdot(N)@SiO2 (pre-polymerization) | 95 |
Table 2 shows the retention results for methylene blue of the MASIT and MASITp membranes containing different titanium concentrations. Entries 1 to 3 in Table 2 provide information that titanium oxide, in 0.5 e 1%, presence improves the retention tax of methylene blue compared with MASI (TEOS/ aqueous extract 1:1 and TEOS/aqueous extract 0.5:1) and MASIp. These occur because titanium oxide has Bronsted-Lowry and Lewis sites that favor molecule retention. The MASITp membrane with different titanium oxide concentrations (0.25 to 2%) was also evaluated in entries six to eight from Table 2. The results presented weren’t better than MASIT (1% TiO2) or MASI (b), probably due to the pre-polymerization process favoring high titanium oxide distribution (see SEM-mapping Fig. 11) onto the membrane blocking the porous.
Table 2
Assays for methylene blue removal. (Test performed in triplicate)
| Entry | Material | %R |
| 1 | In situ Cdot(N)@[0.25% TiO2 n/(n TEOS)-SiO2] | 85 |
| 2 | In situ Cdot(N)@[0.5% TiO2 n/(n TEOS)-SiO2] | 96 |
| 3 | In situ Cdot(N)@[1.0% TiO2 n/(n TEOS)-SiO2] | 98 |
| 4 | In situ Cdot(N)@[2.0% TiO2 n/(n TEOS)-SiO2] | 90 |
| 5 | In situ Cdot(N)@[0.25% TiO2 n/(n TEOS)-SiO2] (pre-polymerization) | 82 |
| 6 | In situ Cdot(N)@[0.5% TiO2 n/(n TEOS)-SiO2] (pre-polymerization) | 95 |
| 7 | In situ Cdot(N)@[1.0% TiO2 n/(n TEOS)-SiO2] (pre-polymerization) | 98 |
| 8 | In situ Cdot(N)@[2.0% TiO2 n/(n TEOS)-SiO2] (pre-polymerization) | 98 |
The methyl orange has also been used as an anionic probe to understand better the modified membranes' retention mechanism under optimized compositions, including polymerization ratios and titanium oxide concentration in the product. The study involved a two-step filtration: one filtration at neutral pH and a second filtration with the same filter but at an acidic pH. This practice aims to evaluate the capacity of capturing anionic dyes (Fig. 2a) and the influence of changing the micro species to a zwitterionic structure (Fig. 2b). The results are shown in Table 3. Entries 1 to 9 show that the TiO2 load and synthetic route differences add beneficial characteristics. Entry 2 of Table 3 indicated that the presence of TiO2 in the matrix provides higher efficiency of methyl orange in both microspecies: zwitterionic and anionic. On the other hand, entry 4 of Table 3 pointed to a selectivity change in the stationary phase, which enhances the retention capacity of acidic compounds. These possibly occurred due to Bronsted-Lowry acid sites being more exposed to the titanium oxide surface.
Table 3
Assays for methyl orange removal. (Test performed in triplicate)
| Entry | Material | %RpH (Neut) | %RpH (Ac) | Ratio %Rac/%Rneut |
| 1 | In situ Cdot(N)@SiO2 | 16 | 9 | 0.56 |
| 2 | In situ Cdot(N)@[0.25% TiO2 n/(n TEOS)-SiO2] | 35 | 0 | N/A |
| 3 | In situ Cdot(N)@[0.5% TiO2 n/(n TEOS)-SiO2] | 22.7 | 33.33 | 1.46 |
| 4 | In situ Cdot(N)@[1% TiO2 n/(n TEOS)-SiO2] | 5 | 24 | 4.8 |
| 5 | In situ Cdot(N)@[2% TiO2 n/(n TEOS)-SiO2] | 3.5 | 15 | 4.3 |
| 6 | In situ Cdot(N)@[0.25% TiO2 n/(n TEOS)-SiO2] (pre-polymerization) | 11.2 | 27 | 2,4 |
| 7 | In situ Cdot(N)@[0.5% TiO2 n/(n TEOS)-SiO2] (pre-polymerization) | 54 | 0 | N/A |
| 8 | In situ Cdot(N)@[1% TiO2 n/(n TEOS)-SiO2] (pre-polymerization) | 15 | 5 | 0.33 |
| 9 | In situ Cdot(N)@[2% TiO2 n/(n TEOS)-SiO2] (pre-polymerization) | 23 | 0 | N/A |
The silica matrix (entry 1 of Table 3) shows a relatively high electrostatic attraction with positively charged species and considerable repulsion of analytes with an opposite charge. As observed, the repulsion is strong enough to weaken the affinity between matrix and methyl orange even in the zwitterionic state. On the other hand, the titanium-doped matrix (entry 2 of Table 3) has titanium oxide islands that may attenuate the overall repulsion effect in the new matrix. It shows almost 40% more retention of the azo dye and remarkably higher retention when the analyte is acidic than the titanium oxide-free model, suggesting a significant increase of active sites acting as Lewis’s acid and base. The MASIp/1% TiO2 (entry four from Table 3), due to having a better homogeneity of titanium oxide on nylon substrate, showed a better retentive product for methyl orange contamination. A filtration membrane with In situ Cdot@[0.5% TiO2 n/(n TEOS)-SiO2] (prepoly). was weighted. The difference between the modified and unmodified membranes was around 60 mg. Therefore, filtration capacities can be expressed as 10.13 mg of methylene blue per gram of sorbent, 11.79 mg of methyl orange, and 32.33 mg of bisphenol per gram of sorbent. The same procedure was performed by the membrane In situ Cdot(N)@[1% TiO2 n/(n TEOS)-SiO2] (pre poly). The results were below than compared with In situ Cdot@[0.5% TiO2 n/(n TEOS)-SiO2], with 10 mg of methylene blue per gram of sorbent, 4.2 mg of methyl orange, and 17.6 mg of bisphenol per gram of sorbent. These results confirm the better efficiency of the membrane with In situ Cdot@[0.5% TiO2 n/(n TEOS)-SiO2].
Real sample analysis
The filtration membrane with the optimal setup was chosen based on the high performance of trapping both basic and acidic analytes dyes together with bisphenol A was the 0.5% TiO2 n/(n TEOS) MASI. This membrane was tested with tap water doped with methylene blue in the same concentration and volume as previous studies.
It was possible to confirm that the new matrix did not change the filter's behavior. Still, verifying that the filter developed in this paper could achieve a very fitting dye retention capacity was also possible. The complete comparison of results involving membranes doped with carbon quantum dots-based membranes can be found in Table 4.
Table 4
Comparison between the literature on dye removal capacities considering a rapid flow protocol.
| Entry | Material | Total retention (mg of dye) |
| 1 | In situ Cdot(N)@[0.5% TiO2 n/(n TEOS)-SiO2] (pre-polymerization) (This paper) | 0.243 |
| 2 | Nanofibrous Membranes Containing TiO2 NPs (Sajjadi et al.) | 0.104 |
| 3 | NCQDs-TiO2/PAA/PES (Heng et al. 2021) | 0.225 |
| 4 | NCQDs-TiO2 (Heng et al. 2020) | 0.225 |
MASI and MASITp membranes with 0.5 and 1% Titanium isopropoxide loading were selected as BPA filtration membranes for further investigation. Entries 1–4 from Table 5 provide information regarding the membrane application. As observed by the study with the two probes, the MASITp of In situ Cdot@[0.5% TiO2 n/(n TEOS)-SiO2] was the optimal point considering both contaminant rejection capacity and mechanical stability. We believe this occurred due to bisphenol being a neutral molecule and presenting better absorption on MASI due to the small amount of TiO2. This membrane model was chosen to filtrate BPA in contaminated tap water.
Table 5
Assays for BPA removal in tap water.
| Entry | Material | %R |
| 1 | In situ Cdot(N)@[0.5% TiO2 n/(n TEOS)-SiO2] | 97 |
| 2 | In situ Cdot(N)@[0.5% TiO2 n/(n TEOS)-SiO2] (pre-polymerization) | 97 |
| 3 | In situ Cdot(N)@[1% TiO2 n/(n TEOS)-SiO2] | 93 |
| 4 | In situ Cdot(N)@[1% TiO2 n/(n TEOS)-SiO2] (pre-polymerization) | 55 |
The group has also tested tap water, simulating a highly contaminated industrial BPA effluent. In this case, the testing volume was maintained, but the working concentration was changed to 40 µg.mL-1 of the contaminant. Entry 1 and 4 from Table 6 provide information about the commercially available filtration system (containing the commercially available nylon membrane). An efficiency drop of 7% confirmed that surface poisoning was observed even though the regeneration protocol was performed. Nevertheless, the chosen MASIp doped with titanium could sustain the high performance for six cycles with no performance drop, as shown in entries 3 and 4 of Table 5.
Table 6
Assays for BPA removal in tap water: a) result after the second flow through the membrane; b) result after the sixth flow through the membrane.
| Entry | Material | %R |
| 1 | Commercial Nylon Membrane | 97 |
| 2 | Commercial Nylon Membrane (a) | 90 |
| 3 | In situ Cdot(N)@[0.5% TiO2 n/(n TEOS)-SiO2] (pre-polymerization) | 97 |
| 4 | In situ Cdot(N)@[0.5% TiO2 n/(n TEOS)-SiO2] (pre-polymerization) (b) | 97 |
| Graphical Abstract |