The microalgae Dunaliella is a commercially viable species and well known for its extreme environmental tolerance and β-carotene production under stressful conditions. We examined the effect of salinity and light intensity on the growth and β-carotene production, respectively, in two different species of Dunaliella: Dunaliella. sp. and D. salina, isolated from the salt pans of Goa. Both the species were cultured in growth media with different salinity levels to establish the optimum salinity favouring maximum cell growth. Thereafter, the cells were cultured under optimum NaCl concentration, exposed to a range of light intensity and monitored for β-carotene production. The two species, identified based on their molecular characteristics, displayed a significant difference in growth and β-carotene production. Both D. salina and D. sp achieved a maximum cell density of 11.82×10⁶ cells/ml and 18.76×10⁶ cells/ml at 0.75 M and 0.5 M salinity, respectively. D. salina accumulated a large amount of total carotenoid (36.95 pg. cell-1) when cultured at 0.75 M salinity and exposed to high light intensity (1000 µmol m− 2 S− 1). In contrast, the carotenoid content per cell was low in Dunaliella sp. (3.07 pg. cell-1) when cultured under optimal salinity (0.5M) and high light intensity, indicating photoinhibition. We found that different Dunaliella species exhibit different photo-physiological properties that need further evaluation to identify the right candidate for industrial applications.
Research Article
Photoinhibition and β-Carotene Production From Dunaliella sp. Isolated From Salt Pans of Goa
https://doi.org/10.21203/rs.3.rs-344412/v1
This work is licensed under a CC BY 4.0 License
Version 1
posted
You are reading this latest preprint version
Dunaliella salina
Dunaliella sp.
Salt pan
β-carotene
Photoinhibition
Carotenoids are lipid-soluble plant pigments found in photosynthetic plants, animals and microorganisms. Hydrocarbon carotenoids such as β-carotene and lycopene, which are abundant in yellow- and orange-coloured fruit and vegetables, are correlated to a reduced risk of site-specific cancers and heart disease [1, 2], whereas oxygenated carotenoids such as lutein and zeaxanthin, which are abundant in dark-green leafy vegetables, play a vital role in protecting the eye tissues [3]. The bioavailability of carotenoids such as β-carotene is relatively lower than that of lutein and zeaxanthin. Several researchers have found that formulated carotenoids (e.g. pure β-carotene dissolved in oil or aqueous dispersions) are efficiently absorbed (> 50%) [4, 5], whereas carotenoids in uncooked vegetables such as β-carotene in the carrot [6] or lycopene in tomato juice [7] are poorly absorbed (< 3%). Food processing (e.g. boiling) will also affect the bioavailability of carotenoids by increasing the oxidation and production of more isomers [8]. Commercially available β-carotene supplements may contain either synthetic β-carotene or natural β-carotene (mainly from the algae Dunaliella salina
The usage of synthetic pigments increased more than 50% in the total industrial applications. Usage of such pigments are banned in the society due to its potential harmful effects on the environment and human beings [9]. As a result, natural pigments have become preferred choice, with microalgae being identified as one of the important sources of a vast array of valuable natural products with different biotechnological applications. Among microalgae, D. salina and D. bardawil have been known to produce significant amount of carotenoid and its β-carotene constituent. β-carotene has a wide range of applications, including as a characteristic food-colouring agent, as pro-vitamin A (retinol), as an additive to beauty care products, and as a well-being food product with high demand [10]. As a retinoid precursor, 9-cis β-carotene gives particular nutritional and medicinal interest, and it is related to therapeutic effects in treating several diseases [11]. This stereoisomer of β-carotene is not produced biologically by heterotrophs such as bacteria and yeasts through the fermentation process, and it is difficult to synthesize chemically. Moreover, it is found only in small quantities in fruits and vegetables [12].
D. salina is a known source of natural β-carotene and high content of 9-cis isomer (approximately 50% of the total β-carotene) and has a growing demand [13]. Also, Dunaliella strains are an eminent source of xanthophyll pigments, such as lutein and zeaxanthin, and β-carotene [14]. Among such microalgal group, Dunaliella is the salinity-tolerant green algae, which grows in a hypersaline environment with different salinity levels, ranging from 0.5 M to 5.5 M [15], and is capable of producing various natural compounds. Some of the Dunaliella strains are known for the accumulation of carotenoids in larger amount, particularly β-carotene [16]. These algae can produce a high amount of β-carotene under stress conditions such as increased light intensity [17], higher salinity [18], nutrient limitation [19] and nitrogen starvation [20]. However, at the same time, the cell division is affected, resulting in a decreased number of cells per culture volume [21]. Both colour and antioxidant properties made carotenoids an important biomolecule from the industrial perspective [22].
Under certain extreme environmental conditions, Dunaliella strains show various carotenogenic abilities and varied carotenoid compositions [23]. As microalgae are expensive to cultivate, many attempts are underway to achieve low-cost modes for large-scale cultivation and to scale up the pigment production by these organisms [24]. In general, the β-carotene production increases when the growth rate is least, and this is the major predicament to the commercial production of β-carotene using D. salina [25]. As a measure of mitigation, different strategies are followed to increase the growth of microalgae for large-scale production [26]. A common strategy used by the researchers is to achieve maximum biomass of Dunaliella sp. at lower salinity (about 15%w/v NaCl) followed by β-carotene accumulation at higher salinity (about 20–25% w/v NaCl) [27,28,]. Earlier, [29] reported the synergistic effect of salinity and light intensity on the carotenogenesis of D. salina. Thereafter, several researchers attempted to increase β-carotene production in Dunaliella sp. by altering the salt concentration and light irradiance [30].
In this study, we isolated two different species of Dunaliella from the salt pans of Goa and characterized their growth and β-carotene production. The two species, D. salina and D. polymorpha, were identified based on their molecular characteristics. We conducted a series of experiments to optimize the culture conditions for increased cell abundance and increased carotene production based on salinity and light intensity, respectively. We compared the results obtained in this study with those from other similar studies to assess the potential of the Dunaliella sp. for the commercial production of β-carotene.
Sample collection
The water samples were collected in sterile bottles from the salt pans located at Batim (15° 26' 60'' N, 73° 52' 48'' E) and Ribandar (15° 29' 59'' N, 73° 50' 47'' E), Goa, India (Fig. 1). The samples were stored in a thermos cooler and transferred to the laboratory. The time of sampling coincided with the summer season of the year (April 2019), during which high solar radiation with photon flux densities of 800 µmol m−2 s−1and 915 µmol m−2 s−1 was recorded at Batim and Ribandar, respectively. The temperature of the salt pan ranged between 32°C and 37°C on the surface water on both towns of Batim and Ribander. Salinity of sampled water was 280 Part per Thousand(ppt) (Batim) and 186 (ppt) (Ribandar) and the pH varied between 7.53 and 7.71, respectively.
Isolation and Cultivation of Microalgal Strains
In the laboratory, the water samples were serially diluted and the individual cells of Dunaliella sp. were picked by capillary pipetting under a light microscope. The isolates were identified under an inverted light microscope (Nikon Eclipse TS100) on the basis of morphological characters [23]. Following serial dilution, Dunaliella sp. was cultured in 100 ml of f/2 medium, with salinity and pH adjusted to 0.75 M and 7.5, respectively. The culture media were incubated in the laboratory at a temperature of 23±1ºC and under a light intensity of 200 µmol m-2 s-1 provided using a cool white light-emitting diode (LED) with a photo-period of 12:12 h. The Dunaliella cells were sub cultured twice a week.
Effect of Salinity on Algal Biomass
To study the response of salinity on the growth, 5 ml of (5×10⁴ cells/ml) exponentially growing unialgal culture of Dunaliella sp. was inoculated in 150 ml of f/2 medium containing six different NaCl concentrations of 0.5, 0.75, 1, 1.5, 2, 3 M, and incubated under controlled laboratory conditions at 23±1°C, with illumination provided under a 12h light, 12h dark cycle without aeration and manually shaken twice a day. Cell density (ml−1) of two different Dunaliella sp. was determined by direct counting under a light microscope (Nikon Eclipse 80 i) (magnification 40X) with a Neubauer haemocytometer. The experiment was conducted in duplicates.
Effect of light on growth and pigment production
To study the effect of light on the morphology, growth and pigment production, the isolated strains were grown at four different light intensities viz. 100, 200, 500, and 1000 µmol m-2 s-1 in 100 ml of f/2 medium at the optimal NaCl concentration determined from the previous experiment. The intensity of light was controlled by adjusting the distance of culture flasks from the light source. The light intensity was measured using PAR sensor (Apogee Instruments, MQ 200, USA). The effect of light on the morphology of Dunaliella sp. was examined twice a week microscopically, and the cell counts were taken on every third day using the Neubauer haemocytometer (Marienfeld, Germany). The experiment was conducted in duplicates. The number of algal cells was calculated using the following formula:

Pigment Analysis
The exponentially grown Dunaliella algae cells exposed to different light intensities for 20 days were harvested at the end of the light period. The carotenoid pigment was extracted by filtering 5 ml of the culture through a glass fibre filter (GF/F; Millipore) (0.7µm, 47 mm) using a syringe filter. The filter paper was dipped into 5 ml of 90% (v/v) acetone and rubbed gently using a glass rod and left overnight at 4°C. After incubation, the extract was centrifuged at 5000 rpm for 5 minutes, and the absorbance of the extracted pigments was read on a spectrophotometer (Shimadzu UV-Vis 2550) at 452 nm. The total carotenoid concentration of the algal cells was calculated using the formula described by [23]:
C= A452 *3.86* Vc/Vs
where, C = total carotenoid concentration (µg. mL−1); Vc = volume of culture sample (mL);
Vs = volume of extract (mL)
To examine the content of chlorophyll a, b and total chlorophyll, the absorbance of the pigment extract is measured at 664 nm and 647 nm, and the concentration of the pigments was calculated according to [31]. The extracted pigment was identified by TLC and HPLC.
TLC analysis
The concentrated pigment extract was spotted on silica gel plates (TLC silica gel 60 F254, Merck) using a capillary tube. Plates were developed using a mixture of hexane:acetone (75:25). The pigment was detected by the presence of yellow, green and red spots. The Rf value was calculated using the following formula:

HPLC-DAD Analysis of the Extracts
Composition of the extracted pigments from two different Dunaliella sp. was analysed using high-performance liquid chromatography (HPLC) with an Agilent diode assay detector connected via guard column to an Eclipse XDB C8 HPLC column (4.6×150mm) manufactured by Agilent technologies. All chemicals and solvents used (70:30; methanol and ammonium acetate) were of HPLC grade and were procured from E. Merck. For the pigment analysis, 10 ml of log-phase cultured sample was filtered on a GF/F (47mm) filter paper under the dark condition to avoid direct light. The filters were immersed in a 95% acetone and stored at −20°C for overnight. The extract was passed through the 0.22µm nylon syringe filter to remove cellular debris. The quantity of different pigments including chlorophyll a, chlorophyll b chlorophyll c, neoxanthin, diatoxanthin, zeaxanthin, lutein, and β-carotene in the biomass was calculated using the corresponding standard curves. Commercially available standards obtained from DHI Inc. (Denmark) were used for the identification and quantification of algal pigments.
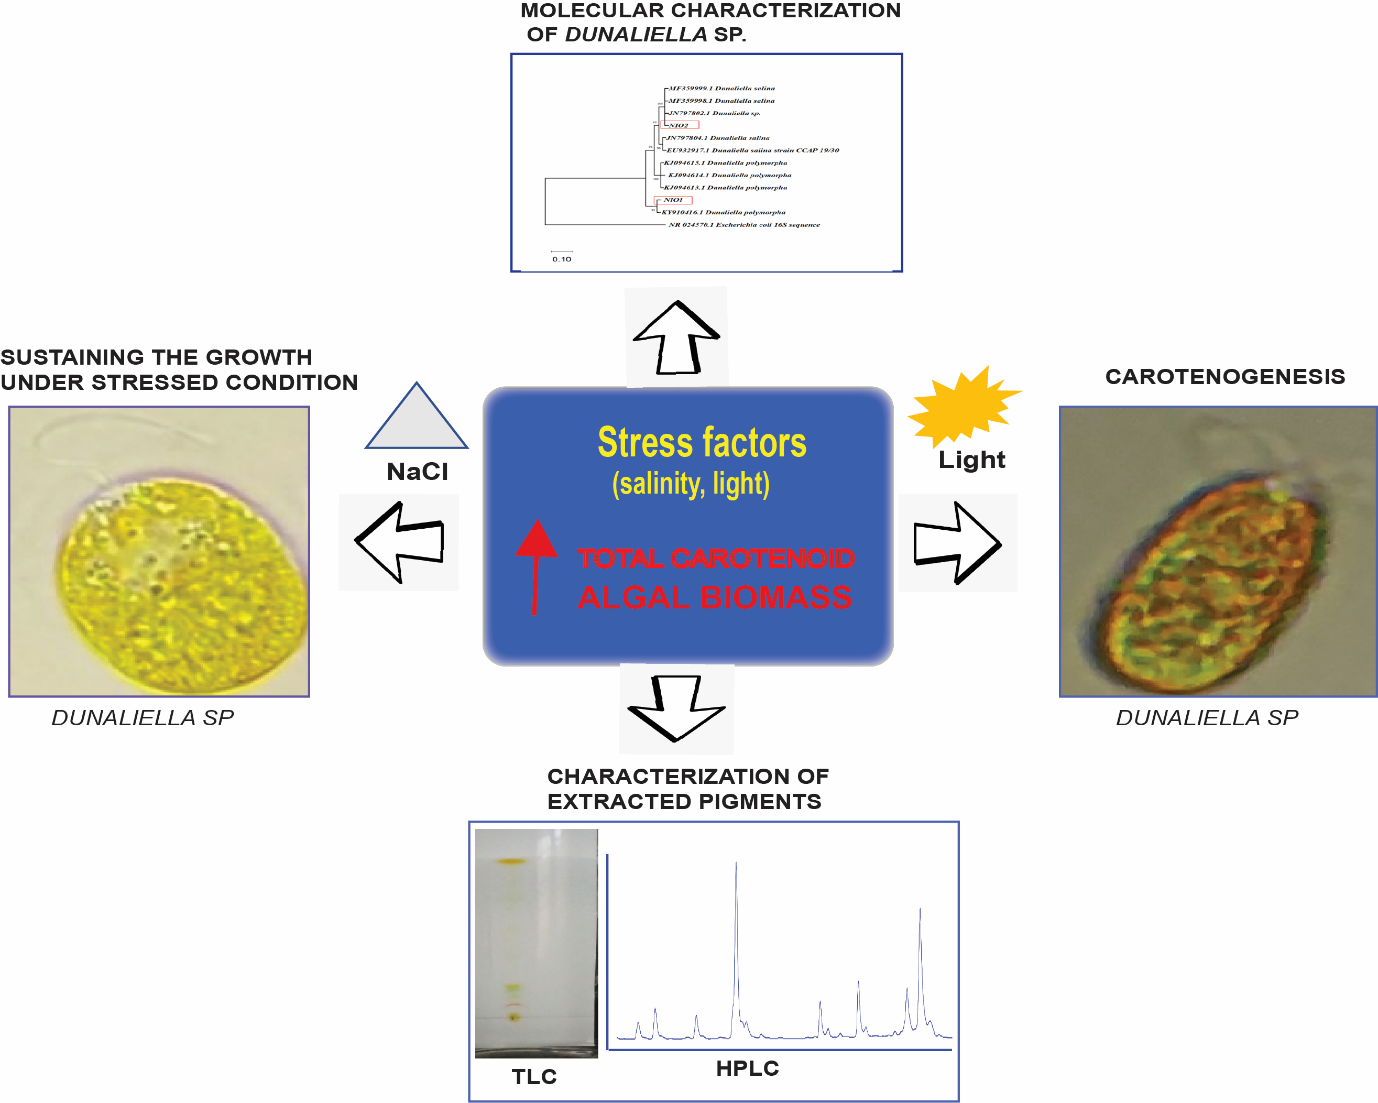
Molecular identification of isolates
DNA was isolated by following the modified phenol-chloroform method [32]. Cells were pelletized by centrifugation at 6000 rpm for 5 min, and the pellets were washed with distilled water, resuspended in 450 µl of buffer (25Mm TrisHcl;10mM EDTA) (pH 8) with lysozyme (5 mg), and vortexed with glass beads and then 50 µl of 10% SDS was added. The tubes were then incubated on ice for 10 min, and 8 µl of Proteinase K (20 mg/ml) was to added the tubes, which were further incubated at 60°C for 60 min in a water bath. Once the cells were lysed completely, the DNA was purified following standard phenol/chloroform extraction and ethanol precipitation [33]. The quality of the isolated DNA was checked in a 1% agarose gel and the quantity was measured using nanodrop. For molecular identification, the ITS region of the isolated DNA was amplified using primers ITS-AB28(F) GGGATCCGTTTCCGTAGGTGAACCTGC and ITS-TW819(R) GGGATCCATATGCTTAAGTTCAGCGGGT [34] in an Applied Biosystem thermocycler following the PCR cycle at 95°C for 5 min. 35 cycles of 95°C for 1 min. 52°C for 1 min, 35 cycles of 95°C for 1 min, 52°C for 1 min. and 72°C for 1 min, and 1 cycle of final extension at 72°C for 5 min. The PCR reaction mixture contains 6.5µl H2O, 1 µl DNA, 2.5 µl of each primer (25 PM) and 12.5µl of 2X Sigma Aldrich PCR master mix. Sequencing was performed by Agri Genome Labs (India) using sanger dideoxy method. The obtained sequence was subjected to targeted loci BLAST using 18 rDNA sequence database to ascertain the identity of the algal cells. Sequences of 18 rDNA gene of related taxa were obtained from NCBI GenBank and multiple sequence alignment (MSA) was built using the web version of ClustalW. The phylogenetic tree was constructed with neighbour joining through bootstrap analyses with 1000 replications were performed to ascertain the accuracy of tree topology. The sequence of MK000718 Staphylococcus pasteuri strain HT4-S was used as an outgroup.
Statistical analysis
One-way analysis of variance (ANOVA) was used to test the significance of differences in the growth and pigment production by the two different species of algae at different salinities and light intensities. The data generated in this study was the mean of duplicates experiments ± standard deviation. Whether or not an observed correlation is statistically significant or not was evaluated by P values (significant when P ≤ 0.05).
Morphological characteristics of the newly isolated strains
The halotolerant microalgae isolated from the salt pans of Goa were identified as D. salina and D. sp, which vary in cell shape and size from each other (Fig 2 a,b) Both the strains are unicellular and biflagellate. The stigma of D. sp. species is prominent, stick shaped, small and found on the anterior side of the cell, whereas the stigma of D. salina is diffused. In D. salina, carotenoids accumulated in the inter-thylakoid spaces as oil droplets (Fig 2a). In the initial stage, the carotenoids were formed at the periphery of the chloroplast and then spread throughout the organelle as the carotenoid content increases. On the other hand, Dunaliella sp. accumulated carotenoids as a single droplet near the stigma (Fig 2b).
The cell shape, size and colour were found to vary between the two Dunaliella sp. During the culture period, D. sp remained as green, oval shapes, while D. salina slowly changed from green, round shapes to reddish-orange, oval ones. The cell size of D. salina measured approximately 12–18 µm in diameter, with flagellar length of 17–21 µm, whereas D. sp measured 2–6 µm diameter, with flagellar length of 5–10 µm.
The phylogenetic analysis of the ITS region showed that both the species isolated from the salt pans of Goa formed two groups. (Fig 3). The first group was comprised of Dunaliella sp and the isolated species Dunaliella sp G1 clustered with this group. The Dunaliella salina formed the second group and the Dunaliella salina G2 was clustered with this group. The Blast results revealed that isolate Dunaliella salina G2 (Accession No: MW218509) obtained from Batim showed 100% identity with D. salina strain NUAC09 and the isolate Dunaliella sp G1 (Accession No: MW218512) obtained from Ribander showed 99% identity with Dunaliella sp MBTD-CMFRI-S122.
Effect of salinity on algal biomass and pigment production
Both D. salina and D. sp showed an inverse relationship with salinity, where the cell numbers decreased with increase in the NaCl concentration (Fig. 4). D. salina reached a maximum cell density of 11.82 × 10⁶ cells/ml at 0.75 M NaCl concentration, whereas D. sp showed a maximum cell density of 18.76 × 10⁶ cells/ml at 0.5M salinity. Both the strains showed no growth at higher salinity (3M). According to this result the optimum salinity for the maximum growth of D. salina and D. sp was 0.75M NaCl and 0.5M NaCl, respectively. The growth rate of D. sp differed significantly between the cultures exposed to different NaCl concentrations (P≤0.01), In contrast, the growth rate of D. salina grown at different NaCl concentrations was not statistically significant (P≥ 0.05). Both the species accumulated low amount of carotene in their cells under high salinity.
Effect of light intensity on growth and pigment production
The growth curve of D. salina and D. sp exposed to different light intensities of 100, 200, 500,1000 µmol m-2 s-1 is summarized in Fig 5. Under higher light intensities, Dunaliella sp. showed maximum cell growth. Upon exposure to a high light intensity of 1000 µmol m-2 s1 and a low intensity of 100 µmol m-2 s-1, D. salina achieved a maximum cell density of 22.35 ×10⁵ cells/ml and a low cell density of 13.25 ×10⁵ cells/ml, respectively. The maximum cell density (10.03 ×10⁵cells/ml) of D. sp obtained at a light intensity of 1000 µmol m-2 s-1 was comparatively lower than D. salina. The observed variation in the growth rate of D. sp exposed to different light intensity was statistically significant (P ≤0.05) compared with D. salina (P ≥0.05). This growth level was obtained between 15 and 21 days of the experiment. The growth curves show a large increase in cell density after the 7th day (log phase) of inoculation.
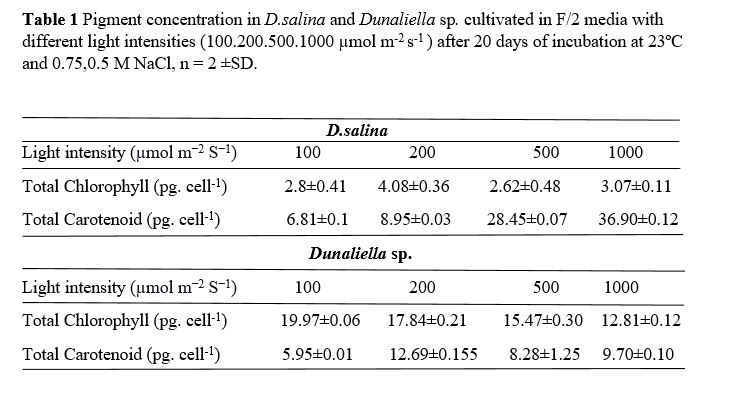
Pigment composition
The TLC revealed the presence of four prominent fractions of pigments including chlorophyll a, chlorophyll b xanthophyll, β-carotene and phenolic compounds in both D. salina and D. sp. Chlorophyll a, chlorophyll b and β-carotene were the dominant pigments with Rf values 0.14, 0.11 and 0.87, respectively (Fig. 6a). The total chlorophyll and total carotenoid contents of D. salina and D. sp exposed to four different light intensities (100, 200, 500 and 1000 µmol m-2 s-1) are depicted in Table 1. Increased light intensities resulted in decreased total chlorophyll content but, increased total carotenoids in both the Dunaliella species. The observed variation in the total carotenoid production by D. sp and D. salina exposed to different light intensities was not statistically significant (P = 0.059>0.05). However, the total chlorophyll accumulation was statistically significant between the two species (P<0.001)
The total carotenoid content of D. salina ranged between 7.9 and 36.6 pg. cell−1), and chlorophyll concentration ranged between 5.99 and 9.70 pg. cell−1). In D. sp maximum concentration of chlorophyll (12.8–19.9 pg. cell-1) as well as carotene content (2.8–4.0 pg. cell−1) is obtained (Table 1). As per One-way ANOVA, the cellular content of total carotenoids was found to vary significantly in two species under different light intensities (P<0.001). Chlorophyll and β-carotene were the dominant pigments present in the algal strains. HPLC-DAD was used to measure the composition of major carotenoids, namely zeaxanthin, lutein, neoxanthin, β-carotene, chlorophyll a, b, c, and violaxanthin, in both the Dunaliella species in response to the four different light intensities. Fig 6b, shows HPLC chromatogram of the pigments extracts from the two Dunaliella species grown under the light intensities of 1000 µmol m-2 s-1. It’s clear that, in Dunaliella salina β-carotene dominates the carotenoid composition. Dunaliella sp. produced a higher relative amount of lutein and zeaxanthin under high light stress compared with D. salina indicates the important role of these pigment in Dunaliella sp. photoprotection.
D. salina exposed to 1000 µmol m-2 s-1 light produced relatively a higher amount of zeaxanthin (0.20 mg/ml) than Dunaliella sp. showing the important role of zeaxanthin in D. salina for photoprotection. At the same light intensity, D. sp showed considerably higher concentration of lutein (1.08 mg/ml) than D. salina.
The major characteristic difference between these two species was their ability to accumulate β-carotene (Fig 7a). The β-carotene content increased with increasing light intensity in both the species. Under the higher light intensity of 1000 µmol m-2 s-1, the β- carotene content was 4.28 mg/ml and 12.49 mg/ml in Dunaliella sp and D. salina, respectively. Both the Dunaliella species showed a similar response to increasing light by increasing the β-carotene accumulation in the cell. D. salina produced maximum β-carotene than Dunaliella sp. under the four different light intensities examined. We found that the ability of β-carotene production in D. salina much higher than in Dunaliella sp. under light stress.
Fig. 7b, shows the effect of light intensity on the lutein production of the two species. The response of both the species towards increasing light intensities and accumulation of lutein varied considerably among different strains. The lutein content in D. salina did not vary considerably under the four different light intensities. In D. salina, the lutein concentration was inversely proportional to light intensity. D. salina, showed maximum accumulation of lutein content under light intensity of 100 µmol m-2 s-1. The maximum Lutein content was increased under 1000 µmol m-2 s-1 of light intensity in Dunaliella sp. In Dunaliella sp the lowest lutein content at 100 µmol m-2 s-1 was obtained.
The cellular content of zeaxanthin in the two species grown under different light intensities is shown in Figure 7c. Dunaliella sp. strain accumulated the highest amount of zeaxanthin under higher light intensity, whereas D. salina accumulated the lowest. Dunaliella sp. contains a higher cellular content of zeaxanthin at light intensity of 1000 µmol m-2 s-1, whereas D. salina accumulates higher zeaxanthin content under 100 –200 µmol m-2 s-1. Under different light intensities the accumulation of zeaxanthin was significantly different among strains.
Figure 7 (d) shows that neoxanthin content in two Dunaliella sp. Both species show a different response to different light intensities. D. sp had the highest pigment concentration under high light intensity.
In this study, we compared the growth, morphological characteristics, and accumulation of carotenoids under various light intensities between two Dunaliella species, D. salina and Dunaliella sp., isolated from the salt pans of Goa. These algal cells use the carotenoid synthesis pathway as a protective mechanism against photodamage when exposed to high light stress [35–38]. From this study, it is apparent that Dunaliella. sp is susceptible to photoinhibition, while D. salina was not affected by high light intensity and maintained high levels of β-carotene under the different light intensities studied. These results suggest that D. salina developed a better photo-protective mechanism against light stress than Dunaliella sp.
The complicated fact that the culture conditions leading to the maximum cell growth of Dunaliella sp. are different from those leading to the maximum accumulation of β-carotene in the cell. In this study we found lower salinity led to maximum cell growth and higher light intensity induced maximum carotene accumulation in the cell. Therefore, the salinity was optimized for maximum β-carotene production per unit time. Orest et. al [39] reported that the influence of salinity on carotenoid biosynthesis in D. salina does not show clear tendencies between 0.4 and 3M NaCl. Similarly, we did not observe a clear pattern on the production of carotenoid per cell along the range 0.5 M to 3 NaCl in both the strains. The two Dunaliella species showed a different response to different light intensities and the corresponding carotenoid accumulation. However, the fact that D. salina accumulated a large amount of β-carotene compared with D. sp. at various light intensities is noteworthy. When D. salina was exposed to high light intensity, the β-carotene content increased in the plastoglobuli, while it remained constant in the thylakoid [39]. A similar pattern of a rise in the production rate of β-carotene was observed in the study conducted by Lamers [40]. The β-carotene level in the cell is actually regulated by the amount of irradiation received during the cell division cycle [29, 41]. In line with this trend, D. salina isolated from the salt pans accumulated large amount of β-carotene when exposed to light intensity of ≥ 1000 µM m− 2 s− 1.
We observed that D. salina cultured in f/2 medium with 0.75 M NaCl concentration and under high light intensity of 1000 µmol m− 2 s−1 accumulated the highest carotenoid amount of 36.905 ± 0.5 pg. cell− 1, which is higher than that obtained by [42]. They obtained an amount of 22 ± 0.7 pg. cell− 1 when D. salina was cultivated at the salinity of 0.75 M and light intensity of 1500 µmol m− 2 s− 1 We also found that salinity had no effect on the carotenoid production in D. salina and Dunaliella sp. However, light stress showed positive regulation of carotenoid production in D. salina.
Zeaxanthin and lutein are essential pigments produced under elevated light stress for the efficient transition of the light-harvesting complexes (LHCs) of PSII [43]. Under high light intensity, violaxanthin is converted into zeaxanthin through the intermediate antheraxanthin by the enzyme violaxanthin de epoxidase. When light intensity decreases, the process is reversed [44]. The current study has shown an increased amount of zeaxanthin, lutein in Dunaliella sp. exposed to light stress, confirming that Dunaliella sp. exhibits xanthophyll cycle as an efficient photoprotective mechanism in addition to β-carotene production. In D. salina, however, the β-carotene production serves as a major role in photoprotective mechanism in addition to xanthophyll cycle. Several authors reported that the variation of β-carotene content in Dunaliella is regulated by the overall amount of irradiance received during a division cycle or to be a specific mechanism of photoprotection [45], which may elucidate why D. salina contains increased β-carotene production than Dunaliella sp.
Lutein is the main carotenoid pigment in the light-harvesting antenna of green algae and higher plants. The exploration of microalgal species able to produce carotenoids of commercially interested pigments, such as lutein, is thus highly product enticing [46, 47]. Previous studies showed that D. salina is not suitable for industrial production of lutein due to their slow growth rate at a light intensity of, for example, 170 µE/m²/s² or higher [48]. In the present work, Dunaliella sp. showed an increase in lutein content when exposed to high light intensity, which can be a prospect for industrial production of lutein. Lutein acts as an active antioxidant and plays a potential role in preventing or ameliorating age-related macular degeneration.
The results of this study provide evidence that the ratio of carotenoids produced by D. salina depends highly on the applied stress factor, as well as on the strain studied. β-carotene and its derivatives such as violaxanthin, neoxanthin and zeaxanthin, can also be synthesized during the biosynthesis of carotenoids. The reason for the different levels of carotenoid production might be environmental conditions or genetic and stress factors [49]. β-carotene also serves as an important functional antioxidant and acts as a key component in the memory of the chloroplast for preceding photo-oxidative stress. Due to bioactive properties of β-carotene, it can be concluded that Dunaliella salina is a beneficial microalga in the field of pharmacology.
Figure 8 shows the biosynthetic pathway of essential carotenoids in Dunaliella sp. [50]. Significantly, the pathway depicted here reveals that α-carotene is related to β-carotene rather than lutein, although the precursor of α-carotene is lutein. Lutein is the most abundant xanthophyll in the photosynthetic apparatus of higher plants. It has the specific function of quenching harmful 3chl* by binding at site of L1 of the major LHCII complex and of preventing reactive oxygen species (ROS) formation. The substitution of lutein by violaxanthin decreases the efficiency of 3chl* quenching and thus causes higher ROS yield [51]. In the absence of lutein, cells are prone to photodamage during photosynthesis. Under normal conditions, however, an additional protective mechanism such as zeaxanthin production partially compensates for the damage. But under stress conditions (e.g. high light intensity) the additional mechanism fails, and the damage becomes evident [52]. The finding in this study is consistent with the previous reports. Because, in higher light intensity, the concentration of lutein was higher than the that of zeaxanthin.
It can be concluded that both Dunaliella strains isolated from the salt pans have evolved a universal photoprotection mechanism against the photodamage of cells. Of the two new isolated Dunaliella strains, D. salina produced a higher amount of β-carotene than the Dunaliella sp. strain under stress conditions. Other than β-carotene, two xanthophylls, lutein and zeaxanthin, also played an essential photoprotective function in the cells. In this study, the carotenoid lutein was a primary product in Dunaliella sp. and β-carotene in D. salina. We conclude that D. salina could be used as a carotenogenic strain for the large-scale production of β-carotene under certain light regime with optimum salinity.
Author Contribution
Conceptualization and Research design: CM and SJ; SJ: Conducted the experiments; Data Analysing: SJ, DR, Writing- Review Editing: SJ, CM, DR.
Acknowledgement
We thank the Director and Head of the biological oceanography division (CSIR-NIO) for their constant support and encouragement. The first author would like to thank Dr. B Manikandan (Scientist- NIO) for the inputs to the course of study. Author acknowledge Dr. Devika Joshi for the initial support.
Funding Information
Financial support to the Project Assistant SJ by Council of Scientific and Industrial Research (CSIR) through the project MLP1801
Data Availability
The datasets used in the study are available from the corresponding author on reasonable request.
Conflict of interest
The authors declare that there is no conflict of interest.
Ethical approval
This article does not contain any studies with human participants performed by any of the authors.
Consent for Publication
Not applicable. The manuscript does not contain any individual person’s data.
- Cramer, D. W., Kuper, H., Harlow, B. L., & Titus‐Ernstoff, L. (2001). Carotenoids, antioxidants and ovarian cancer risk in pre‐and postmenopausal women. International Journal of Cancer, 94(1), 128-134.
- Gaziano, J. M. (1996). Antioxidants in cardiovascular disease: randomized trials. Nutrition Reviews, 54(6), 175-177.
- Landrum, J. T., & Bone, R. A. (2001). Lutein, zeaxanthin, and the macular pigment. Archives of Biochemistry and Biophysics, 385(1), 28-40.
- Goodman, D. S., Blomstrand, R., Werner, B., Huang, H., & Shiratori, T. (1966). The intestinal absorption and metabolism of vitamin A and beta-carotene in man. The Journal of Clinical Investigation, 45(10), 1615-1623
- Bertone, E. R., Hankinson, S. E., Newcomb, P. A., Rosner, B., Willett, W. C., Stampfer, M. J., & Egan, K. M. (2001). A population-based case–control study of carotenoid and vitamin A intake and ovarian cancer (United States). Cancer Causes & Control, 12(1), 83-90.
- Roodenburg, A. J., Leenen, R., van het Hof, K. H., Weststrate, J. A., & Tijburg, L. B. (2000). Amount of fat in the diet affects bioavailability of lutein esters but not of α-carotene, β-carotene, and vitamin E in humans. The American journal of Clinical Nutrition, 71(5), 1187-1193.
- Stahl, W., Hanusch, M., & Sies, H. (1996). 4-oxo-retinoic acid is generated from its precursor canthaxanthin and enhances gap junctional communication in 10T1/2 cells Biological Reactive Intermediates V (pp. 121-128): Springer.
- Yeum, K.-J., & Russell, R. M. (2002). Carotenoid bioavailability and bioconversion. Annual review of nutrition, 22(1), 483-504.
- Dhanam, D., & Dhandayuthapani, K. (2013). Optimization of-Carotene production by Marine Microalga-Dunaliella salina. Int J Curr Microbiol App Sci, 2(3), 37-43.
- Borowitzka, L., Moulton, T., & Borowitzka, M. (1984). The mass culture of Dunaliella salina for fine chemicals: from laboratory to pilot plant. Paper presented at the Eleventh international seaweed symposium.
- Wang, X.-D. (1994). absorption and metabolism of beta-carotene. Journal of the American College of Nutrition, 13(4), 314-325.
- Ho, S.-H., Ye, X., Hasunuma, T., Chang, J.-S., & Kondo, A. (2014). Perspectives on engineering strategies for improving biofuel production from microalgae—a critical review. Biotechnology Advances, 32(8), 1448-1459.
- Khoo, H.-E., Prasad, K. N., Kong, K.-W., Jiang, Y., & Ismail, A. (2011). Carotenoids and their isomers: color pigments in fruits and vegetables. Molecules, 16(2), 1710-1738.
- Jin, E., Yokthongwattana, K., Polle, J. E., & Melis, A. (2003). Role of the reversible xanthophyll cycle in the photosystem II damage and repair cycle in Dunaliella salina. Plant Physiology, 132(1), 352-364.
- Chen, H., & Jiang, J. G. (2009). Osmotic responses of Dunaliella to the changes of salinity. Journal of Cellular Physiology, 219(2), 251-258.
- Jin, E., & Polle, J. E. (2009). Carotenoid biosynthesis in Dunaliella (Chlorophyta). The Alga Dunaliella, 147-171.
- Lamers, P. P., van de Laak, C. C., Kaasenbrood, P. S., Lorier, J., Janssen, M., De Vos, R. C., Wijffels, R. H. (2010). Carotenoid and fatty acid metabolism in light‐stressed Dunaliella salina. Biotechnology and Bioengineering, 106(4), 638-648.
- Hadi, M., Shariati, M., & Afsharzadeh, S. (2008). Microalgal biotechnology: carotenoid and glycerol production by the green algae Dunaliella isolated from the Gave-Khooni salt marsh, Iran. Biotechnology and Bioprocess Engineering, 13(5), 540.
- Coesel, S. N., Baumgartner, A. C., Teles, L. M., Ramos, A. A., Henriques, N. M., Cancela, L., & Varela, J. C. S. (2008). Nutrient limitation is the main regulatory factor for carotenoid accumulation and for Psy and Pds steady state transcript levels in Dunaliella salina (Chlorophyta) exposed to high light and salt stress. Marine Biotechnology, 10(5), 602-611.
- Lamers, P. P., Janssen, M., De Vos, R. C., Bino, R. J., & Wijffels, R. H. (2012). Carotenoid and fatty acid metabolism in nitrogen-starved Dunaliella salina, a unicellular green microalga. Journal of biotechnology, 162(1), 21-27.
- Tafreshi, A. H., & Shariati, M. (2006). Pilot culture of three strains of Dunaliella salina for β-carotene production in open ponds in the central region of Iran. World Journal of Microbiology and Biotechnology, 22(9), 1003-1006.
- Shaker, S., Morowvat, M. H., & Ghasemi, Y. (2017). Effects of Sulfur, Iron and Manganese Starvation on Growth, β-carotene Production and Lipid Profile of Dunaliella salina. Journal of Young Pharmacists, 9(1).
- Borowitzka, M. A., & Siva, C. J. (2007). The taxonomy of the genus Dunaliella (Chlorophyta, Dunaliellales) with emphasis on the marine and halophilic species. Journal of Applied Phycology, 19(5), 567-590.
- Helena, S., Zainuri, M., & Suprijanto, J. (2016). Microalgae Dunaliella salina (Teodoresco, 1905) growth using the LED light (light limiting dioda) and different media. Aquatic Procedia, 7, 226-230.
- Borowitzka, L. J., & Borowitzka, M. A. (1990). Commercial production of β-carotene by Dunaliella salina in open ponds. Bulletin of marine science, 47(1), 244-252.
- Zainuri, M., Kusumaningrum, H., & Kusdiyantini, E. (2006). Microbiological and Ecophysiological Characterisation of Green Algae Dunaliella sp. for Improvement of Carotenoid Production. Natur Indonesia, 10.
- Mil'ko, E. (1963). Effect of various environmental factors on pigment production in the alga Dunaliella salina. Microbiologiya, 32, 299-307.
- Massyuk, N., & Abdula, E. (1969). First experiment of growing carotene-containing algae under semi-industrial conditions. Bot. Zh, 26, 21-27.
- Ben‐Amotz, A., Katz, A., & Avron, M. (1982). Accumulation of β‐carotene in halotolerant alge: purification and characterization of β‐carotene‐rich globules from Dunaliella bardawil (Chlorophyceae) 1. Journal of Phycology, 18(4), 529-537.
- Borowitzka, M. A., Borowitzka, L. J., & Kessly, D. (1990). Effects of salinity increase on carotenoid accumulation in the green alga Dunaliella salina. Journal of Applied Phycology, 2(2), 111-119.
- Porra, R., Thompson, W., & Kriedemann, P. (1989). Determination of accurate extinction coefficients and simultaneous equations for assaying chlorophylls a and b extracted with four different solvents: verification of the concentration of chlorophyll standards by atomic absorption spectroscopy. Biochimica et Biophysica Acta (BBA)-Bioenergetics, 975(3), 384-394.
- Wu, X., Zarka, A., & Boussiba, S. (2000). A simplified protocol for preparing DNA from filamentous cyanobacteria. Plant Molecular Biology Reporter, 18(4), 385-392.
- Sambrook, J., & Russell, D. W. (2006). Purification of nucleic acids by extraction with phenol: chloroform. Cold Spring Harbor Protocols, 2006(1), pdb. prot4455.
- Yaiche-Achour, H., Doumandji, A., Bouras, N., Sabaou, N., & Assunҫão, P. (2018). Isolation, Molecular Identification and The Carotenogenesis Process of the Microalgae Dunaliella salina Strain DunaDZ1 Isolated from an Algerian Salt Lake. Turkish Journal of Fisheries and Aquatic Sciences, 19(5), 399-407.
- Kim, S.-H., Liu, K.-H., Lee, S.-Y., Hong, S.-J., Cho, B.-K., Lee, H., . . . Choi, H.-K. (2013). Effects of light intensity and nitrogen starvation on glycerolipid, glycerophospholipid, and carotenoid composition in Dunaliella tertiolecta culture. PLoS One, 8(9), e72415.
- Mulders, K. J., Lamers, P. P., Martens, D. E., & Wijffels, R. H. (2014). Phototrophic pigment production with microalgae: biological constraints and opportunities. Journal of Phycology, 50(2), 229-242.
- Park, S., Lee, Y., & Jin, E. (2013). Comparison of the responses of two Dunaliella strains, Dunaliella salina CCAP 19/18 and Dunaliella bardawil to light intensity with special emphasis on carotenogenesis. Algae, 28(2), 203-211.
- Salguero, A., de la Morena, B., Vigara, J., Vega, J. M., Vilchez, C., & León, R. (2003). Carotenoids as protective response against oxidative damage in Dunaliella bardawil. Biomolecular Engineering, 20(4-6), 249-253.
- Orset, S. C., & Young, A. J. (2000). Exposure to low irradiances favors the synthesis of 9-cis β, β-carotene in Dunaliella salina (Teod.). Plant Physiology, 122(2), 609-618.
- Lamers, P. P., Janssen, M., De Vos, R. C., Bino, R. J., & Wijffels, R. H. (2012). Carotenoid and fatty acid metabolism in nitrogen-starved Dunaliella salina, a unicellular green microalga. Journal of Biotechnology, 162(1), 21-27.
- Lers, A., Biener, Y., & Zamir, A. (1990). Photoinduction of massive β-carotene accumulation by the alga Dunaliella bardawil: Kinetics and dependence on gene activation. Plant physiology, 93(2), 389-395.
- Xu, Y., Ibrahim, I. M., & Harvey, P. J. (2016). The influence of photoperiod and light intensity on the growth and photosynthesis of Dunaliella salina (chlorophyta) CCAP 19/30. Plant Physiology and Biochemistry, 106, 305-315.
- Niyogi, K. K., Björkman, O., & Grossman, A. R. (1997). The roles of specific xanthophylls in photoprotection. Proceedings of the National Academy of Sciences, 94(25), 14162-14167.
- Pogson, B. J., Niyogi, K. K., Björkman, O., & DellaPenna, D. (1998). Altered xanthophyll compositions adversely affect chlorophyll accumulation and nonphotochemical quenching in Arabidopsis mutants. Proceedings of the National Academy of Sciences, 95(22), 13324-13329.
- Ben‐Amotz, A. (1996). Effect of low temperature on the stereoisomer composition of β‐Carotene in the halotolerant alga Dunaliella bardawil (Chlorophyta) 1. Journal of Phycology, 32(2), 272-275.
- Del Campo, J. A., Moreno, J., Rodrı́guez, H., Vargas, M. A., Rivas, J. n., & Guerrero, M. G. (2000). Carotenoid content of chlorophycean microalgae: factors determining lutein accumulation in Muriellopsis sp.(Chlorophyta). Journal of Biotechnology, 76(1), 51-59.
- Sansawa, H., & Endo, H. (2004). Production of intracellular phytochemicals in Chlorella under heterotrophic conditions. Journal of Bioscience and Bioengineering, 98(6), 437-444.
- Fu, W., Guðmundsson, Ó., Paglia, G., Herjólfsson, G., Andrésson, Ó. S., Palsson, B. Ø., & Brynjólfsson, S. (2013). Enhancement of carotenoid biosynthesis in the green microalga Dunaliella salina with light-emitting diodes and adaptive laboratory evolution. Applied microbiology and biotechnology, 97(6), 2395-2403.
- de Morais, M. G., Vaz, B. d. S., de Morais, E. G., & Costa, J. A. V. (2015). Biologically active metabolites synthesized by microalgae. BioMed research international, 2015.
- Lohr, M., Im, C.-S., & Grossman, A. R. (2005). Genome-based examination of chlorophyll and carotenoid biosynthesis in Chlamydomonas reinhardtii. Plant physiology, 138(1), 490-515.
- Jahns, P., & Holzwarth, A. R. (2012). The role of the xanthophyll cycle and of lutein in photoprotection of photosystem II. Biochimica et Biophysica Acta (BBA)-Bioenergetics, 1817(1), 182-193.
- Dall'Osto, L., Lico, C., Alric, J., Giuliano, G., Havaux, M., & Bassi, R. (2006). Lutein is needed for efficient chlorophyll triplet quenching in the major LHCII antenna complex of higher plants and effective photoprotection in vivo under strong light. BMC Plant Biology, 6(1), 1-20.
- Tamura, K. (1992). Estimation of the number of nucleotide substitutions when there are strong transition-transversion and G+ C-content biases. Mol Biol Evol, 9(4), 678-687.
- Felsenstein, J. (1985). Confidence limits on phylogenies: an approach using the bootstrap. Evolution, 39(4), 783-791.
- Kumar, S., Stecher, G., Li, M., Knyaz, C., & Tamura, K. (2018). MEGA X: molecular evolutionary genetics analysis across computing platforms. Molecular biology and evolution, 35(6), 1547-1549.
Due to technical limitations, table 1 is only available as a download in the Supplemental Files section.