Lignin is the second-most abundant biomass type on Earth, accounting for 30% of the organic carbon [1–3]. Lignin is obtained in large amounts (approximately 60 to 70 million tonnes) as a by-product of the paper and pulp industries. As such, it is one of the most significant renewable organic feedstocks but is currently vastly underutilized compared to cellulose [4]. Lignin is one of the few renewable aromatic biopolymers and stands out for its aromatic nature among other biopolymers [5]. Approximately 98% of lignin is currently used as a source of energy and heat [6].
Based on the plant species, tissue type, and specific cell wall layer, lignin is made up of aromatic units that have different structures and ratios of aromatic units.[7] In general, lignin is made up of phydroxyphenyl (H), guaiacyl (G), and syringyl (S) units. The S, G, and H units interlink with each other by different linkers/bonds: β-O-4 (β-ether), α-O-4, β-β (resinol), and β-5 [8]. The β-O-4, β-β, β-5, PhOMe, PhOH, aliphatic methoxy and aliphatic alcohol, aromatic H, and aldehyde type of lignin substructures and linkages are the prevalent structural fragments that are typically analyzed quantitatively. [8, 9] Analytical techniques can determine the types of monolignols and their contents, the distribution of inter-unit linkages, and the functional groups that make up lignin's chemical structure. For advanced applications of lignin, regardless of the depolymerising approach, fundamental knowledge of its structural features and physicochemical properties is essential [10].
Quantitative NMR (qNMR) spectrometry seems to be the most widespread and versatile technique for the quantitative analysis of lignin [11, 12]. It enables determining numerous structural characteristics of lignin by using 1H [13], 13C [14–16], or 31P [17] (after derivatization) as the nuclei, as well as different two-dimensional techniques [6, 18, 19]. We recently developed an interest in determining the possible accuracy attainable through qNMR analysis of lignin, and we conducted a literature survey [2]. The literature analysis revealed several measurement uncertainty sources inherent in the measurement, e.g., repeatability of spectra (especially if the signal-to-noise ratio is low), the accuracy of peak integration (especially in the case of baseline irregularities), an overlap of signals of interest with other signals, etc.,[16] as well as different NMR-specific uncertainty sources, such as deviations in coupling constant, resonance offset effects, effects of 1H T1 relaxation, etc. [18, 19].
Interestingly, however, very little attention was devoted to possible uncertainty arising from sampling or subsampling of lignin. At the same time it is widely recognised that sampling (or subsampling) is among the most important uncertaintybsources in most of chemical analysis [20–22].
Although lignin can be reasonably homogeneous, it is still a natural material and a solid, and such materials are always, at least to some extent inhomogeneous. Thus, subsamples taken from the same bulk of lignin can well have somewhat different compositions and, therefore, give different NMR spectra.
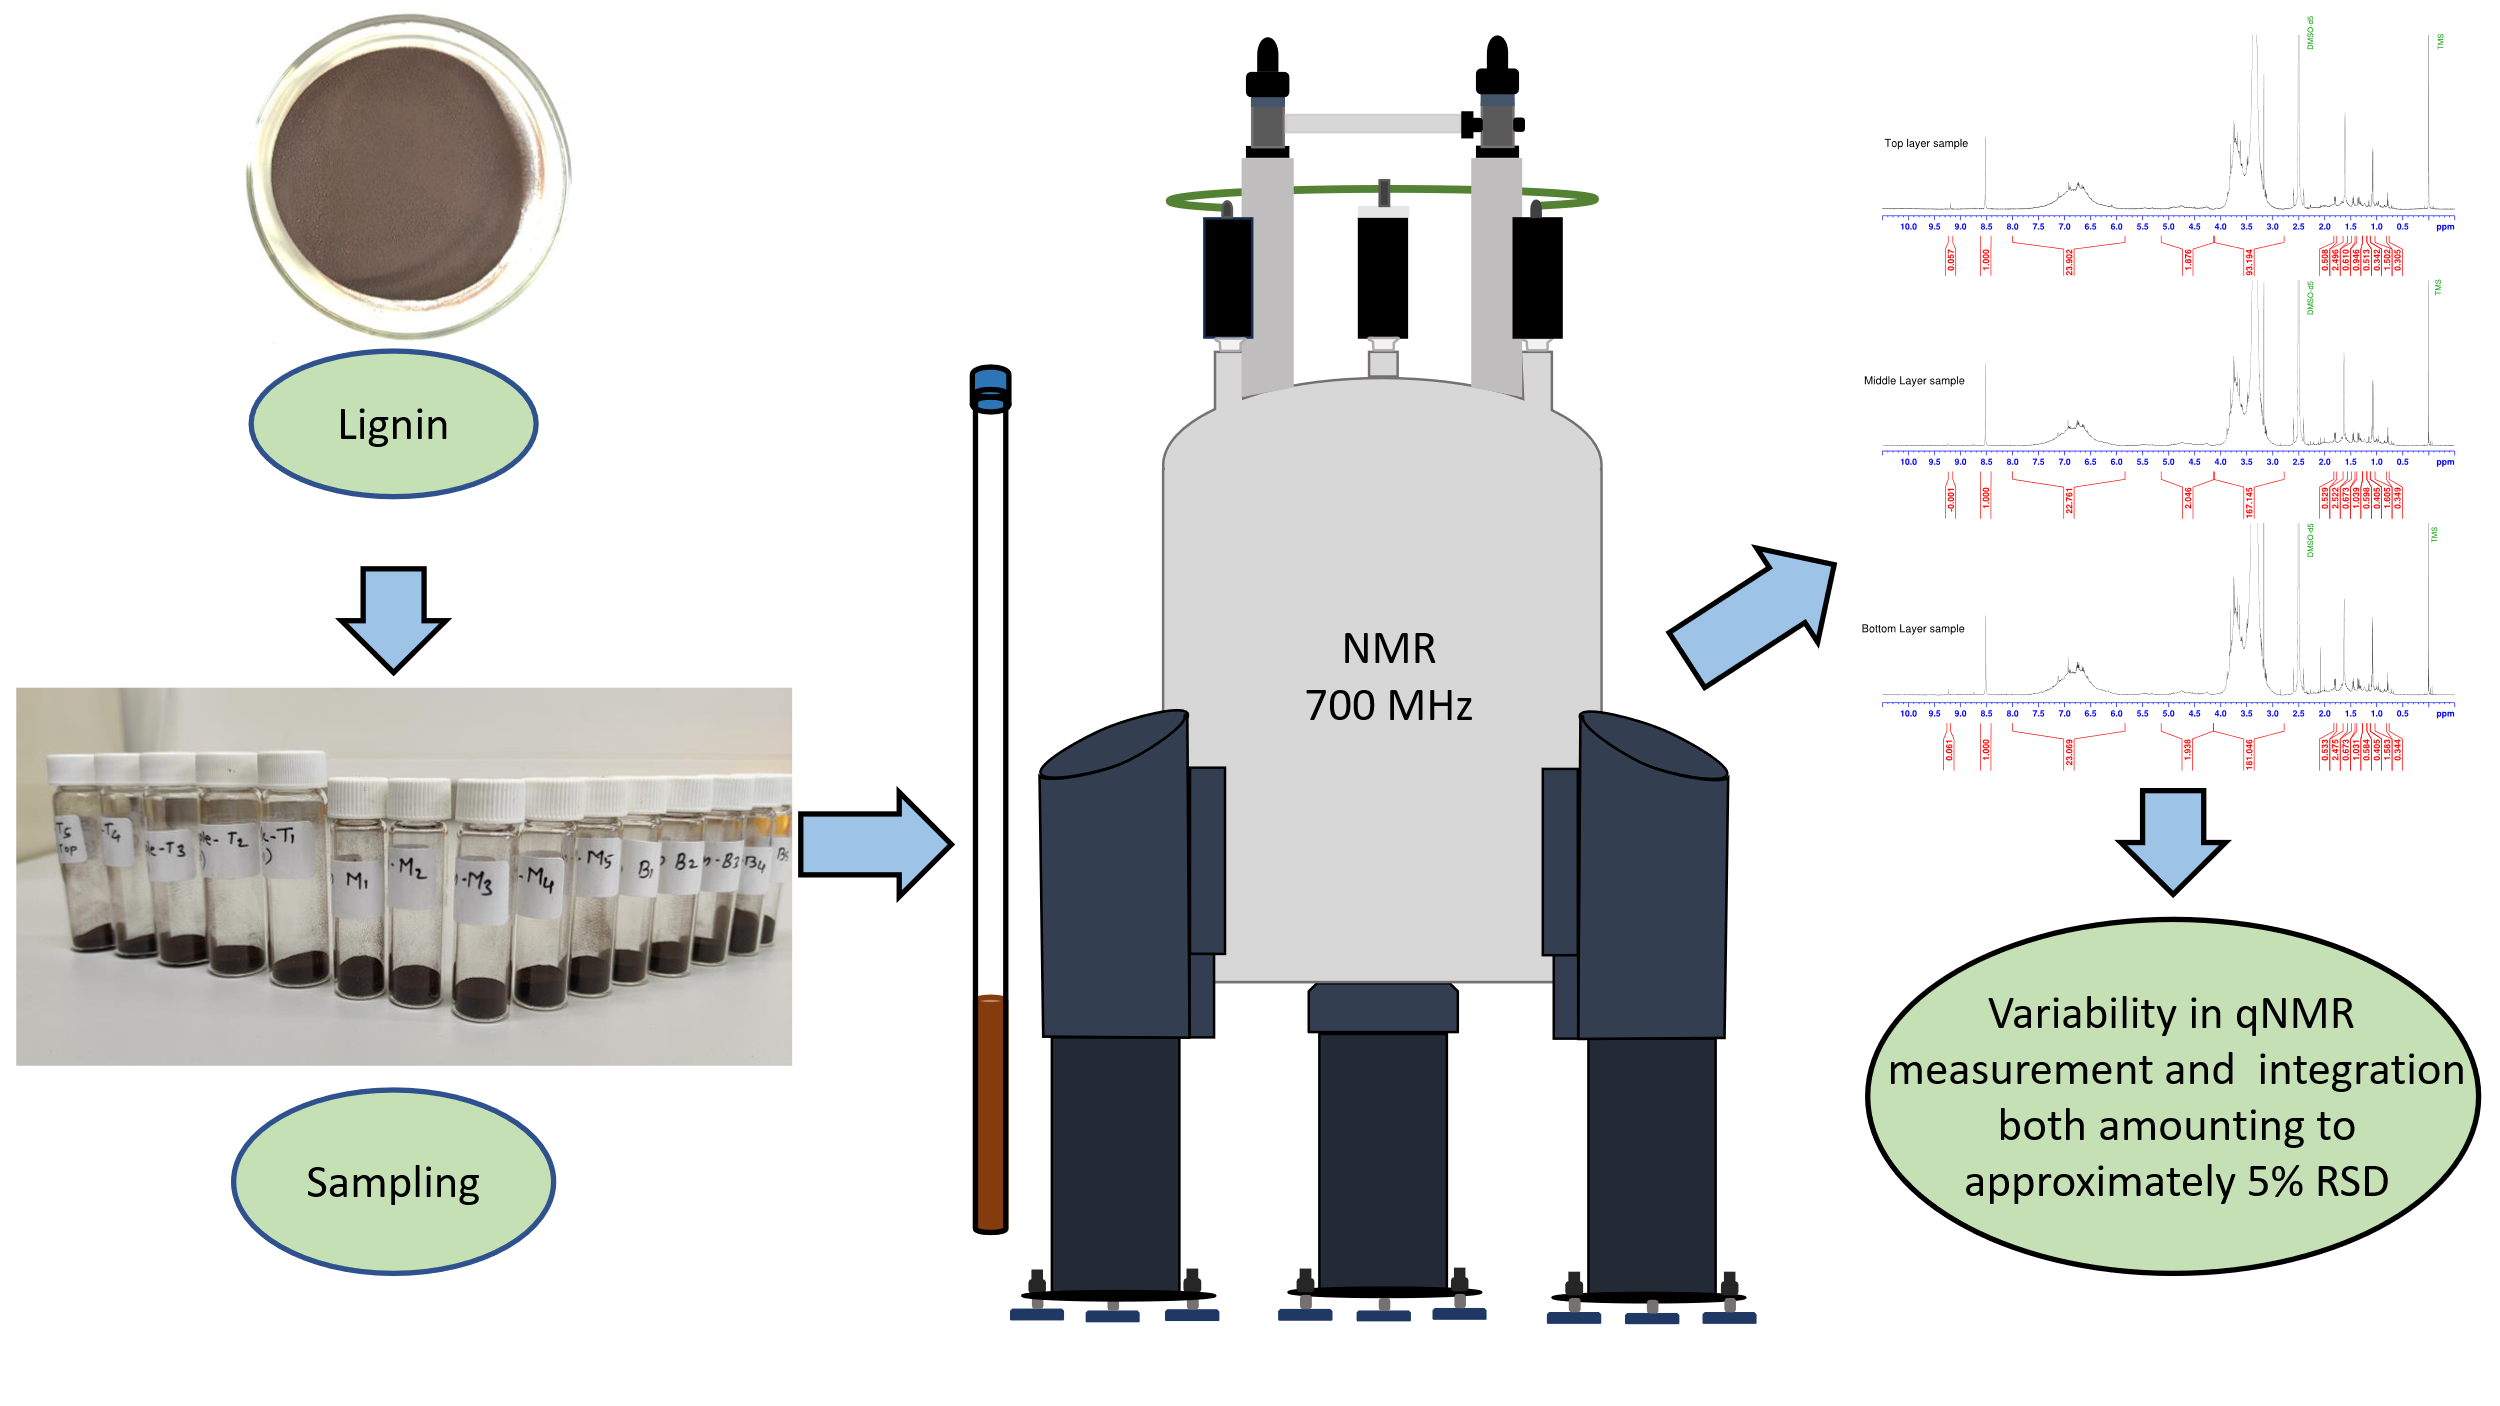
Uncertainty from sampling was mentioned only in a couple of reports [16, 23], and only in one of them was some quantitative data presented [23]. This information enabled us to approximately estimate the subsampling and sample preparation variability, which was found to range from RSD 5–8%. At the same time, in most reports, even the most in-depth ones, sampling/subsampling is not mentioned at all. As a result, in many cases, it is not known whether replicate measurements were carried out using the same or different samples/subsamples. In such cases, when an RSD estimate between replicate measurements is given, its meaning remains quite obscure.
Considering this, we decided to investigate what could be the uncertainty due to the inhomogeneity of subsampling in the analysis of commercial lignin and how it compares with the variability of the NMR spectrometric analysis itself.