Plant materials
Five different experiments were conducted for data collection (Table 1). Experimental samples were all collected from one-year old T. ciliata, grown in a greenhouse in South China Agricultural University (SCAU). For samples from different tissues, mature leaves, young leaves, flowers, shoots, and young stems were collected at 9:00 am on August 25, 2019. Before treatment with the H. robusta, PEG6000, 4℃, and MeJA, all the seedlings were pre-incubated in incubator for seven days with 16 hours of light at 28℃ and 8 hours of dark at 22℃ to mimic the wild environment. For H. robusta treatment, seedlings were exposed to herbivores, and leaves and young stems were harvested after 0, 6, 12, 24, and 36 h. After seedlings were treated with 0%, 5%, 10%, 20%, and 30% (w/v) of PEG6000 for seven days, leaves were collected. For 4℃ treatment, seedlings were placed at 4℃, and samples (leaves) were taken at 0, 6, 12, 24, and 36 h. Seedlings sprayed with MeJA (100μM) were sealed in plastic bags and leaves were collected at 0, 6, 12, 24, and 36 h. Three biological replicates were taken for each sampling point, and all samples were immediately frozen in liquid nitrogen and stored at -80℃.
RNA extraction, quality assessment, and DNA synthesis
Total RNA was extracted from all samples using a HiPure HP Plant RNA Mini Kit (Magen) with DNase treatment to remove genomic DNA. The quality of the RNA was determined with NanoDrop ND1000 (Thermo Scientific). RNA samples with absorbance ratios of A260/A280 and A260/A230 both around 2.0 were selected for further analysis. To synthesize cDNA, 0.5 μg of total RNA was used according to the manufacturer's instructions for the HiScript II Reverse Transcript kit (Vazyme). Five-fold diluted cDNA was used for subsequent RT-qPCR experiments.
Selection of candidate reference genes and primer design
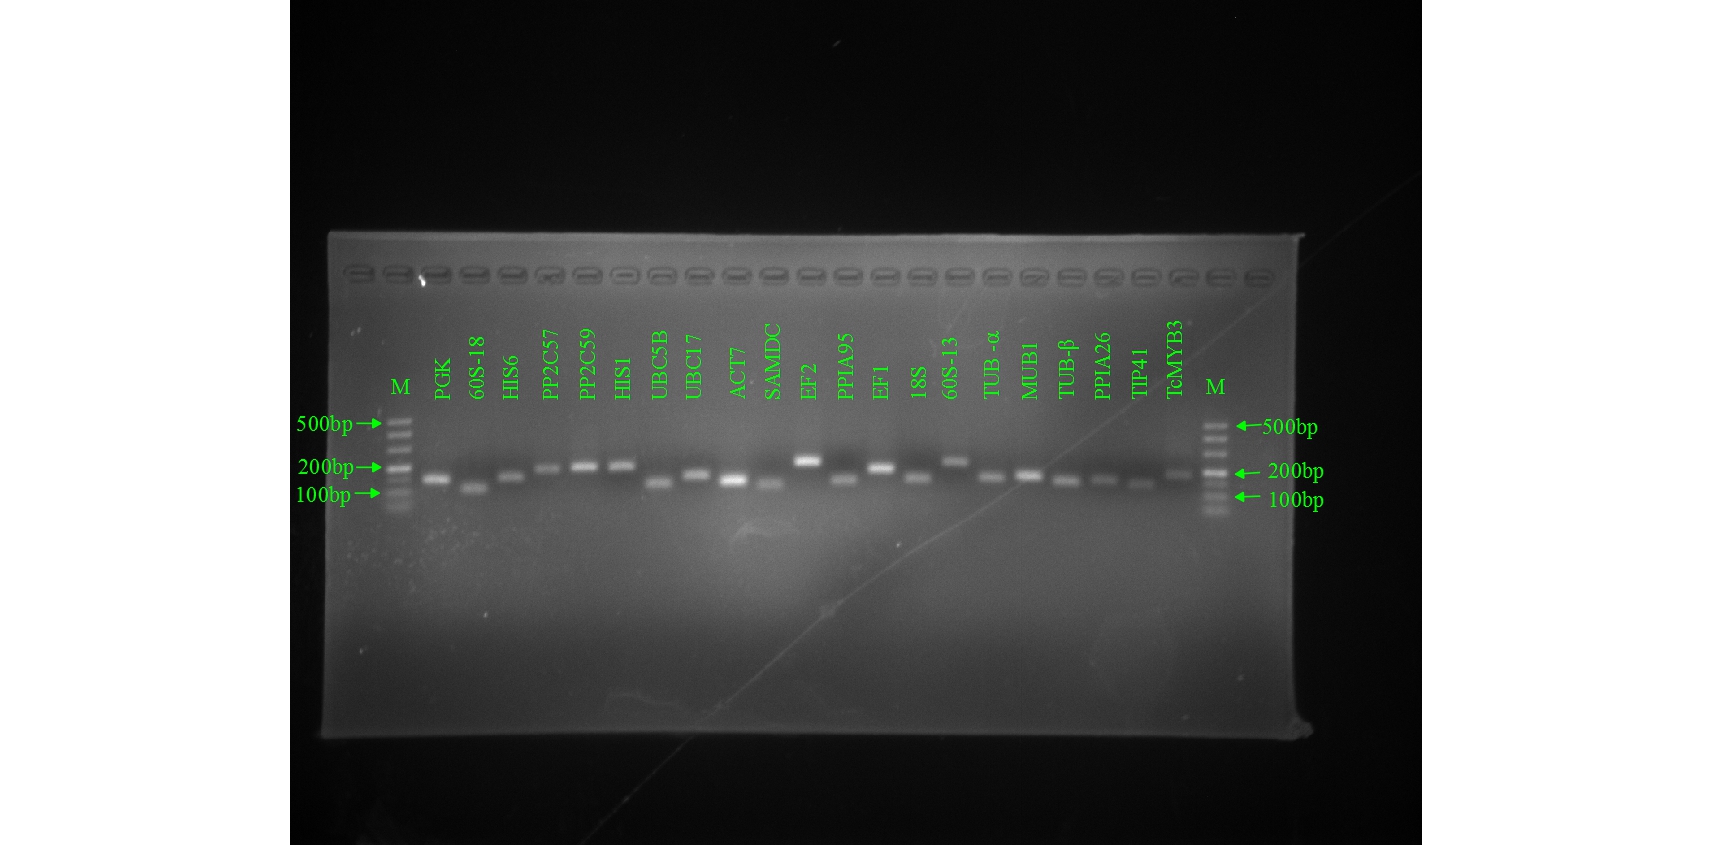
Twenty candidate reference genes were selected from the T. ciliata leaf transcriptome database by reviewing previous literature: PGK, 60S-18, 60S-13, HIS1, HIS6, PP2C57, PP2C59, UBC5B, UBC17, ACT7, SAMDC, EF1, EF2, 18S, TUB-α, TUB-β, MUB1, PPIA26, PPIA95, TIP41. Since there is no genomic sequence data available for T. ciliata, we designed primers based on the sequences in the T. ciliata transcriptome database. Firstly, the Coding Sequence (CDS) and genomic DNA sequences (gDNA) of the candidate reference genes were amplified separately (Table S1), and then the introns and exons of the candidate reference genes were obtained by sequence alignment (NCBI-Blast), and finally primers for RT-qPCR analysis of each reference gene were designed using the web-based Primer-Blast tool from NCBI (https://www.ncbi.nlm.nih.gov/tools/primer-blast/). Apart from 60S-18, SAMDC, TUB-β and PPIA26, RT-qPCR primers were designed across introns. Details of these genes and primers are shown in Table 2.
PCR and RT-qPCR analysis
The volume of each PCR amplification reaction mix was 20 μL, containing 10 μL of Phata Max Buffer, 2 μL of five-fold diluted cDNA, 2 μL of each primer (10 μM), 0.5 μL of dNTP, 0.5 μL of Phata Max Super-Fidelity DNA Polymerase, and 5 μL ddH2O. The PCR reaction procedure was as follows: 95℃ for 3 min, 35 cycles of 95℃ for 15 s, 55℃ for 15 s, 72℃ for 15 s, followed by 5 min extension at 72 °C. The RT-qPCR reaction mixture consisted of 10 μL ChamQ Universal SYBR qPCR Master Mix (Vazyme), 2 μL of cDNA, 0.4 μL of each primer (10 μM), and 7.2 μL ddH2O to a final volume of 20 μL, and it was performed on LightCycler480 (Roche Molecular Biochemicals, Mannheim, Germany) with optical 96-well plate. To test the specificity of the RT-qPCR primers, the products of PCR were analyzed by nucleic acid electrophoresis on a 2% (w/v) gel and the melting curve was included after amplification. All samples used for RT-qPCR analysis had three biological replicates, each containing three technical replicates. In order to calculate the gene-specific PCR efficiency (E) and correlation coefficient (R2) of each gene, a standard curve was generated from the mixed complementary DNA (cDNA) using a fivefold dilution series.
Analysis of stability of expression of candidate reference genes
CT values were obtained by RT-qPCR, and used to evaluate the expression levels of candidate genes in different experimental conditions and tissues. Three commonly employed algorithms, geNorm [24], NormFinder [25], and BestKeeper [26], were used to evaluate the stability of candidate reference genes in different experiments.
The package geNorm (Version3.5) screens stable reference genes by calculating the M value of the stability of each candidate gene, and the criterion is that the smaller the M value is, the higher the stability of the candidate gene is. It also calculates pairwise variations of the normalized factor after introducing a new internal reference gene, and determines the number of optimal internal reference genes based on the ratio Vn / Vn+1. If the value of Vn / Vn+1 is less than 0.15, the number of optimal internal reference genes is n. If the value of Vn / Vn+1 is greater than 0.15, the number of optimal reference genes is n+1. NormFinder selects the most suitable internal reference gene by calculating a stability value for gene expression of the candidates. The lower the stability value is, the more stable the gene is. Using BestKeeper, the SD and CV of expression of each candidate gene can be obtained. The CV±SD values of different genes were then compared to determine the relative stability of expression of the candidates. Finally, in order to generate an overall ranking of candidate genes from the data generated by geNorm, NormFinder, and BestKeeper, we used the RankAggreg (version 0.6.5) software package in R as previously described [14, 55-57]. RankAggreg is an algorithmic package that can combine different ranking lists. Based on the size of the rankings list, we used the Cross-Entropy Monte Carlo algorithm [34]. The rankings list previously generated by the three packages were used as input with the following parameters: the distance was calculated using Spearman's Footrule function, with rho set at 0.1, the seed at 100, and the “convIn” argument at 50.
Validation of reference genes
In order to verify the accuracy of the rankings and the stability of expression of the selected reference genes, the two most stable reference genes, alone and in combination, and the two most unstable reference genes, as recommended by RankAggreg were used to verify the relative expression of TcMYB3 under 4℃, MeJA, PEG6000, in different tissues, and under H. robusta treatment (leaves and young stems). Finally, we used the 2-△△CT method to calculate the relative expression levels of the verified genes, where △CT = CT (target gene)-CT (reference gene), △△CT = △CT(treatment)-△ CT (control), 2-△△CT = relative expression. Three technical replicates were performed for each biological sample [58].