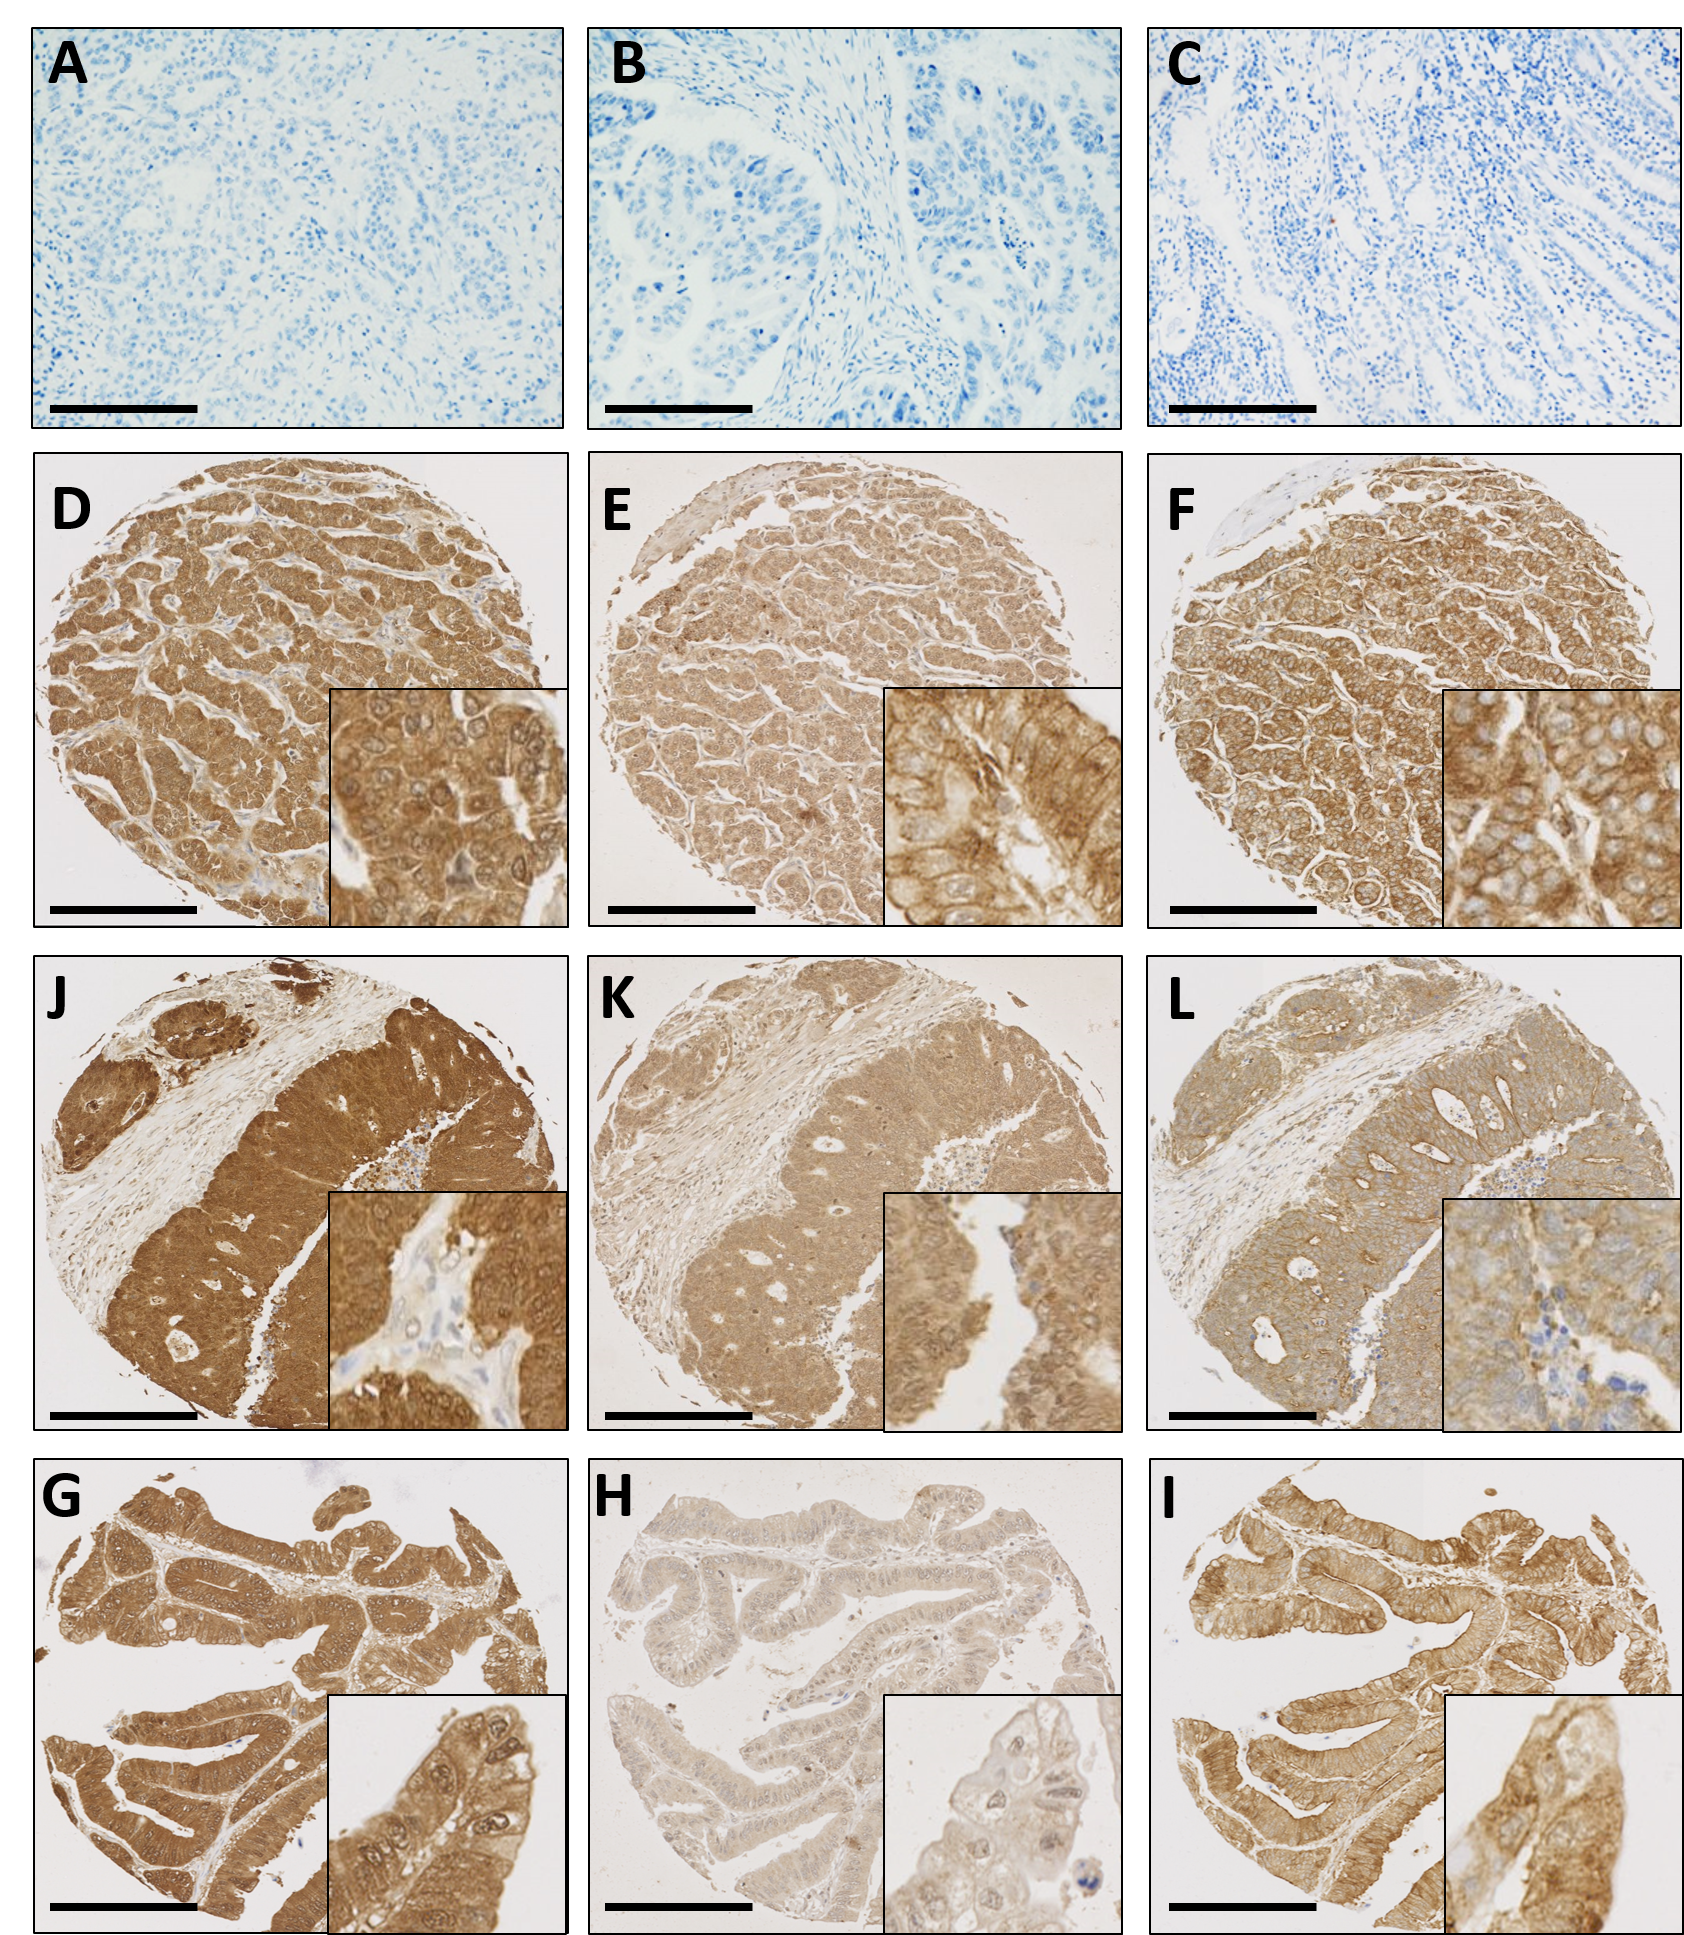
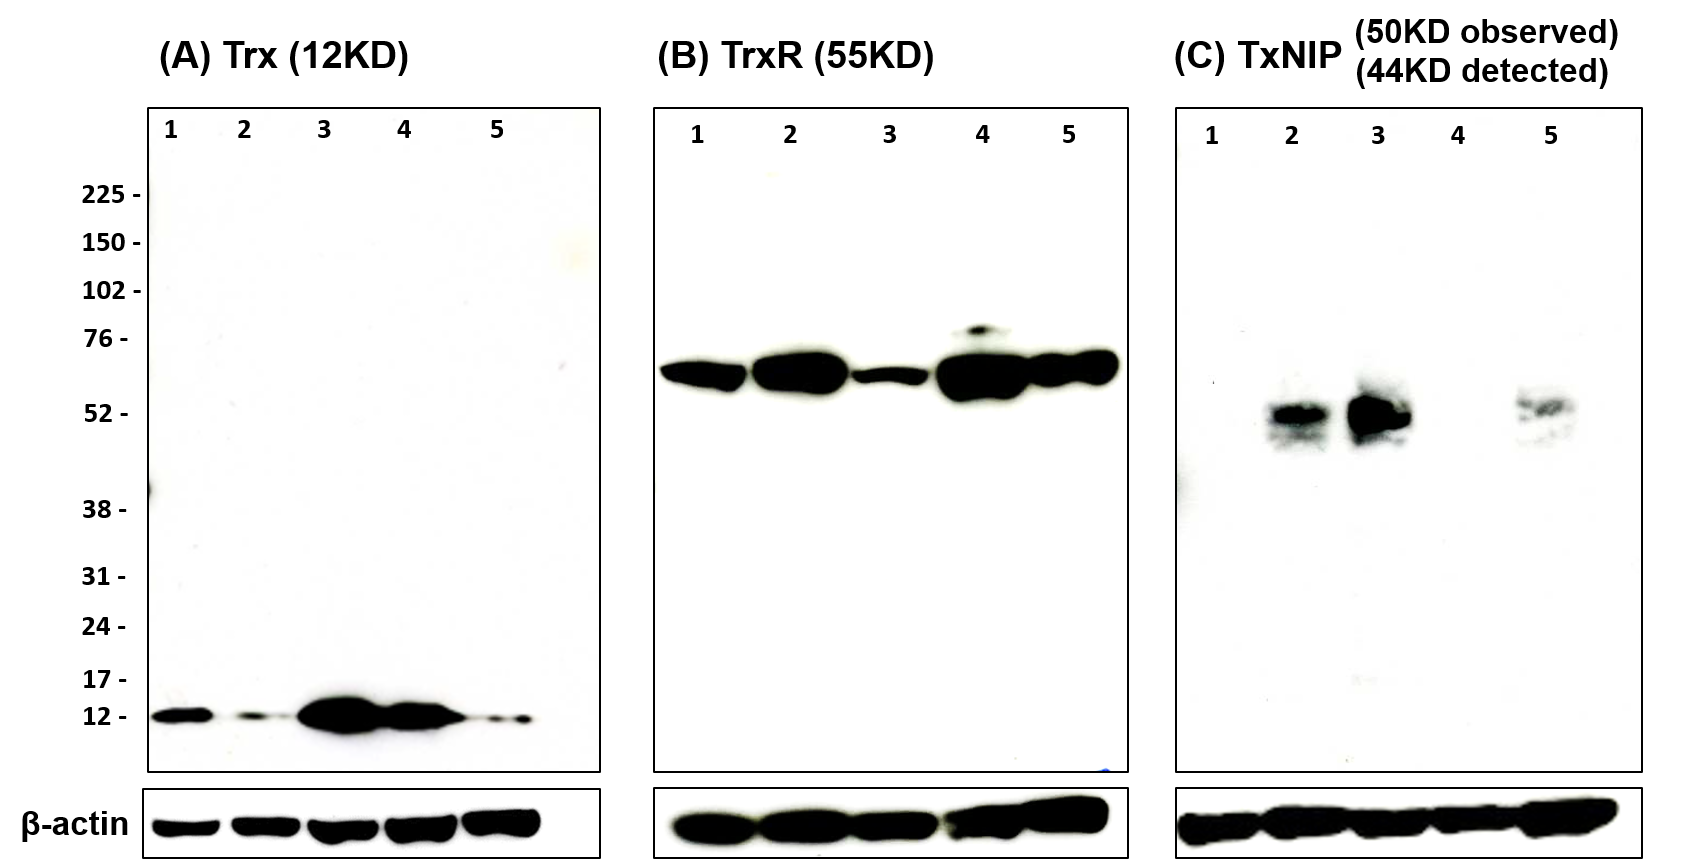
Antibody specificity was determined prior to immunohistochemical staining (supplementary figure 1). Figure 1 shows representative photomicrographs of different staining patterns, i.e. weak, moderate or strong staining of cytoplasmic or nuclear expressision, of Trx system protein expression from PAD TMAs. Supplementary figure 2 shows representative photomicrographs of staining of Trx system protein expression from the carcinomas of the pancreas, bile duct and ampulla TMAs.
In the PAD cohort, cytoplasmic Trx had a median H-score of 210 with values ranging from 100 to 300; nuclear Trx had a median H-score of 225 and ranged from 50 to 300; cytoplasmic TxNIP had a median H-score of 150 and ranged from 0 to 267; cytoplasmic TrxR had a median H-score of 75 and ranged from 0 to 225; nuclear TrxR had a median H-score of 75 and ranged from 0 to 225. The X-tile cut point for cytoplasmic Trx was 160, nuclear Trx was 234, cytoplasmic TxNIP was 217, cytoplasmic TrxR was 58 and nuclear TrxR was 58; with 82.0% (61/74), 45.2% (33/73), 17.5% (14/80), 61.8% (47/76) and 61.8% (47/76) having high protein expression respectively.
In the bile duct and ampullary carcinoma cohort, cytoplasmic Trx had a median H-score of 150 and ranged from 0 to 300; nuclear Trx had a median H-score of 166.7 and ranged from 0 to 300; cytoplasmic TxNIP had a median H-score of 166.7 and ranged from 0 to 300; cytoplasmic TrxR had a median H-score of 66.7 and ranged from 0 to 250; nuclear TrxR had a median H-score of 66.7 and ranged from 0 to 250. The X-tile cut point for cytoplasmic Trx was 142, nuclear Trx was 133, cytoplasmic TxNIP was 85, cytoplasmic TrxR was 167 and nuclear TrxR was 75; with 60.2 % (77/128), 63.3% (81/128), 75.6% (99/131), 10.7% (14/131) and 47.4% (63/133) having high protein expression respectively.
The correlation between expression levels of the proteins with one another was assessed using the Spearman rank correlation coefficient. In the PAD cohort, cytoplasmic TxNIP expression had a statistically significant, albeit weak, correlation with cytoplasmic TrxR (r = 0.234, P = 0.038) and nuclear TrxR expression (r = 0.241, P = 0.032). In addition, cytoplasmic TrxR expression was strongly correlated nuclear TrxR expression (r = 0.711, P < 0.001). Nuclear expression of Trx was also correlated with cytoplasmic Trx expression (r = 0.549, P < 0.001).
In the bile duct and ampullary tumours, cytoplasmic Trx expression had a statistically significant and strong correlation with nuclear Trx expression (r = 0.653, P < 0.001), cytoplasmic TrxR expression (r = 0.436, P < 0.001) and nuclear TrxR expression (r = 0.328, P < 0.001). In addition, nuclear Trx expression correlated with cytoplasmic TrxR expression (r = 0.2, P = 0.25) and nuclear TrxR expression (r = 0.376, P < 0.001). Cytoplasmic TrxR expression correlated strongly with nuclear TrxR expression (r = 0.653, P < 0.001).
Associations with clinicopathological criteria
Levels of protein expression were assessed in light of clinicopathological criteria in the PAD and the bile duct and ampullary cancer cohorts to determine associations. In the PAD cohort, the only association observed was between high cytoplasmic TrxR expression and lymph node metastasis (χ2 = 4.533, d.f. = 1, P = 0.033) (Supplementary Tables 1 and 2).
In bile duct and ampullary cancers, high expression of cytoplasmic TxNIP and of nuclear TrxR and were associated with patients aged above 60 years (χ2 = 3.892, d.f. = 1, P = 0.049 and χ2 = 5.091, d.f. = 1, P = 0.024 respectively) (Table 2). Associations were also observed between high nuclear TrxR expression and the presence of venous invasion (χ2 = 10.548, d.f. = 1, P = 0.001) and the presence of perineural invasion (χ2 = 5.314, d.f. = 1, P = 0.021). Low TxNIP expression associated with the presence of perineural invasion (χ2 = 5.044, d.f. = 1, P = 0.025) (Table 3).
Relationship with clinical outcome
In the PAD cohort, high expression of both cytoplasmic and nuclear Trx were significantly associated with better overall survival (P = 0.018 and P = 0.006 respectively) (Figure 2, panel A and B). Cytoplasmic TrxR, nuclear TrxR and cytoplasmic TxNIP expression showed no association with overall survival (Figure 2 panel C, D and E).
In multivariate Cox-regression, potentially confounding factors of gender, age, tumour size, grade, stage, lymph node status, perineural and venous invasion were included even though not independently associated with survival; with individual Kaplan-Meier statistics of P = 0.380, P = 0.694 P = 0.419, P = 0.820, P = 0.349, P = 0.063, P = 0.163 and P = 0.491 respectively. Nuclear Trx expression remained significant for survival in multivariate analysis (Hazard Ratio (HR) = 0.316; 95% Confidence Interval (95% CI) = 0.174-0.573; P < 0.001) whilst cytoplasmic Trx was not significant (HR = 0.5; 95% CI = 0.218 -1.146; P = 0.102) (Table 4 panel A and B).
In cancers of the bile duct and ampulla, cytoplasmic Trx, nuclear Trx, cytoplasmic TrxR and nuclear TrxR expression showed no association with overall survival (Figure 3, panel A, B, C and D). However, high expression of cytoplasmic TxNIP significantly associated with better overall survival (P = 0.0002) (Figure 3, panel E), which remained significant in multivariate Cox-regression analysis (HR = 0.548; 95%CI = 0.340-0.882; P = 0.013) (Table 5). In the multivariate Cox-regression for this cohort the potential confounding factors of patient grade, stage, lymph node status, perineural and venous invasion were included and were significantly associated with survival, with individual Kaplan-Meier statistics of P = 0.011, P = 0.004, P = 0.003 P = 0.001 and P = 0.012 respectively.
As Trx and TrxR were expressed in both nucleus and cytoplasm, data were also analysed by grouping patients into combinations based upon expression profiles, i.e. low nuclear staining with low cytoplasmic, low nuclear with high cytoplasmic, high nuclear with low cytoplasmic and high nuclear with high cytoplasmic. In the PAD cohort, no significant correlation was observed in the combination analysis between nuclear and cytoplasmic expression of Trx or TrxR.
Equally, in the bile duct and ampullary carcinoma cohort, no significant correlation was observed from the analysis of combined nuclear and cytoplasmic TrxR expression. However, low nuclear with high cytoplasmic expression of Trx (n=14) showed longer overall survival than other three subgroups (n=114); either against each separate subgroup (P = 0.017) (Figure 4A) or when the three subgroups were combined together (P = 0.002) (Figure 4B).