Differences in the expression of SLC1A5 are associated with poor prognosis in glioma
The results showed that the expression levels of SLC1A5 were higher in GBM than in LGG (Fig. 1a). In addition, the high SLC1A5 expression group had a shorter Overall Survival (OS) than the low expression category in both the TCGA (p < 0.001) and CGGA (p < 0.001) databases (Fig. 1b, c). The study then investigated the expression pattern of SLC1A5 based on different clinical characteristics, including grade, age, IDH status and 1p19q status. The findings revealed significant differences (p < 0.001) in the expression levels of SLC1A5 between grade, IDH status and 1p19q status (Fig. 1d-k) in both the TCGA and CGGA databases. Additionally, univariate and multivariate survival analyses showed that SLC1A5 was an independent risk factor for OS. Other independent risk factors included grade and age, in both databases (Fig. 1l, m). ROC curve analysis in the TCGA database also showed that SLC1A5 had a significant prognostic value (one-year AUC = 0.712, three-year AUC = 0.695, five-year AUC = 0.695) and this was verified in the CGGA database (Fig. 1n, o). These results therefore indicated that SLC1A5 can be used as an independent risk factor to predict the survival time of patients with glioma.
SLC1A5 plays a role in immune responses and regulates tumor related signaling pathways
In order to assess the function of SLC1A5 and the signaling pathways involved, the study used the median expression of SLC1A5 to group patients into the high and low expression categories. GSEA was then applied to determine whether the two groups had significant enrichment in KEGG signaling pathways and molecular functions. Thereafter, the GSEA results were imported into the cytoscape software to construct a network and perform cluster analysis. The results showed that SLC1A5 was enriched in immune responses and the top three clustering results involved activation of alpha beta T cells, mediated immunoglobulin immunity cytotoxicity and migration of macrophage chemotaxis extravasation leukocytes (Fig. 2a). Additionally, KEGG pathway analysis revealed that several immune-related and tumor signaling pathways were enriched in the high-risk group. Such included the p53 signaling pathway, JAK-STAT signaling pathway, pancreatic cancer, pathways in cancer, B cell receptor signaling pathway, T cell receptor signaling pathways, natural killer cell mediated cytotoxicity and the intestinal immune network for IgA production (Fig. 2b). These results therefore suggested that SLC1A5 might be involved in tumor immune responses to regulate tumor progression.
Association between SLC1A5 and immune cells in LGG
The study then examined the relationship between the expression levels of SLC1A5 and infiltration of immune cells in glioma. Therefore, the levels of immune cell infiltration between the high and low SLC1A5 expression groups were analyzed. The results showed significant differences in the levels of T cells CD8, T cells regulatory (Tregs) between the high and low SLC1A5 expression groups in LGG (p < 0.05) as shown in (Fig. 3a). However, only the levels of activated dendritic cells were different between the high and low SLC1A5 expression groups in GBM (p = 0.038). Moreover, the study used the SCNA module of the TIMER database to verify the association between the copy numbers of the SLC1A5 gene and the immune infiltration levels. The findings revealed that the levels of B cell, CD8 + T cell, CD4 + T cell, macrophage, neutrophil and dendritic cell infiltration were associated with the copy numbers of SLC1A5 in LGG (Fig. 3b). Furthermore, a heatmap of the relationships between the levels of tumor-infiltrating lymphocytes and expression of SLC1A5 showed that LGG had the most significant results among all the cancers (Fig. 3c). Based on the correlation between SLC1A5 and each phenotype in the differentiation process of CD8 + T cells, the study further examined the association between SLC1A5 and various CD8 + signatures. The results showed that SLC1A5 was positively correlated with all the T cell clusters in the TCGA cohort (Fig. 3d). In addition, the correlation between SLC1A5 expression and the gene signatures of CD8 + T cells in LGG was analyzed. The results showed that HLA-DMB, C3AR1, FCER1g and CD37 had a significant correlation with SLC1A5 (Fig. 3e-g). These results suggested that SLC1A5 was involved in the infiltration of immune cells in LGG.
The prognostic value of SLC1A5-IPS in LGG
The TISIDB database was used to assess the correlation between SLC1A5 expression and immunomodulators in LGG through spearman’s correlation analysis (Additional file 1: Tab. S1). 27 immunostimulators were identified, including C10orf54, CD276, CD40, CD48, CD86, CXCR4, ICOSLG, IL6, IL6R, MICB, TMEM173, TMIGD2, TNFRSF14, TNFRSF8, TNFSF13, TNFSF13B, ENTPD1, CXCL12, TNFRSF13C, IL2RA, TNFSF18, CD28, ULBP1, TNFRSF4, TNFRSF25, TNFSF9 and NT5E (p < 0.05) (Fig. 4a). Notably, 16 immunoinhibitors were significantly associated with SLC1A5 (p < 0.05) in LGG. These included CD96, CSF1R, HAVCR2, IDO1, IL10, IL10RB, LGALS9, PDCD1, PDCD1LG2, PVRL2, TGFB1, TGFBR1, CD274, LAG3, CD244 and CD160 (Fig. 4a). Moreover, univariate cox analysis was used to examine the prognostic value of the SLC1A5-related immunomodulators. The findings revealed that 27 immunomodulators were significantly associated with the OS of LGG patients in the TCGA cohort (Fig. 4b). Additionally, the study conducted a LASSO Cox analysis based on the 27 SLC1A5-related immunomodulators in the TCGA cohort (Fig. 4c, d) in order to build the prognostic signature of the SLC1A5-related immunomodulators, for predicting the OS of LGG patients. The analysis generated the prognostic signature containing 12 SLC1A5-IPS then calculated the coefficient of each (Fig. 4e). Based on the coefficients of the 12 immunomodulators, the risk score of each LGG patient in TCGA was calculated after which the patients were divided into the high and low risk groups based on the median risk score. The KM survival curve showed that the low-risk group had a longer OS than the high-risk category (p < 0.0001) and this was verified by the CGGA test cohort (p < 0.0001) as shown in (Fig. 4f, g). Distribution of the risk scores and patients’ survival status in the TCGA and CGGA test cohorts are highlighted in (Fig. 4h, i). Moreover, a ROC curve of the model was plotted and the AUC value of SLC1A5-IPS showed a remarkable predictive ability for OS in the TCGA cohort (1-year AUC = 0.887, 3-year AUC = 0.808, 5-year AUC = 0.764) as shown in (Fig. 4j). The CGGA cohort also demonstrated that SLC1A5-IPS had a similar predictive ability (1-year AUC = 0.689, 3-year AUC = 0.698, 5-year AUC = 0.707) as shown in (Fig. 4k).
Analysis of the prognostic value of the twelve SLC1A5-IPS genes
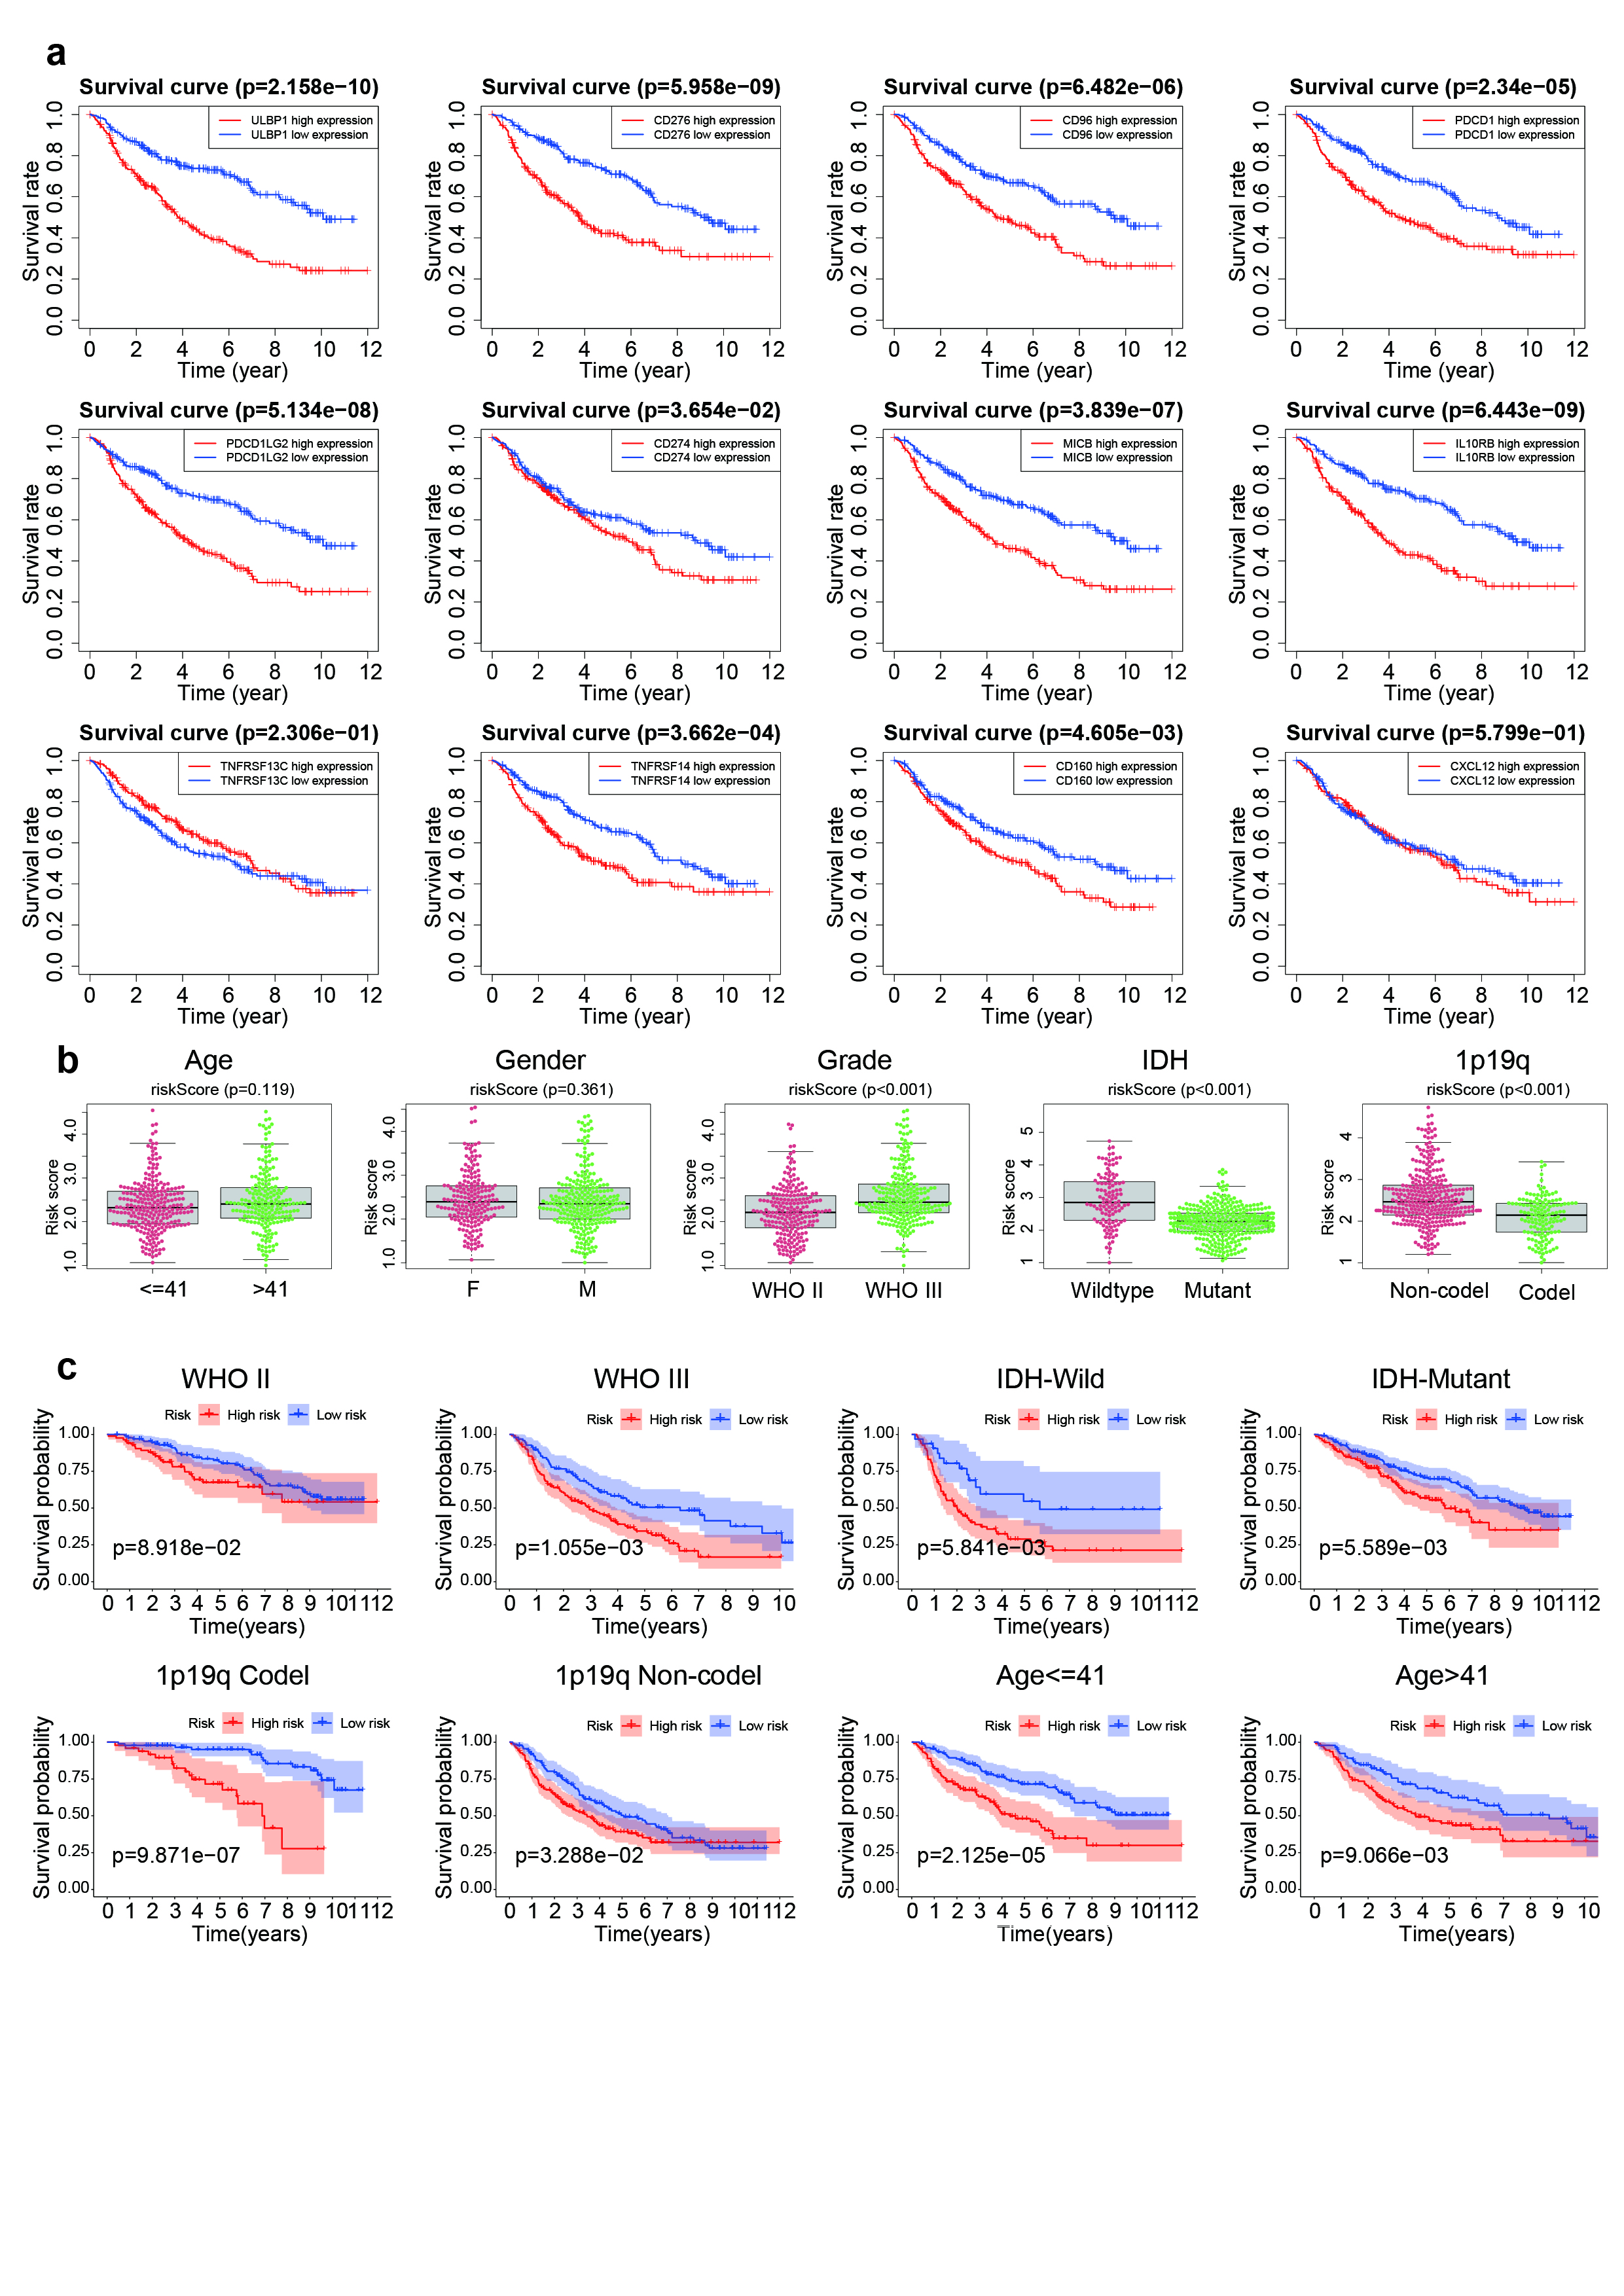
A heatmap of the SLC1A5 expression profiles was plotted to describe the relationship between differences in the expression of SLC1A5 and risk scores, in the TCGA and CGGA databases. The results showed that there was an increase in the expression levels of CD274, ULBP1, TNFRSF14, CD96, PDCD1, PDCD1LG2, MICB, IL10RB and CD276 with an increase in the risk score. However, the was a decrease in the expression levels of CD160, TNFRSF13C and CXCL12 with an increase in the risk score (Fig. 5a, b). Additionally, the study examined the correlation between the expression levels of the SLC1A5-related immunomodulators and the OS of LGG patients, in the CGGA database. The findings revealed that LGG patients with higher expression levels of CD160, CD274, CD276, IL10RB, MICB, ULBP1, CD96, PDCD1, TNFRSF14 and PDCD1LG2 had a shorter survival time than those in the low expression group (p < 0.05) (Fig. 5c-n). The result was validated in the TCGA database (Additional file 1: Fig. S1a). These results therefore indicated that the SLC1A5-IPS genes were associated with poor prognosis in LGG patients.
Stratification analysis of the SLC1A5-IPS
The study further examined whether there was an association between clinical characteristics and the risk scores. The results showed that LGG patients in the TCGA cohort with WHO grade III, 1p19q non-codel and IDH wildtype had higher risk scores. However the risk scores had no association with age and gender (Fig. 6a-e). We also validated these findings in the CGGA cohort (Additional file 1: Fig. S1b). In order to further evaluate the reliability of SLCIA5-IPS in predicting the prognosis of LGG patients with different clinical characteristics, the study analyzed the difference in survival time between the high and low risk score groups. The results showed that the high-risk group was associated with worse prognosis in LGG patients with WHO grade II, WHO grade III, 1p19q Codel and 1p19q non-Codel (Fig. 6f-g, j-k). Similar results were obtained in LGG patients aged < = 41 or > 41 (Fig. 6l, m). In addition, there was no significant difference in the OS of LGG patients with IDH wildtype or IDH mutant between the high and low risk score groups (Fig. 6h, i). In addition, this model was validated in the CGGA dataset (Additional file 1: Fig. S1c). These results therefore indicated that the risk score can be a prognosis predictor of in LGG patients with different clinical characteristics.
SLC1A5-IPS is an independent prognostic factor and was validated using a nomogram
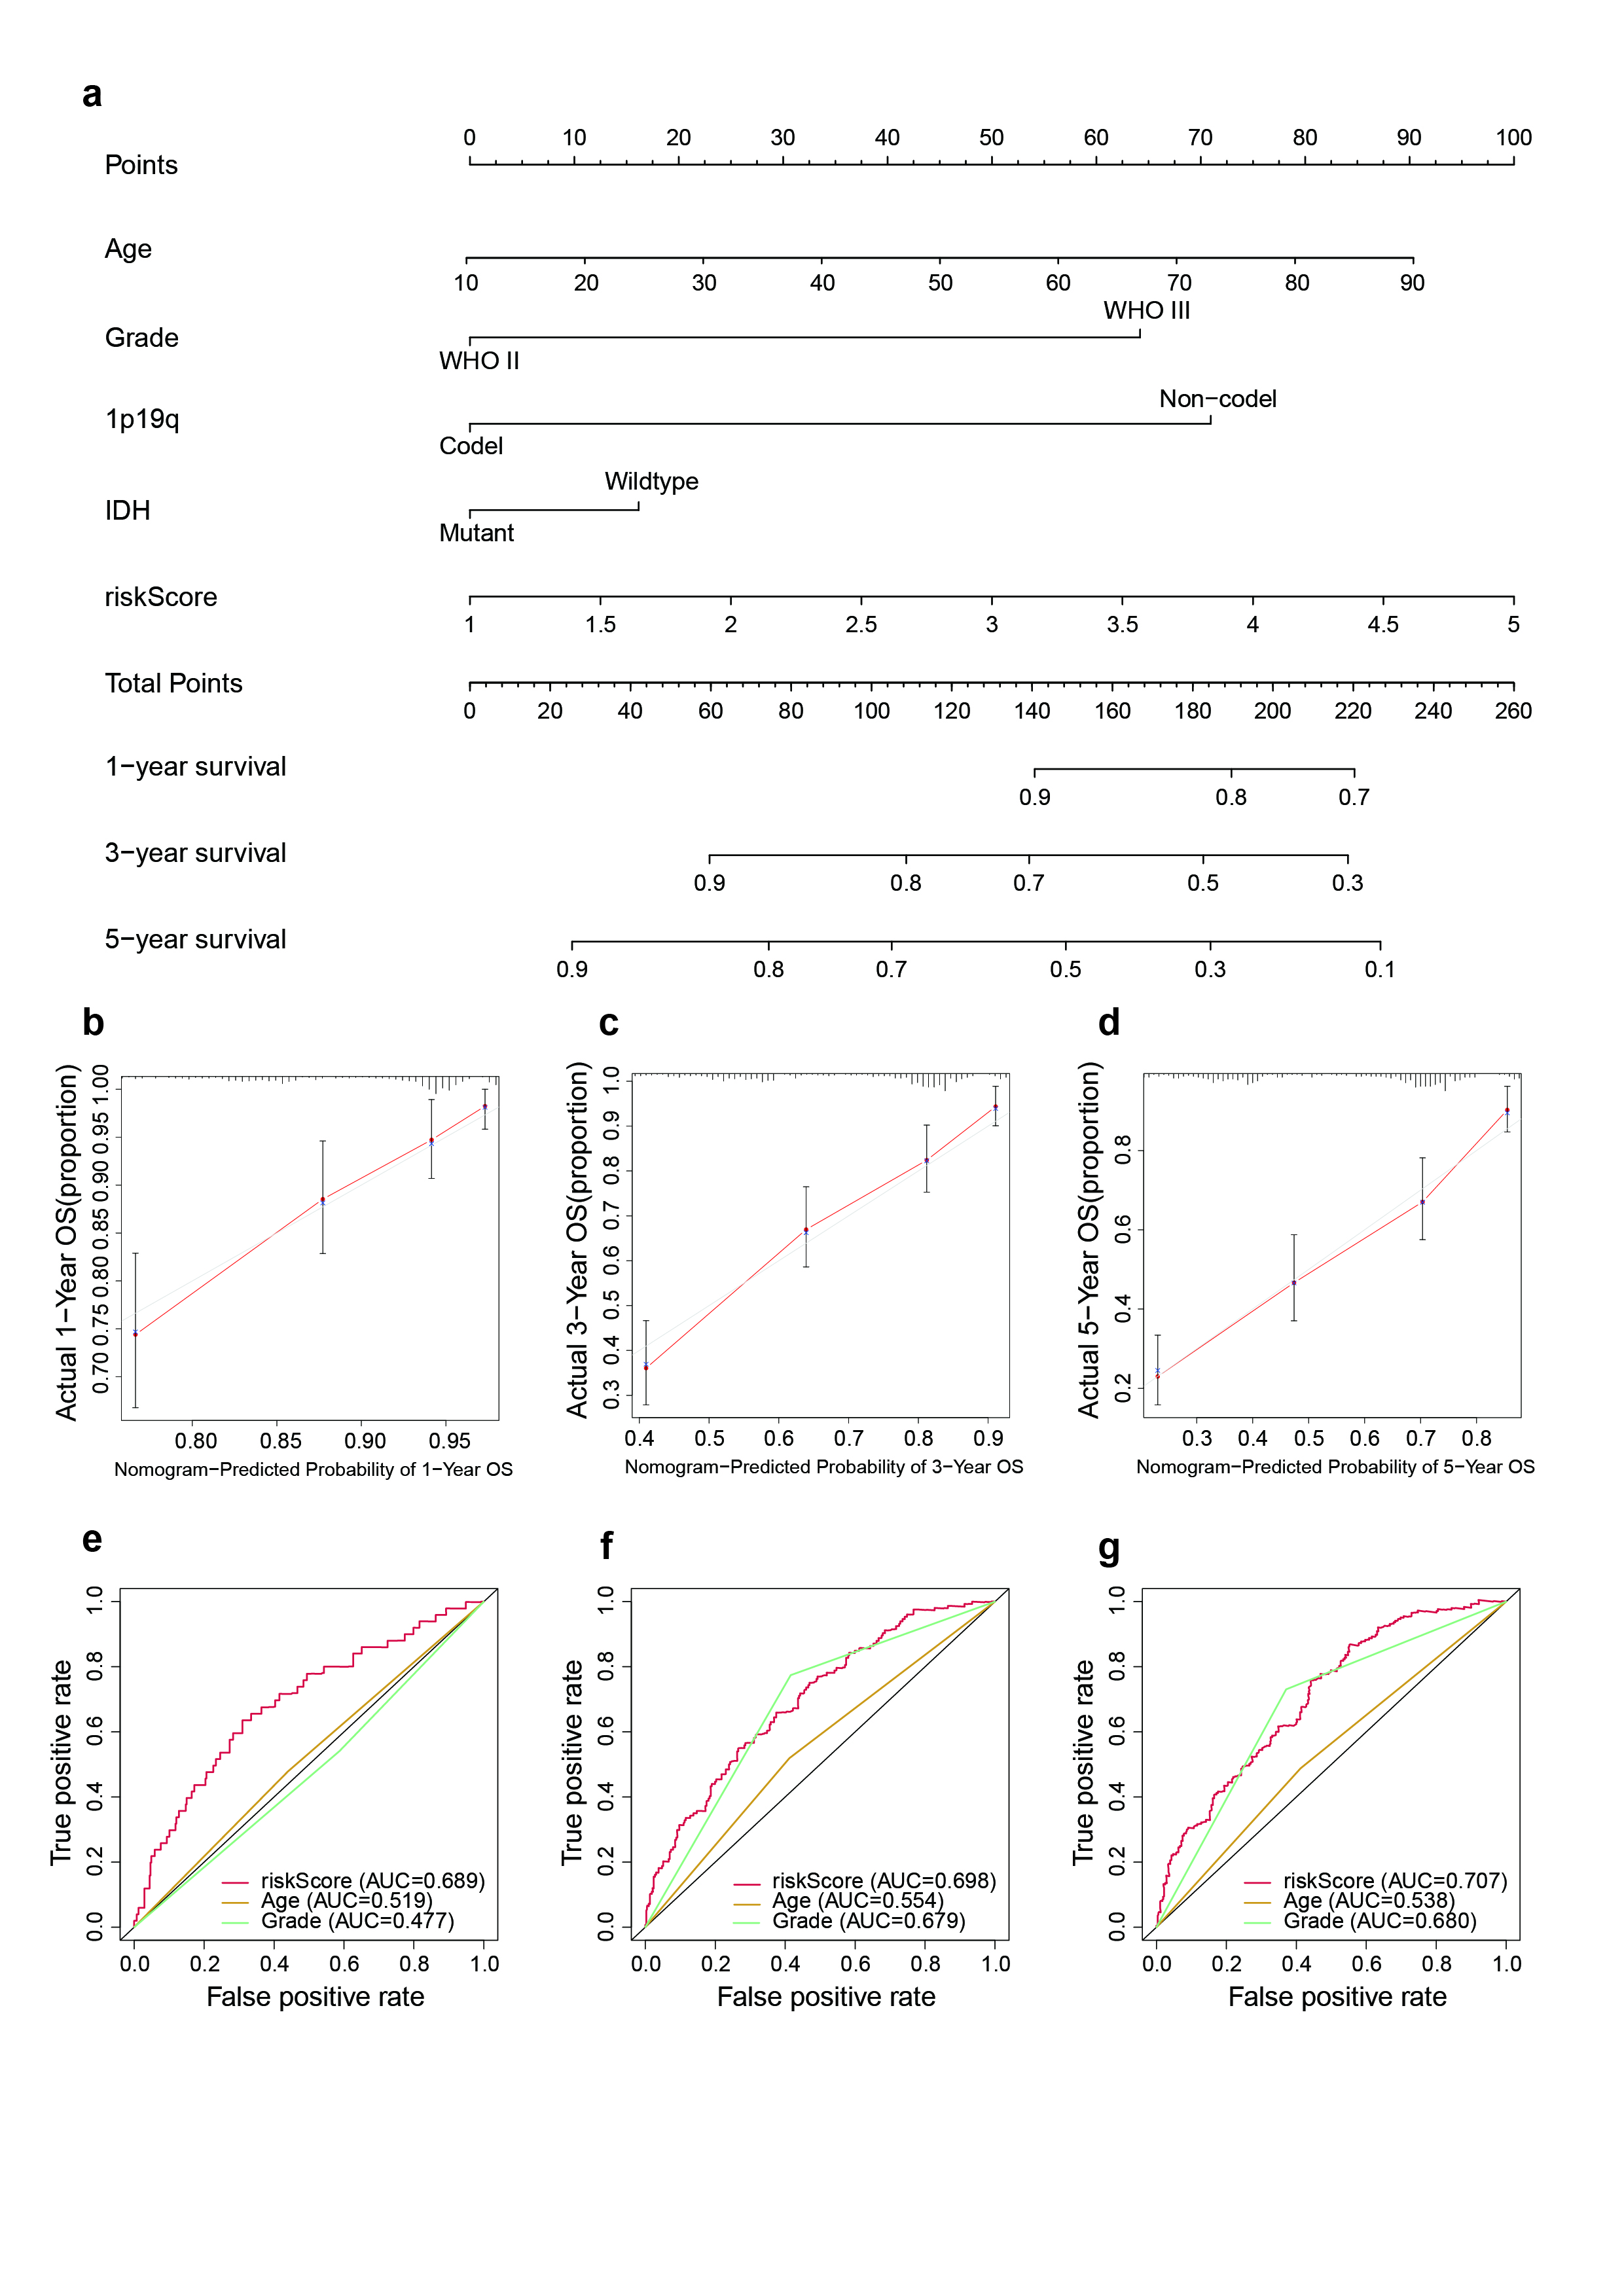
Univariate and multivariate analysis of different prognostic factors in LGG patients were performed. These factors included age, gender, grade, 1p19q, IDH and risk scores. Results from multivariate analysis in the TCGA cohort showed that the risk score could be an independent prognostic factor (HR = 2.223, 95% CI = 1.648-3.000, p < 0.001) (Fig. 7a). Similar results were obtained from multivariate analysis in the CGGA validation cohort (HR = 1.467, 95% CI = 1.168–1.844, p < 0.001) as shown in (Fig. 7b). The results therefore showed that SCL1A5-IPS, as an independent prognostic factor, might be useful for the clinical diagnosis of LGG. Moreover, a nomogram was established using the TCGA and CGGA database to explore the effect of age, grade, IDH, 1p19q and risk scores on the OS of LGG patients (Fig. 7c; Additional file 2: Fig. S2a). Calibration plots of 1-, 3- and 5- year OS showed that the nomogram performed well in the TCGA database (Fig. 7d-f) and CGGA database (Additional file 2: Fig. S2b-d). Additionally, time-dependent ROC curves were plotted to verify the prognostic efficiency of age, grade and risk scores in predicting survival. The AUC of age, grade and risk scores was 0.667, 0.683 and 0.764, respectively (5-year OS) (Fig. 7g-i) and validated in CGGA database (Additional file 2: Fig. S2e-g). Furthermore, the C-index was calculated to evaluate the prediction accuracy of the nomogram in the TCGA database and a stable C-index of 0.868 was obtained. These results indicated that the nomogram was a stable predictive model for OS in LGG patients.
SLC1A5 regulates the proliferative and migratory ability of glioma cells
In order to ascertain the expression levels of SLC1A5 in tumor and normal cell lines, western blot analyses were conducted. The results showed that the expression levels of SLC1A5 were higher in tumor cell lines than in normal cells (Fig. 8a). Based on the these results, the study further examined the functions of SLC1A5 in the U87 and U251 cell lines (Fig. 8b, c). Therefore, a loss-of-function experiment was conducted where SLC1A5 was knocked-down using shRNA. The colony formation assay indicated that suppressing the expression of SLC1A5 inhibited the proliferative ability of the U87 and U251 cells (Fig. 8d). Moreover, the MTT assay showed that cell growth was inhibited in the SLC1A5-knockdown cell lines, compared to the control group (Fig. 8e, f). Furthermore, the transwell migration assay indicated that knockdown of SLC1A5 inhibited the migratory ability of the U87 and U251 cells (Fig. 8g-i). These results therefore suggested that SLC1A5 promotes the proliferation and migratory ability of glioma cells.
