Study population
In the study period, 420 consecutive hospitalized patients with SARS-CoV-2 pneumonia were screened for study participation. Out of the 420, 312 (83, 27% women; median [IQR] age 61.1 [53.4,69.3] years) met inclusion and exclusion criteria, provided consent and, thus, were enrolled in the final cohort and were stratified as follows: 71 patients in the “oxygen alone” group, 144 patients in the “CPAP” group and 97 patients in the “IMV” group, Fig. 1. The baseline clinical features of the study population stratified by maximum oxygen/ventilatory support are shown in Table 2. The majority of patients were never smokers, with no differences between the study groups. The most frequently encountered comorbidities were obesity (34%), hypertension (29%), cardiovascular diseases (22%) and diabetes (14%). The majority of patients showed only one or the absence of comorbidities (78%). In regards to treatments received during hospitalization for COVID-19, patients in the “oxygen alone” group received significantly less specific treatments compared to the other groups. Pulmonary thromboembolism and deep vein thrombosis, two possible complications of COVID-19, were reported in 4.8% and 1.3% of patients, respectively, with no differences between groups.
Table 2
Demographics and clinical characteristics of study cohort
|
DEMOGRAPHICS
|
| |
OXYGEN ONLY
(N = 71)
|
CPAP
(N = 144)
|
IMV
(N = 97)
|
p
|
|
Age (years), median [IQR]
|
61.1 [53.3, 71.9]
|
61.1 [53.1, 67.6]
|
60.8 [55.2, 68.2]
|
0.600
|
|
Female gender, N (%)
|
31 (44)
|
33 (23)
|
19 (20)
|
0.001
|
|
BMI (kg/m2), median [IQR]
|
27.5 [24.6, 31.4]
|
28.7 [26.6, 31.3]
|
28.1 [25.7, 31.0]
|
0.234
|
|
Smoking History, N (%)
|
|
|
|
0.100
|
|
No
|
47 (84)
|
83 (65)
|
51 (65)
|
|
|
Active
|
1 (2)
|
8 (6)
|
6 (8)
|
|
|
Prior
|
8 (14)
|
36 (28)
|
21 (27)
|
|
|
COMORBIDITIES
|
| |
OXYGEN ONLY
|
CPAP
|
IMV
|
p
|
|
Cardiovascular Diseases, N (%)
|
12 (17)
|
31 (22)
|
25 (26)
|
0.397
|
|
Hypertension, N (%)
|
22 (31)
|
43 (30)
|
26 (27)
|
0.816
|
|
Cerebrovascular Diseases, N (%)
|
1 (1)
|
3 (2)
|
1 (1)
|
0.857
|
|
Asthma, N (%)
|
9 (13)
|
4 (3)
|
4 (4)
|
0.015
|
|
OSAS, N (%)
|
2 (3)
|
3 (2)
|
1 (1)
|
0.674
|
|
Chronic Kidney
Diseases, N (%)
|
4 (6)
|
2 (1)
|
3 (3)
|
0.162
|
|
Liver diseases, N (%)
|
2 (3)
|
3 (2)
|
0 (0)
|
0.200
|
|
Diabetes, N (%)
|
12 (17)
|
20 (14)
|
13 (13)
|
0.799
|
|
Autoimmune
Diseases, N (%)
|
1 (1)
|
2 (1)
|
0 (0)
|
0.603
|
|
Prior Cancer, N (%)
|
6 (8)
|
2 (1)
|
6 (6)
|
0.026
|
|
N. of Comorbidities, N (%)
|
|
|
|
-
|
|
0
|
24 (34)
|
68 (47)
|
39 (40)
|
|
|
1
|
29 (41)
|
44 (31)
|
38 (39)
|
|
|
2
|
11 (15)
|
25 (17)
|
16 (16)
|
|
|
≥ 3
|
7 (10)
|
7 (5)
|
4 (4)
|
|
|
TREATMENTS ASSOCIATED WITH COVID-19
|
| |
OXYGEN ONLY
|
CPAP
|
IMV
|
p
|
|
Systemic Steroid, N (%)
|
18 (31)
|
65 (56)
|
43 (58)
|
0.003
|
|
Heparin, N (%)
|
18 (31)
|
55 (47)
|
44 (59)
|
0.005
|
|
Tocilizumab, N (%)
|
5 (9)
|
17 (15)
|
19 (25)
|
0.031
|
|
Remdesivir, N (%)
|
1 (2)
|
2 (2)
|
12 (16)
|
< 0.001
|
|
Mucolytics, N (%)
|
13 (22)
|
35 (30)
|
30 (41)
|
0.084
|
|
Hyperimmune
Plasma, N (%)
|
0 (0)
|
1 (1)
|
1 (1)
|
1.000
|
|
Lopinavir/Ritonavir, N (%)
|
21 (36)
|
76 (66)
|
34 (46)
|
< 0.001
|
|
Hydroxychlorokine, N (%)
|
42 (72)
|
100 (88)
|
59 ( 80)
|
0.042
|
| Footnotes: BMI = body mass index; CPAP = continuous positive airway pressure; IMV = invasive mechanical ventilation; IQR = interquartile range; OSAS = obstructive sleep apnea syndrome |
Evaluation of pulmonary sequelae
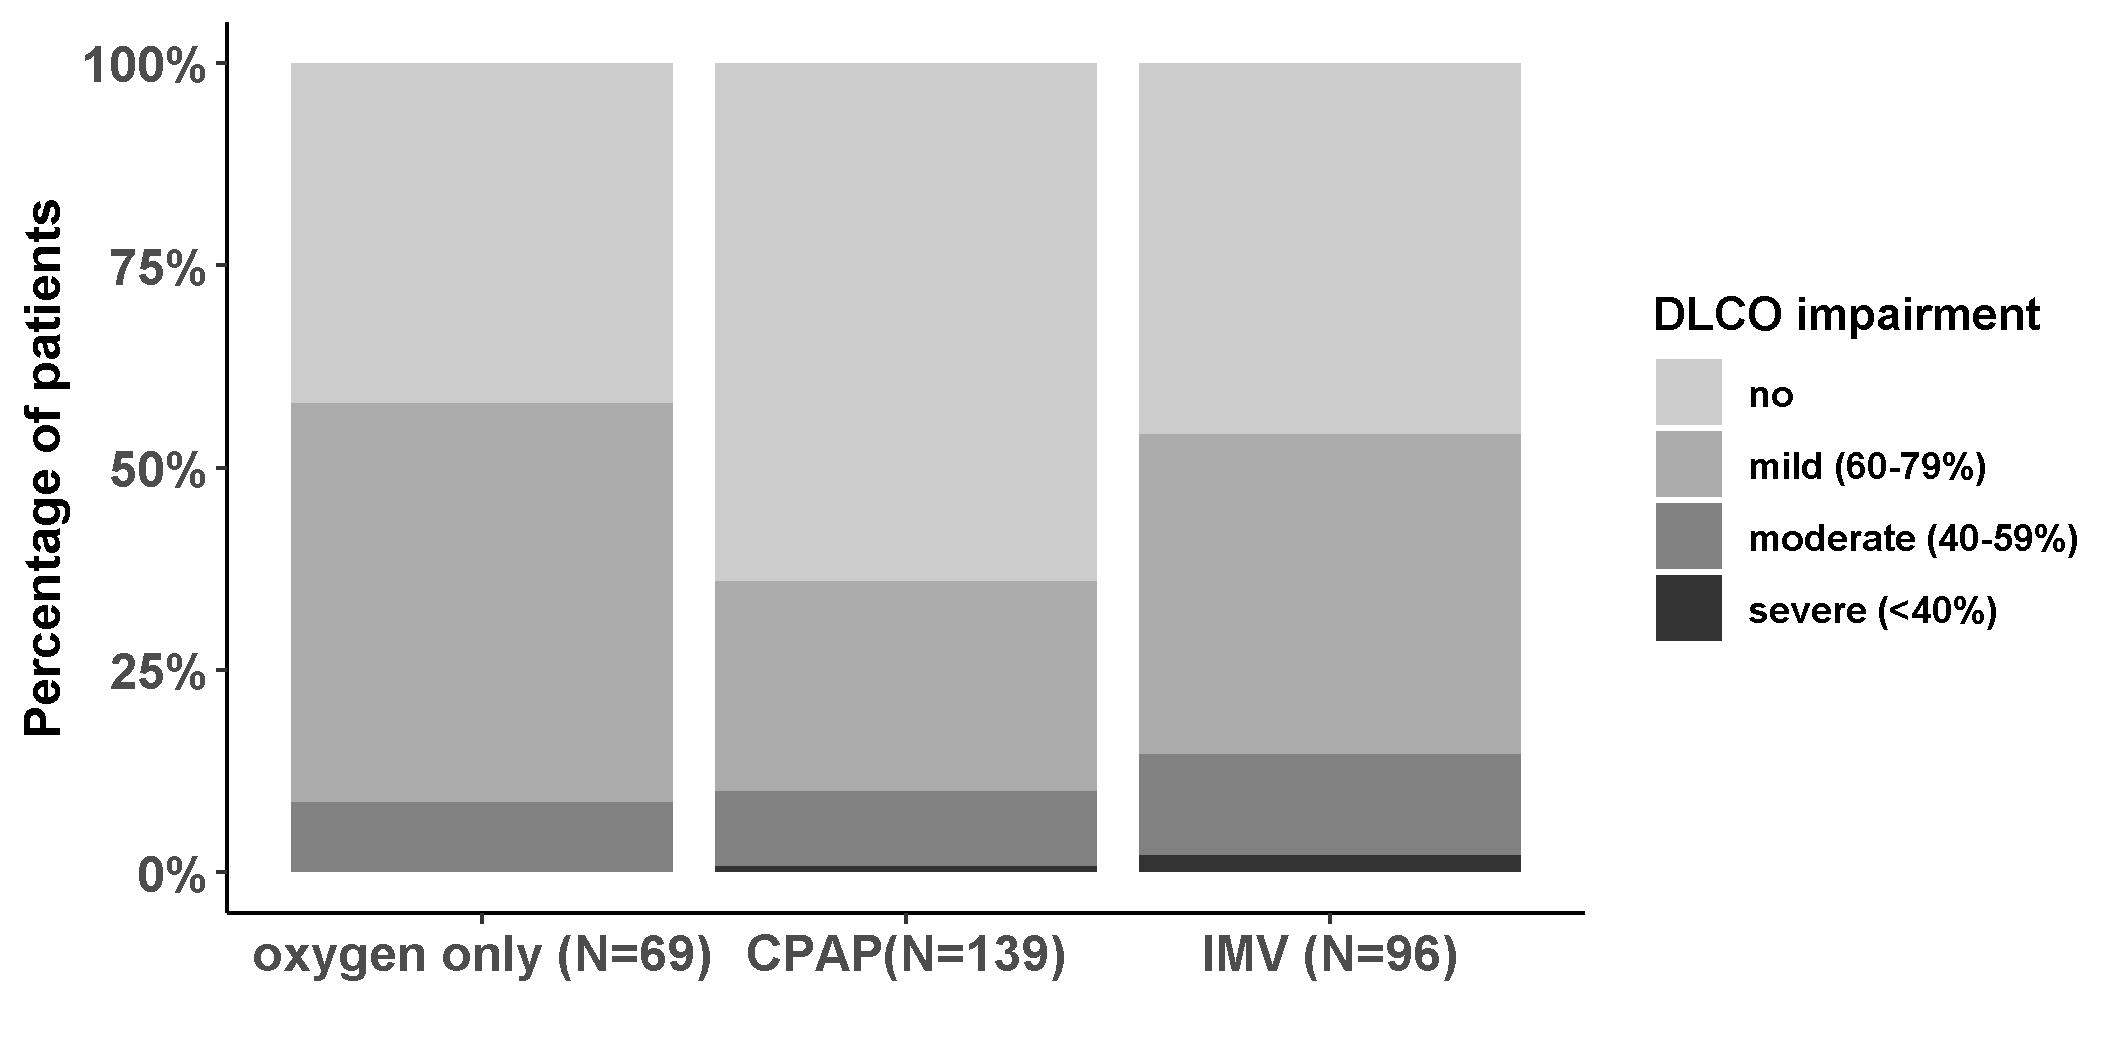
In regards to the presence of DLCO impairment (primary endpoint), we observed a statistically significant difference between groups with the highest prevalence of DLCO alteration in the “oxygen alone” (n = 40, 58%) and “IMV” group (n = 52, 54%) and the lowest in the “CPAP” group (n = 50, 36%), Table 3. However, patients in the “IMV” and “CPAP” group showed slightly more frequently moderate and severe DLCO impairment compared to the “oxygen alone” group, Figure S1 (Supplementary Information).
Table 3
Pulmonary function tests at 6 months from hospital discharge
|
PULMONARY FUNCTION TEST VALUES AS CONTINUOUS VARIABLES
|
| |
OXYGEN ONLY
(N = 71)
|
CPAP
(N = 144)
|
IMV
(N = 97)
|
p
|
|
FEV1 (L), median [IQR]
|
2.8 [2.3, 3.4]
|
3.4 [2.7, 3.9]
|
3.1 [2.7, 3.7]
|
|
|
FEV1%, median [IQR]
|
109.0 [94.0, 117.0]
|
111.0 [97.5, 123.0]
|
106.8 [96.0, 119.2]
|
0.106
|
|
FVC (L), median [IQR]
|
3.3 [2.8, 4.3]
|
4.1 [3.3, 4.7]
|
3.7 [3.2, 4.5]
|
|
|
FVC%, median [IQR]
|
107.2 [95.2, 115.8]
|
106.4 [96.3, 118.5]
|
102.0 [91.8, 112.5]
|
0.046
|
|
VC (L), median [IQR]
|
3.3 [2.9, 4.4]
|
4.2 [3.4, 4.8]
|
3.6 [3.3, 4.6]
|
|
|
VC%, median [IQR]
|
108.0 [89.0, 116.5]
|
105.0 [95.0, 117.0]
|
99.0 [89.0, 110.0]
|
0.076
|
|
TI, median [IQR]
|
81.3 [77.8, 85.0]
|
83.0 [79.0, 86.0]
|
84.0 [80.7, 86.9]
|
0.004
|
|
RV (L), median [IQR]
|
2.0 [1.6, 2.3]
|
2.0 [1.6, 2.4]
|
1.9 [1.5, 2.3]
|
|
|
RV%, median [IQR]
|
93.0 [79.0, 104.0]
|
89.5 [74.0, 108.2]
|
84.5 [70.6, 102.2]
|
0.197
|
|
TLC (L), median [IQR]
|
5.5 [4.4, 6.4]
|
6.2 [5.2, 6.9]
|
5.8 [4.8, 6.7]
|
|
|
TLC%, median [IQR]
|
93.0 [88.0, 103.0]
|
96.0 [86.0, 106.8]
|
91.8 [82.2, 101.0]
|
0.183
|
|
DLCO (mmoL/min/kPa), median [IQR]
|
6.3 [5.6, 7.7]
|
7.7 [6.1, 8.8]
|
6.8 [5.6, 8.0]
|
0.001
|
|
DLCO%, median [IQR]
|
76.0 [69.9, 91.0]
|
84.0 [72.7, 94.5]
|
77.4 [66.8, 88.2]
|
0.020
|
|
PULMONARY FUNCTION TEST VALUES AS CATEGORICAL VARIABLES
|
| |
OXYGEN ONLY
|
CPAP
|
IMV
|
p
|
|
DLCO impairment (%)
|
40 (58)
|
50 (36)
|
52 (54)
|
0.002
|
|
MILD defect (60–79%)
|
34 (49)
|
36 (26)
|
38 (40)
|
|
|
MODERATE defect
(40–59%)
|
6 (9)
|
13 (9)
|
12 (12)
|
|
|
SEVERE defect (< 40%)
|
0 (0)
|
1 (1)
|
2 (2)
|
|
|
VC impairment (%)
|
10 (17)
|
16 (12)
|
15 (17)
|
0.494
|
|
MILD defect (70–79%)
|
6 (10)
|
11 (8)
|
6 (7)
|
|
|
MODERATE defect
(60–69%)
|
2 (3)
|
5 (4)
|
7 (8)
|
|
|
moderate-to-severe defect (50–59%)
|
2 (3)
|
0 (0)
|
1 (1)
|
|
|
SEVERE defect (≤ 49%)
|
0 (0)
|
0 (0)
|
1 (1)
|
|
|
FVC IMPAIRMENT (%)
|
7 (10)
|
10 (7)
|
11 (11)
|
0.458
|
|
mild defect (70–79%)
|
4 (6)
|
9 (6)
|
8 (8)
|
|
|
moderate defect
(60–69%)
|
3 (4)
|
1 (1)
|
3 (3)
|
|
|
moderate-to-severe defect (50–59%)
|
0
|
0
|
0
|
|
|
severe DEFect (≤ 49%)
|
0
|
0
|
0
|
|
|
TiFFENEAU INDEX < 0.7
|
5 (7)
|
1 (1)
|
1 (1)
|
0.017
|
|
FEV1 reduction
|
5 (100)
|
1 (100)
|
1 (100)
|
-
|
|
TLC IMPAIRMENT (%)
|
10 (15)
|
23 (16)
|
19 (20)
|
0.664
|
|
MILD defect (70–79%)
|
7 ( 11)
|
17 ( 12)
|
12 ( 13)
|
|
|
MODERATE defect
(60–69%)
|
3 ( 5)
|
4 ( 3)
|
5 ( 5)
|
|
|
moderate-severe defect (50–59%)
|
0 ( 0)
|
2 ( 1)
|
2 ( 2)
|
|
|
SEVERE defect (≤ 49%)
|
0 ( 0)
|
0 ( 0)
|
0 ( 0)
|
|
|
RV IMPAIRMENT (%)
|
|
|
|
0.289
|
|
mild defect
(130–139%)
|
1 (2)
|
4 (3)
|
0 (0)
|
|
|
moderate defect
(140–170%)
|
0 (0)
|
2 (1)
|
2 (2)
|
|
|
severe defect (≥ 171%)
|
1 (2)
|
0 (0)
|
0 (0)
|
|
| Footnotes: CPAP = continuous positive airway pressure; DLCO = diffusion capacity for carbon monoxide; FEV1 = Forced Expiratory Volume in the 1st second; FVC = Forced Vital Capacity; IMV = invasive mechanical ventilation; RV = Residual Volume; TI = Tiffeneau Index (FEV1/FVC ratio); TLC = Total Lung Capacity; VC = Vital Capacity. |
No differences between groups were observed in the other parameters of PFTs, with the exception of FVC and Tiffeneau Index, Table 3. When considering FVC as a continuous variable, patients in the “IMV” group showed lower values compared to “CPAP” and “oxygen only” group (median [IQR] FVC% 102% [91.8-112.5], 106% [96.3-118.5] and 107% [95.2-115.8], respectively, p-value 0.046). However, when considering pathological values of FVC% (below 80% of predicted), only a minority of patients presented this condition (10, 7 and 11% of cases in the “oxygen only”, “CPAP” and “IMV” group, respectively) with no differences between groups. Therefore, only a minority of patients (28, 9%) showed a restrictive pattern. An obstructive pattern (defined as Tiffeneau Index < 0.7 with a concomitant reduction of FEV1 < 80%) was observed only in 7 (2.2%) patients, in the majority of cases in the “oxygen only” group (5 cases). Among the 7 cases with obstructive pattern one was active and two prior smokers and one had asthma as comorbidity.
Median distance walked at 6MWT ranged between 150 and 700 meters, with no differences between groups, Table 4. However, up to 46 (17%) of patients showed a distance walked lower than expected, again without differences between groups. No patients showed oxygen desaturation or required oxygen supplementation during the test.
Table 4
Six-minute walking test, lung auscultation, chest X-ray and mMRC scale results at 6 months from hospital discharge
|
SIX-MINUTE WALKING TEST
|
| |
OXYGEN ONLY
(N = 71)
|
CPAP
(N = 144)
|
IMV
(N = 97)
|
p
|
|
METERs, median [IQR]
|
450 [400, 500]
|
473 [424.5, 522.5]
|
485 [406.2, 540]
|
0.148
|
|
distance lower than expected (%)
|
10 (18)
|
21 (17)
|
15 (17)
|
0.955
|
|
LUNG AUSCULTATION
|
| |
OXYGEN ONLY
|
CPAP
|
IMV
|
p
|
|
“velcro” crackles (%)
|
3 (4)
|
6 (4)
|
12 (12)
|
0.038
|
|
WHEEZING (%)
|
0 (0)
|
5 (3)
|
0 (0)
|
0.070
|
|
CHEST X-RAY RESULTS
|
| |
OXYGEN ONLY
|
CPAP
|
IMV
|
p
|
|
ABNORMAL (%)
|
16 (25)
|
27 (24)
|
34 (44)
|
0.008
|
|
CONSOLIDATIONS (%)
|
0 (0)
|
1 (1)
|
6 (8)
|
0.006
|
|
GROUND GLASS OPACITIES (%)
|
10 (16)
|
8 (7)
|
9 (12)
|
0.186
|
|
RETICULATIONS (%)
|
12 (19)
|
21 (19)
|
26 (34)
|
0.042
|
|
mMRC SCALE
|
| |
OXYGEN ONLY
|
CPAP
|
IMV
|
p
|
|
SCALE (%)
|
|
|
|
0.911
|
|
0
|
41 (67)
|
90 (68)
|
62 (69)
|
|
|
1
|
15 (25)
|
26 (20)
|
22 (24)
|
|
|
2
|
3 (5)
|
11 (8)
|
5 (6)
|
|
|
3
|
2 (3)
|
4 (3)
|
1 (1)
|
|
|
4
|
0 (0)
|
1 (1)
|
0 (0)
|
|
| Footnotes: CPAP = continuous positive airway pressure; IMV = invasive mechanical ventilation; mMRC = modified Medical Research Council. |
Characterizing the degree of dyspnoea reported by patients through the mMRC scale, the majority of patients (62%) were “not troubled by breathlessness except on strenuous exercise”, with no differences between groups, Table 4. Also at lung auscultation only a minority of patients, ranging from 4 to 12% according to study group, presented pathological sounds, mostly “velcro” crackles (21 cases) followed by wheezing (5 cases). “Velcro” crackles were significantly more frequent in the “IMV” group. Among the 21 cases with “velcro” crackles at physical exam, 10 (48%) showed abnormal chest X-ray (reticulations in 9 out of 10 cases), and 7 (33%) had DLCO impairment, of mild entity in all patients, but none showed restrictive pattern at PFTs. Three of the 5 cases who showed wheezing also had asthma, but none of them had an obstructive ventilatory defect.
Chest X-ray abnormalities were more frequently encountered in the “IMV” group (34, 44% of cases) compared to “CPAP” group (27, 24% of cases) and “oxygen only” group (16, 25% of cases), p value = 0.008. The type of features more frequently observed were reticular in 59 patients (23%), ground glass opacities in 27 (11%) and consolidation in 7 (3%) of patients, Table 4.
After adjusting for demographics, comorbidities and treatments during hospital stay (Table 5), the “IMV” group showed higher odds of DLCO impairment with respect to the “oxygen only” group although the difference was not significant (OR = 1.73, 95%CI: 0.75; 3.99). No significant difference in DLCO impairment was also observed among “CPAP” and “oxygen alone” (OR = 0.72, 95%CI: 0.34; 1.54). Interestingly in subjects treated with prophylactic heparin the odds of DLCO alteration were halved (OR = 0.45, 95%CI: 0.25; 0.83). Patients with asthma presented higher odds of altered DLCO (OR = 4.86, 95%CI: 1.09; 21.68). No difference among the three groups was also observed in a sensitivity analysis including smoke in the model (not included in main analysis due to the low number of active smokers (n = 15) and 16% of missing).
Table 5
Multivariable logistic model results on the association between groups and DLCO or chest-X-ray impairment adjusted for prespecified variables.
|
DLCO IMPAIRMENT^
|
OR
|
95%CI
|
p
|
|
CPAP vs OXYGEN ALONE
|
0.72
|
0.34
|
1.54
|
0.3977
|
|
IMV vs OXYGEN ALONE
|
1.73
|
0.75
|
3.99
|
0.1981
|
|
AGE (per year) IN MALES
|
1.04
|
1.00
|
1.08
|
*
|
|
AGE (per year) IN FEMALES
|
0.98
|
0.93
|
1.03
|
*
|
|
BMI (per kg/m2)
|
0.95
|
0.88
|
1.02
|
0.1283
|
|
CARDIOVASCULAR DISEASES (YES vs NO)
|
0.7
|
0.34
|
1.43
|
0.3274
|
|
DIABETES (YES vs NO)
|
2.01
|
0.83
|
4.86
|
0.1209
|
|
ASTHMA (YES vs NO)
|
4.86
|
1.09
|
21.68
|
0.0381
|
|
SYSTEMIC STEROID (YES vs NO)
|
1.07
|
0.58
|
1.97
|
0.8281
|
|
PROPHYLACTIC HEPARIN (YES vs NO)
|
0.45
|
0.25
|
0.83
|
0.0105
|
|
CHEST X-RAY ALTERATIONS#
|
OR
|
95%CI
|
p
|
|
CPAP vs OXYGEN ALONE
|
1.4
|
0.53
|
3.68
|
0.4997
|
|
IMV vs OXYGEN ALONE
|
3.9
|
1.38
|
11.01
|
0.0101
|
|
AGE (per year) IN MALES
|
1.05
|
1.01
|
1.09
|
0.0076
|
|
GENDER (FEMALES vs MALES)
|
1.54
|
0.68
|
3.49
|
0.3058
|
|
BMI (per kg/m2)
|
0.91
|
0.84
|
1.00
|
0.0512
|
|
CARDIOVASCULAR DISEASES (YES vs NO)
|
0.64
|
0.27
|
1.53
|
0.3189
|
|
DIABETES (YES vs NO)
|
2.44
|
0.9
|
6.59
|
0.079
|
|
ASTHMA (YES vs NO)
|
2.79
|
0.58
|
13.29
|
0.1983
|
|
SYSTEMIC STEROID (YES vs NO)
|
1.56
|
0.73
|
3.32
|
0.2498
|
|
PROPHYLACTIC HEPARIN (YES vs NO)
|
1.02
|
0.49
|
2.15
|
0.9491
|
| ^242 patients included with no missing on DLCO and variables in the model, 106 with DLCO impairment |
| #203 patients included with no missing on chest X-ray and variables in the model, 51 with chest X-ray alterations |
| *a significant interaction between sex and age was found in this model with p-value = 0.0374. For this reason we presented the OR of age stratified by gender. |
| Footnotes: BMI = body mass index; CPAP = continuous positive airway pressure; DLCO = diffusion capacity for carbon monoxide; IMV = invasive mechanical ventilation. |
The odds of radiological alterations on chest X-ray were higher in older patients (OR = 1.05, 95%CI: 1.01;1.09) and in patients treated with “IMV” with respect to patients on oxygen alone (OR = 3.9, 95%CI: 1.38; 11.01), while patients treated with CPAP did not showed significantly higher odds of radiological alterations.