Whole seed transcriptome sequencing
To cover the entire J. curcas seed transcriptome, total RNA was extracted from six stages of seed maturation, and equal amounts of total RNA from each sample were pooled together. From this pool, mRNA was isolated and reverse transcribed into cDNA. Normalized cDNA libraries were generated and sequenced using the GS FLX Titanium. Sequencing of cDNA libraries yielded a total of 793,875 high quality (HQ) reads with an average read length of 358 nucleotides and 262,096,927 total number of bases (SRX4559398).
After trimming and cleaning, a total of 603,459 HQ reads were assembled into 19,841 contigs (unique transcripts) containing 13,171,840 bases. Out of them, 48,978 reads were identified as singletons. The size of contigs ranged from 100 to 4,088 bases, with 1,035 bases as N50 contig size. Unique contig sequences can be accessed at http://short.boku.ac.at/jatropha_contigs.
In addition, the data were compared with the Jatropha genomic sequences of Kazusa DNA Research Institute (JAT_r4.5, ftp://ftp.kazusa.or.jp/pub/Jatropha/)[37-38] and Chinese Academy of Sciences (JatCur_1.0, ftp://ftp.ncbi.nih.gov/ genomes/Jatropha_curcas/)[39-40] (Table S2). In total 73.7% (14,616 contigs), 1.3% (251 contigs), 13.4 % (2,671 contigs) showed sequence similarity to both, only to JAT_r4.5 or only to JatCur_1.0 databases, respectively. However, 11.61% (2,303 contigs) were found additionally in the current study. These transcripts are most probably new genes, non-jatropha or non-plant genes, or possibly sequencing artefacts. To assess the quality of the assembled transcripts, the library was compared to the reference transcriptome of JatCur 1.0 available from NCBI. The seed specific de novo RNA library of this study represented about 36,6% of the 35,788 reference RNA coding sequences with an average blast HSP coverage of 93% (+/- 16,3%).”
Functional annotation of whole transcript sequencing data
All 19,841 unique contigs were analyzed by Blast2GO [27] and aligned using BLASTX [41]. Search in the NCBI non-redundant nucleotide database using an E-value threshold of 1e-6 identified 14,994 unique contigs. The taxonomic distribution showed over 8,000 transcripts had top hits to Ricinus communis (Figure S1), a species closely related to Jatropha. Based on text-annotation from the BLAST hits, approximately 3% (618 contigs) of the transcripts showed top BLAST hits with uncharacterized proteins, and 23% (4,847 contigs) had no significant similarity to any sequence in the public dataset. The average length of annotated and unannotated contigs was 800 and 400 bp, respectively.
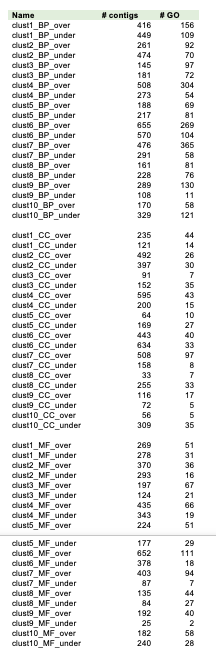
GO terms classification identified 13,705 Jatropha unique transcripts received at least one GO annotation (Table S1). The highest percentage of GO terms was found in the category BP, containing 2,469 GO terms, followed by 1,891 in MF and 521 in CC (Table S1, Figure S2). The most abundant GO terms in the BP category were genes involved in oxidation-reduction processes (5.1%), DNA-templated regulation of transcription (3.1%) and response to cadmium (2.2%). Within MF, the largest content of functionally assigned ESTs were related to ATP binding (6.5%), zinc ion binding (4.9%) and DNA binding (3.7%). In CC, the most representative categories were nucleus (13.9%), plasma membrane (9.1%) and chloroplast (7.3%).
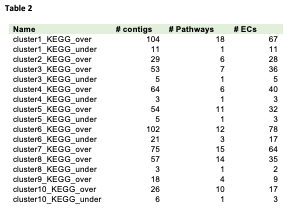
Out of the 13,705 sequences annotated with GO terms, 4,399 contigs were assigned with 5,703 EC numbers representing 1,040 unique enzymes, 799 of which are assigned to one or more KEGG pathways (Table S2). Additionally, of the 19,841 contigs, 37.6% were also annotated based on homology to sequences in the InterPro database (Table S2).
Moreover, 1,001 different contigs were identified belonging to 20 transporter classes (Table S2). Of them 233 and 246 contigs belong to the transporter classes 2A (porters) and 3A (p-p-bond-hydrolysis- driven transporters), respectively.
Protein domain characteristics for Resistance Gene Analogs (RGAs) have been identified in 85 contigs, with 70 carrying a kinase domain, 35 of which also harbored an additional serine/threonine (Ser-Thr) site. RGAs that contain Ser-Thr domain can phosphorylate serine and threonine residues, which are involved in plant development, signaling and defense [42]. However, some RGAs like the Pto gene from tomato encode only Ser-Thr protein kinase. Four contigs with a nucleotide-binding site (NBS-ARC) domain and eight contigs with a leucine-rich repeat (LRR) domain were found. Both domains are abundantly present in plants and have an ATPase activity [43].
In addition, 600 contigs could be identified as TFs, belonging to 52 different TF classes (Table S2). The most abundant TF families were MYB-related, MYB, bZIP, AP2, ERF and RAV, represented by 66, 54, 49, 49, 49 and 46 contigs, respectively.
Annotated sequences were mapped to KEGG pathways showed 2,660 contigs located on 144 pathways (Figure 1, Table S3). Using the KEGG classifications allowed us to identify that the most highly represented pathways were purine metabolism (315 contigs), followed by starch and sucrose metabolism (226), pyrimidine metabolism (154) and phenylalanine metabolism (138). Further, glycolysis (129), pyruvate metabolism (111), flavonoid biosynthesis (111), glycerolipid metabolism (103) and phenylpropanoid biosynthesis (96) were also found in the top 20 highly represented pathways.
Genome-wide variation in transcript expression during seed maturation
An 8x60k oligonucleotide microarray containing 57,842 unique probes was produced from 19,841 transcriptome contigs. In total 31,875 specific probes and 2,604 cross-hybridizing probes (Xhyb) in sense direction, as well as 21,680 specific probes and 1,683 Xhyb in antisense direction were designed.
The microarray data were normalized; differential expression patterns were identified, classified, and categorized by their possible molecular function and involvement in metabolic pathways. Principle components analysis (PCA) on transcript expression (abundance) of 57,842 probes showed a clear separation of the six different maturation stages along the first principle component (PC1); which explained 53% of total variation, and was associated mostly with variation in transcript expression over the maturation stages, where expression from stage IV and V were closer to each other (Figure S3). Significant changes in transcript expression (abundance) were observed in the early and late stages, suggesting a higher physiological differentiation in these stages. In addition, biological replicates of each stage clustered together, suggesting a minimal variation between replicates.
To identify changes in gene expression patterns during seed maturation linear models were calculated and revealed large changes in gene expression over the six stages of seed maturation. A total of 9,111 probes (16% of the total probes) from 7,299 contigs (38% of the total contigs) were differentially expressed with a P-value < 1e-8 (Table S4 and Figure S4).
The cluster analysis showed that gene different expression patterns could be classified into ten different clusters (1-10) (Figure 3-4) of co-expressed genes. Up-regulated transcripts, whose expression was increased during seed maturation, are displayed in clusters 2, 4, 8, 9 and 10 (group A), while down-regulated transcripts were displayed in clusters 1, 3, 5, 6 and 7 (group B).
Besides, we annotated manually the identified differentially expressed sequences (DESs) and patterns with respect to their specific function. Based on the Transporter Classification Database, 431 differentially expressed transcript (699 probes) were assigned to 92 transporter subfamilies, 16 subclasses and 7 classes, distributed among all clusters, representing the intense activities during the maturation process, which requires transport of metabolites within the cell and between different parts of the seed. The highest number (184) of transcripts related to transport activities were identified in class 2 (Electrochemical potential-driven transporters), followed by class 3 (Primary active transporters) with 179 transcripts. 13 transcripts were classified to be transporter subfamily 1.A.33, which is related to heat shock protein (Hsp) 70 (Table S4). Furthermore, different kinds of sugar transporters (2.A.1) and ATP/ADP transmembrane transport (2.A.29) represent the role of transporters to provide necessary energy metabolism during seed maturation. Among 24 transcripts that were classified as ABC transporters (3.A.1), subfamilies A, C, E, F, G and I were identified (Table S4).
In addition, 47 families of TFs showed differential expression between the six seed maturation stages, involving all expression pattern clusters (Table S4). The highest number of transcripts related to TFs were found in cluster 1, followed by cluster 6, while the least number of TFs were found in cluster 3. The most abundant TF families were identified as AP2/ERF-RAV. Furthermore, we explored the co-expression patterns using partial correlation networks. We identified two intermodular hubs with around 40 edges and a broad range of nodes displaying between 15 and 10 edges (Figure 2A-B). The CB5-D hub showed the highest number of edges followed by unannotated contig02686, CDR1 (aspartic proteinase), unannotated contig00566, TT8 (Transparent Testa 8), unannotated contig19762, and HVA22 (Figure 2A-B). HVA22J, connected CB5-D (cytochrome B5 isoform D), to CDR1, Dihydroflavonol reductase (DFR) and TT8 (Figure 2A-B).
To focus on processes expected to be involved in seed storage and seed developments as well as hormone pathway, the GO terms from BP category were extracted. The co-expression results showed a high degree of connectivity between seed development and hormone pathways, while seed storage is less connected to the other two pathways (Figure 2C).
In addition, based on pairwise comparison between seed maturation stages, the highest number of differentially expression transcripts related to 889 and 272 contigs (1,122 and 1,673 probes), which were found between stages V and VI (Table S5).
GO enrichment analyses of DESs
GO enrichment analyses in BP categories for each cluster indicated that the most significantly over- and under-represented DESs were found in cluster 6 (detailed information and TOP 15 GO terms for each cluster are shown in Figure 5, Figure S5, Table S6 and Table S7).
Besides, visualization of enriched GO terms related to BP category showed that the GOs related to fatty acid metabolism (e.g. unsaturated fatty acid, linoleic acid), lipid storage, dormancy process, aromatic acid transports, monoterpenoid metabolism, and UDP-glucose metabolism were significantly over-represented in cluster group A, with higher DES level during late stage of seed maturation. Furthermore, Raffinose family oligosaccharides (RFOs), which are associated with late maturation in Arabidopsis, Brassica napus and Medicago trunculata [44-46] and transcripts related to biosynthesis of serine and glycine, Embryo sac development, RNA modification, methylation, maintenance of seed dormancy, protein folding and RNA modification were over-represented in this group.
In contrast, GOs related to phenylpropanoid and flavonoid metabolism and biosynthesis, as well as cell wall modification and carbohydrate metabolism in cluster group B, were significantly enriched with high expression levels during the early stage of seed maturation (Figure S4). Transcripts involved in hormone transporters, signaling, ATP hydrolysis coupled protein transport and purine ribonuclease metabolism were significantly over-represented in this group.
GOs involved in glucan and beta-glucan biosynthesis playing a key role in regulating seed coat-imposed dormancy [47] were over-represented in two clusters (3 and 8, respectively). Also, GOs involved in translation, RNA processing, and gene expression were under-represented in different clusters (6 and 9). They represent a different pattern of gene expression during seed maturation, indicating the involvement of two different groups of genes.
KEGG enrichment analysis of DESs
To further understand the biological function of DESs during seed maturation, enriched KEGG pathways with P-value < 0.05 in the set of DESs was assessed (Table S8 and S7, Figure S6).
Pathway enrichment in DESs related to lipid metabolism
In the plant, pathways contributing to lipid biosynthesis can be divided into three steps and cell compartments; a) fatty acid biosynthesis in the plastids, b) triacylglycerol (TAG) biosynthesis in the endoplasmic reticulum (ER), and c) oil body formation in the cytoplasm [48]. Altogether, 97 contigs and 55 enzymes distributed among 13 pathways were enriched as being involved in these steps (Figure S4 and S7).
In the first step, we could identify DESs related to 3-oxoacyl-ACP reductase (KAR, EC:1.1.1.100), containing various DESs (five contigs in clusters 1 and 8). In addition, palmitolyo-ACP (KASI, EC:2.3.1.41, two contigs in clusters 5 and 8) with DESs were identified showing different regulation patterns. The elongation from 16∶0-ACP or 18∶1-ACP [49] occurs in the plastid and is catalyzed by acyl-ACP desaturase (AAD, EC:1.14.19.2), which was represented in current study by four DESs (in clusters 5 and 8). Additionally, we identified Oleoyl-ACP hydrolase (OAH, EC:3.1.2.14, two contigs in clusters 1 and 5), removing acyl group from ACP, and Acyl-CoA synthetase (EC:6.2.1.3, two contigs in cluster 8) engaged in glycerophospholipid metabolism and fatty acid elongation.
We also identified key enzymes involved in triacylglycerol (TAG) production such as phospholipid: diacylglycerol acyltransferase (PDAT1, EC:2.3.1.158, two contigs in cluster 8), lysophosphatidic acid acyltransferase (LPAAT, EC:2.3.1.51, five contigs in clusters 2 and 4), and PA phosphatase (PAP, EC:3.1.3.4, one contig in cluster 2). Two DESs in cluster 10, encoding diacylglycerol O-acyltransferase (DGAT, EC:2.3.1.20), and two DESs corresponding phospholipid diacylglycerol acyltransferase (PDAT, EC:2.3.1.158) in cluster 8 were identified. Furthermore, triacylglycerol lipase (EC:3.1.1.3, six contigs in clusters 4 and 8), which modifies TGA into fatty acids was identified. All DESs involved in TAG production process were classified in clusters 2, 4 and 8, showing their expressions increase during seed maturation.
Contigs encoding enzymes like diacylglycerol kinase (ATP, EC:2.7.1.107, two contigs in cluster 4), aldehyde dehydrogenase (NAD+, EC:1.2.1.3, three contigs in clusters 2, 4 and 8) and glycerate 3-kinase (EC:2.7.1.31, two contigs in cluster 2), were found in cluster 2, 4 and 8, showing an increase during the last stage of J. curcas seed maturation. As expected, the synthesis of fatty acids requires a high amount of energy during seed maturation, which results in increased expression of enzymes related to photosynthesis as an energy supply [50].
Furthermore, two important enzymes involved in alpha-linolenic acid metabolism and biosynthesis of unsaturated fatty acids were identified in cluster 1: acyl-CoA oxidase (EC:1.3.3.6, one contig) and enoyl-CoA hydratase/3-hydroxyacyl-CoA dehydrogenase (EC:4.2.1.17, two contigs).
Pathway enrichment in DESs related to phenylpropanoid biosynthesis
Among the significantly enriched pathways, the phenylpropanoid biosynthesis pathway contained 30 over-represented contigs and 11 enzymes located in clusters 3, 5 and 8 (Figure S4 and Figure S8). In this pathway, we identified three over-expressed transcripts (contig05064, contig05269 and contig05269) related to phenylalanine/tyrosine ammonia-lyase (PTAL, EC:4.3.1.25), the expression of which decreases during seed maturation as shown in clusters 3 and 5. Furthermore, one transcript corresponding to trans-cinnamate 4-monooxygenase (C4H, EC:1.14.13.11, one contig in cluster 5) was identified, which converts cinnamic acid to P-coumaric acid. Finally, P-coumaric acid can be conjugated by 4-coumarate: CoA ligase (4CL, EC: 6.2.1.12) and enriched to coenzyme A to form p-coumaroyl-CoA, which is the precursor for the synthesis of flavonoids, stilbenes, and other phenylpropanoids [51]. For this enzyme we also identified five transcripts, enriched in clusters 3 and 5.
Caffeoyl-CoA O-methyltransferase (CCoA-OMT; EC:2.1.1.104) with four transcripts was over-represented in clusters 3, 5, and 8. Finally, eleven transcripts in clusters 3 and 5 for peroxidase (EC:1.11.1.7) were significantly enriched and over-represented.
Pathway enrichment in DESs of flavonoid biosynthesis-related pathways
After oil extraction, the Jatropha seed cake contains high amounts of polyphenols and pigments as a result of flavonoid biosynthesis. In this study, were annotated and enriched in clusters 1, 3 and 5. They encoded 16 enzymes involved in flavonoid, flavone and flavonol biosynthesis and isoflavonoid biosynthesis (Figure S4 and Figure S9). Two differentially expressed transcripts (cluster 1) were identified as 6'-deoxychalcone synthase (EC:2.3.1.170) and three transcripts (clusters 3 and 5) as naringenin-chalcone synthase (CHS, EC:2.3.1.74), an important enzyme catalyzing the conversion of cinnamoyl-CoA to pinocembrin chalcone. One transcript was annotated for chalcone isomers (CHI, EC:5.5.1.6, cluster 3) that catalyzes the conversion of pinocembrin chalcone to pinocembrin, a substrate for galangin synthesis [52]. Four transcripts were identified as flavanone 3-dioxygenase or naringenin 3-dioxygenase (F3H, EC:1.14.11.9, in cluster 5), which is involved in highly conserved pathways in plants to convert naringenin into dihydrokaempferol. It is an important intermediate product, that can be converted to kaempferol by flavonol synthase (EC:1.14.11.23), identified in the current study with 10 differentially expressed transcripts (in clusters 1, 3 and 5). The presence of different expression patterns (from different clusters) of one enzyme could be explained by the existence of different isoenzymes and possibly by the interaction with other genes involved in flavonoid biosynthesis at multiple loci [53].
Validation of microarray data using qRT-PCR
A total of 70 contigs from the DESs represented transcripts in seeds, and three housekeeping genes were selected (Table S9 and Table S10) and used for independent validation using a 48.48 chip (Fluidigm) to confirm that the changes in expressions as indicated by microarray data were authentic and reliable. Candidates for qPCR were chosen based on expression levels, known function, clusters and length of contigs. Additionally, some contigs of unknown function were selected. The corresponding primers are listed in Table S9.
The expression patterns obtained by qRT-PCR correlate strongly to moderately with data from the microarray analyses (about half of the contigs correlate with the microarray data at a Pearson correlation < -0.8), thus confirming the reliability of the chosen approach (Figure S10).