3.1. Physiological responses of alfalfa to NaCl stress
To test whether two species of alfalfa have distinct abilities to deal with saline conditions, The optimal test conditions such as salt treatment time and salt stress concentration were determined by the preliminary test. The seedlings were harvested after 7 days of salt stress treatment and subsequent tests were carried out. The experimental results showed that the growth of two alfalfa species was significantly inhibited and not lethal after being treated with 50 mM NaCl (Fig. 1). Because M. truncatula has been reported that its salt tolerance is lower than that of M. sativa, this experiment studied the physiological and biochemical indexes of two alfalfa species under salt stress to compare the differences of index and observe their salt tolerance mechanism.
Compared with the control, the root length, seedling length and germination index of M. sativa were reduced by 44.97%, 35.12% and 25.5%, respectively, while the root length, seedling length and germination index of M. truncatula were reduced by 55.43%, 42.03% and 41.32%, respectively under NaCl stress (Table S1). Na+, MDA, H2O2, CAT, SOD and POD activities were significantly higher in both M. sativa and M. truncatula seedlings after 50 mM NaCl treatment (Fig. 2 A-F). Na+ content and MDA content of M. sativa seedlings were significantly lower than those of M. truncatula seedlings treated with after 50 mM NaCl treatment (P<0.05) (Fig. 2 A-B). While the CAT and H2O2 contents and SOD and POD activities of M. sativa seedlings were significantly higher (P<0.05) than those of M. truncatula seedlings treated with 50 mM NaCl (Fig. 2 C-F). The results proved that M. sativa was more salt resistant than M. truncatula during seed germination, while M. truncatula exhibited sensitivity to NaCl stress.
3.2. Amino acid metabolism during stress
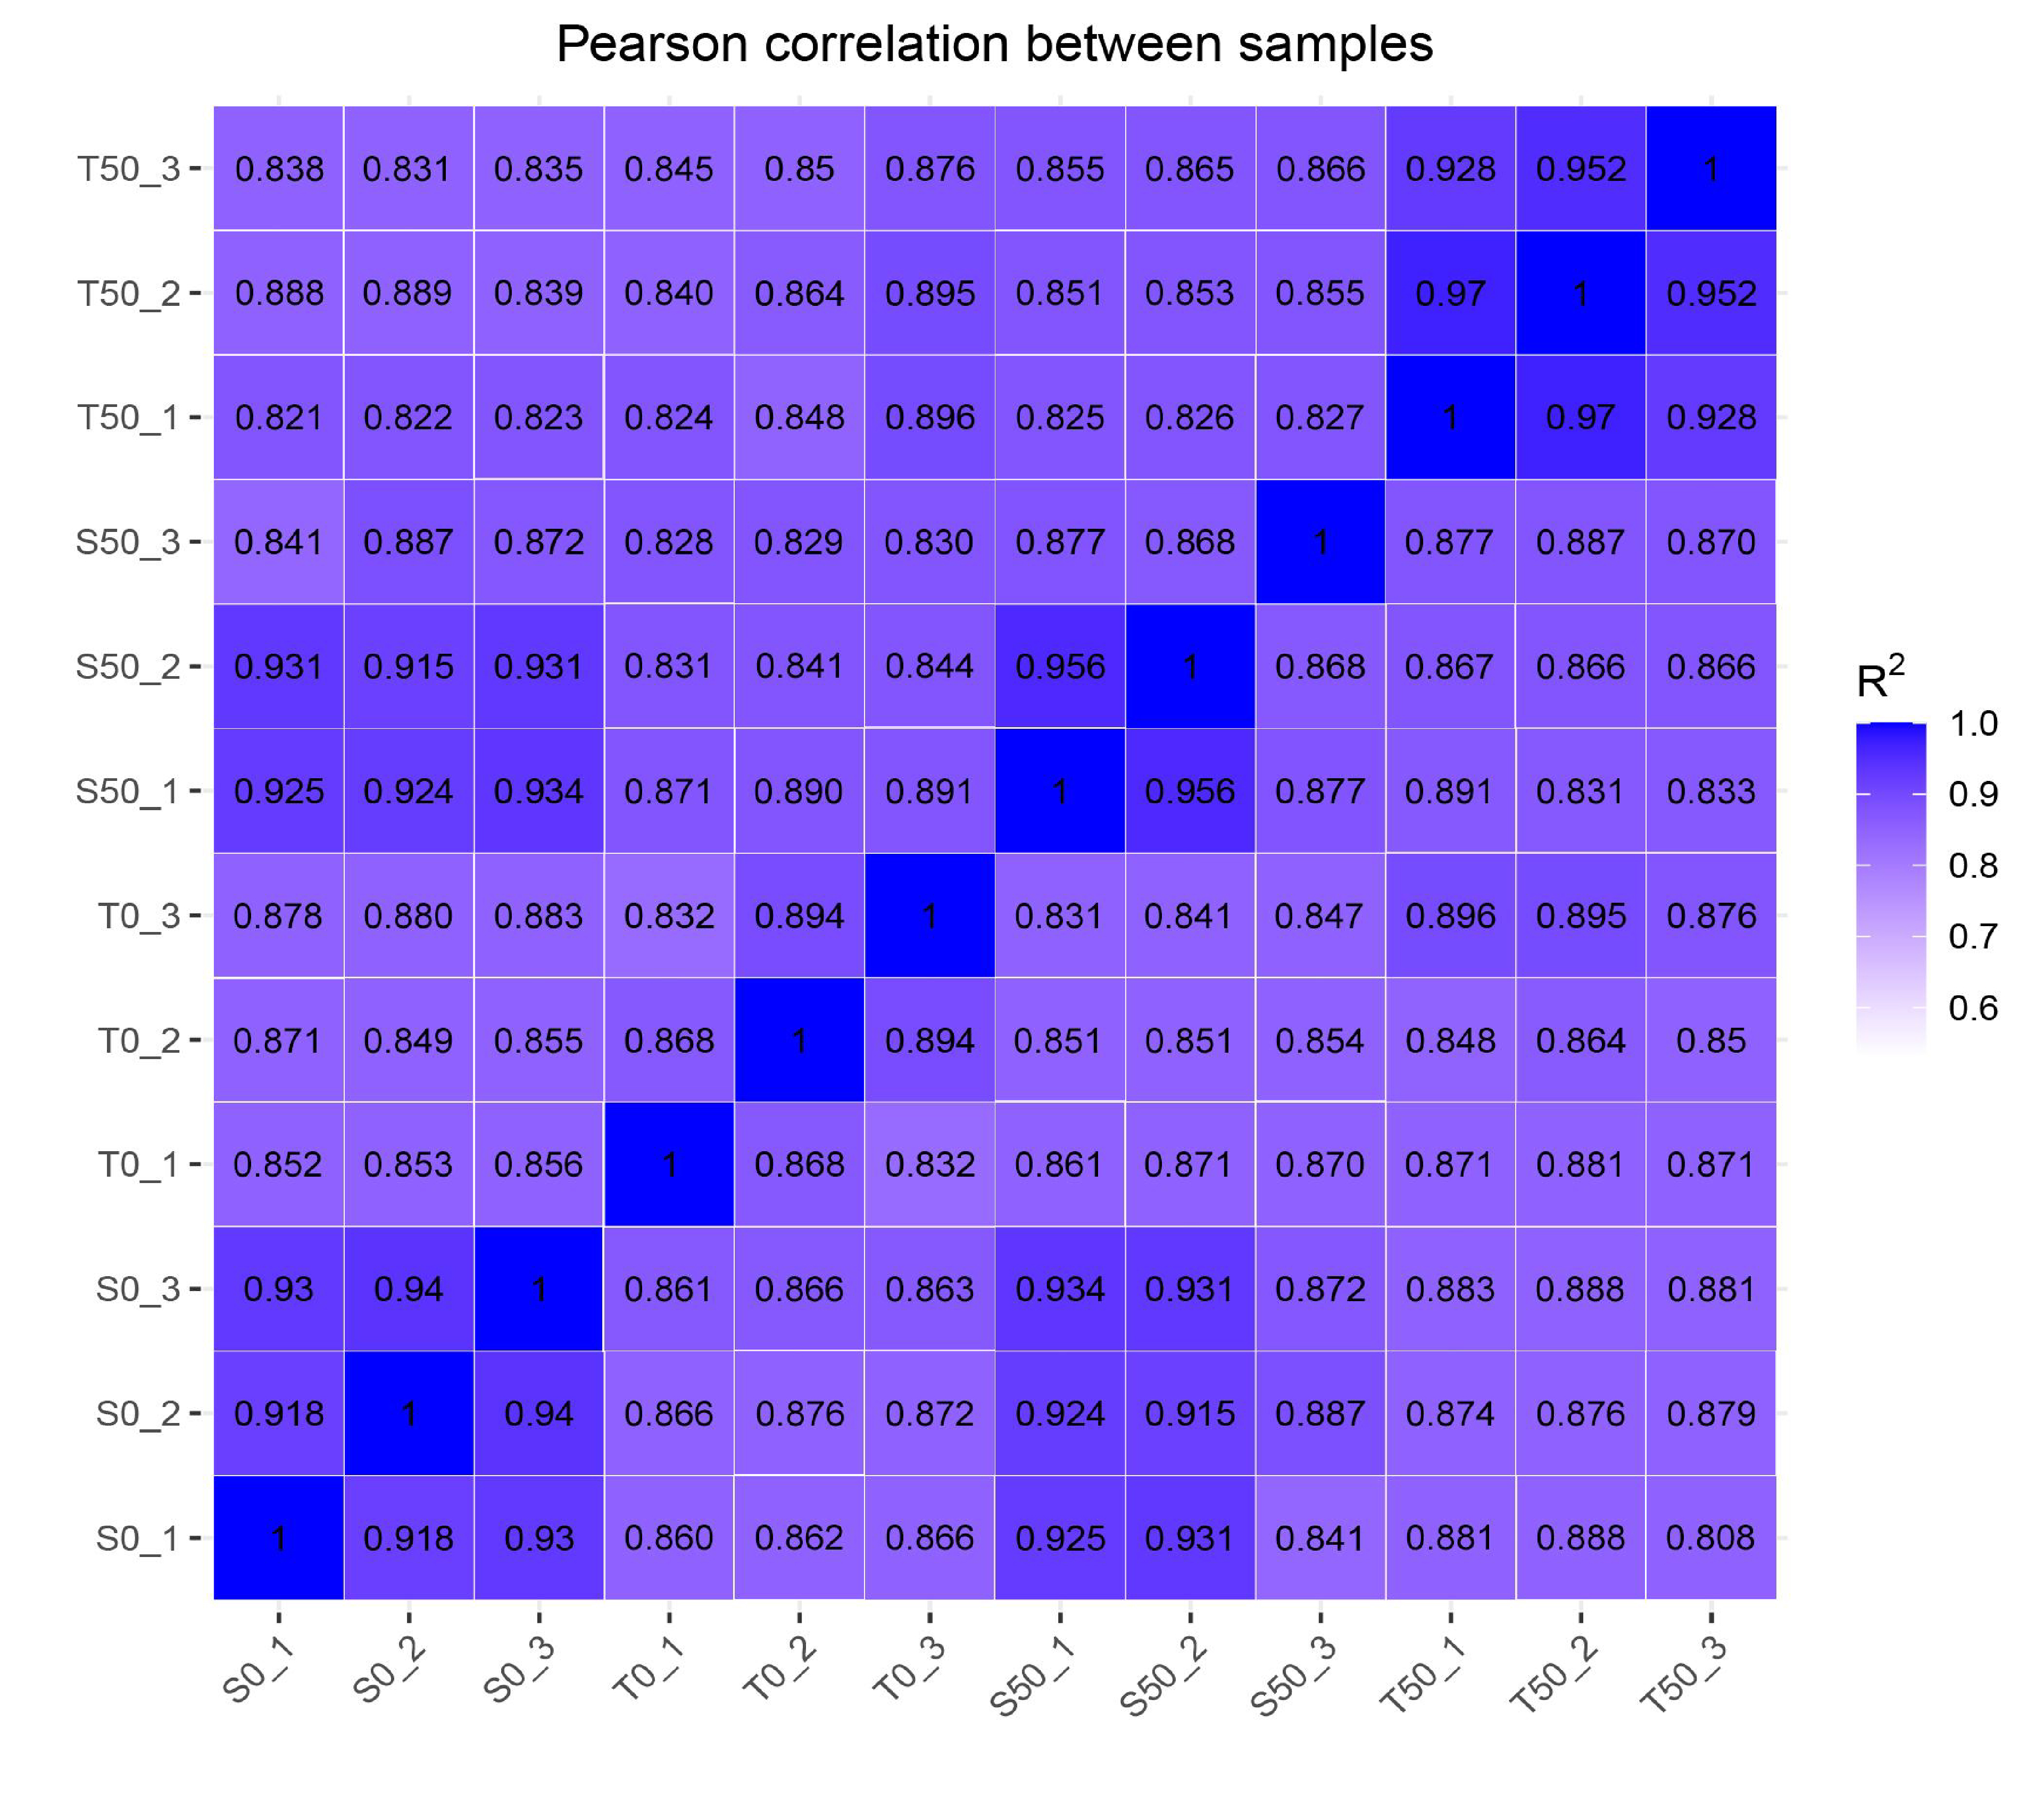
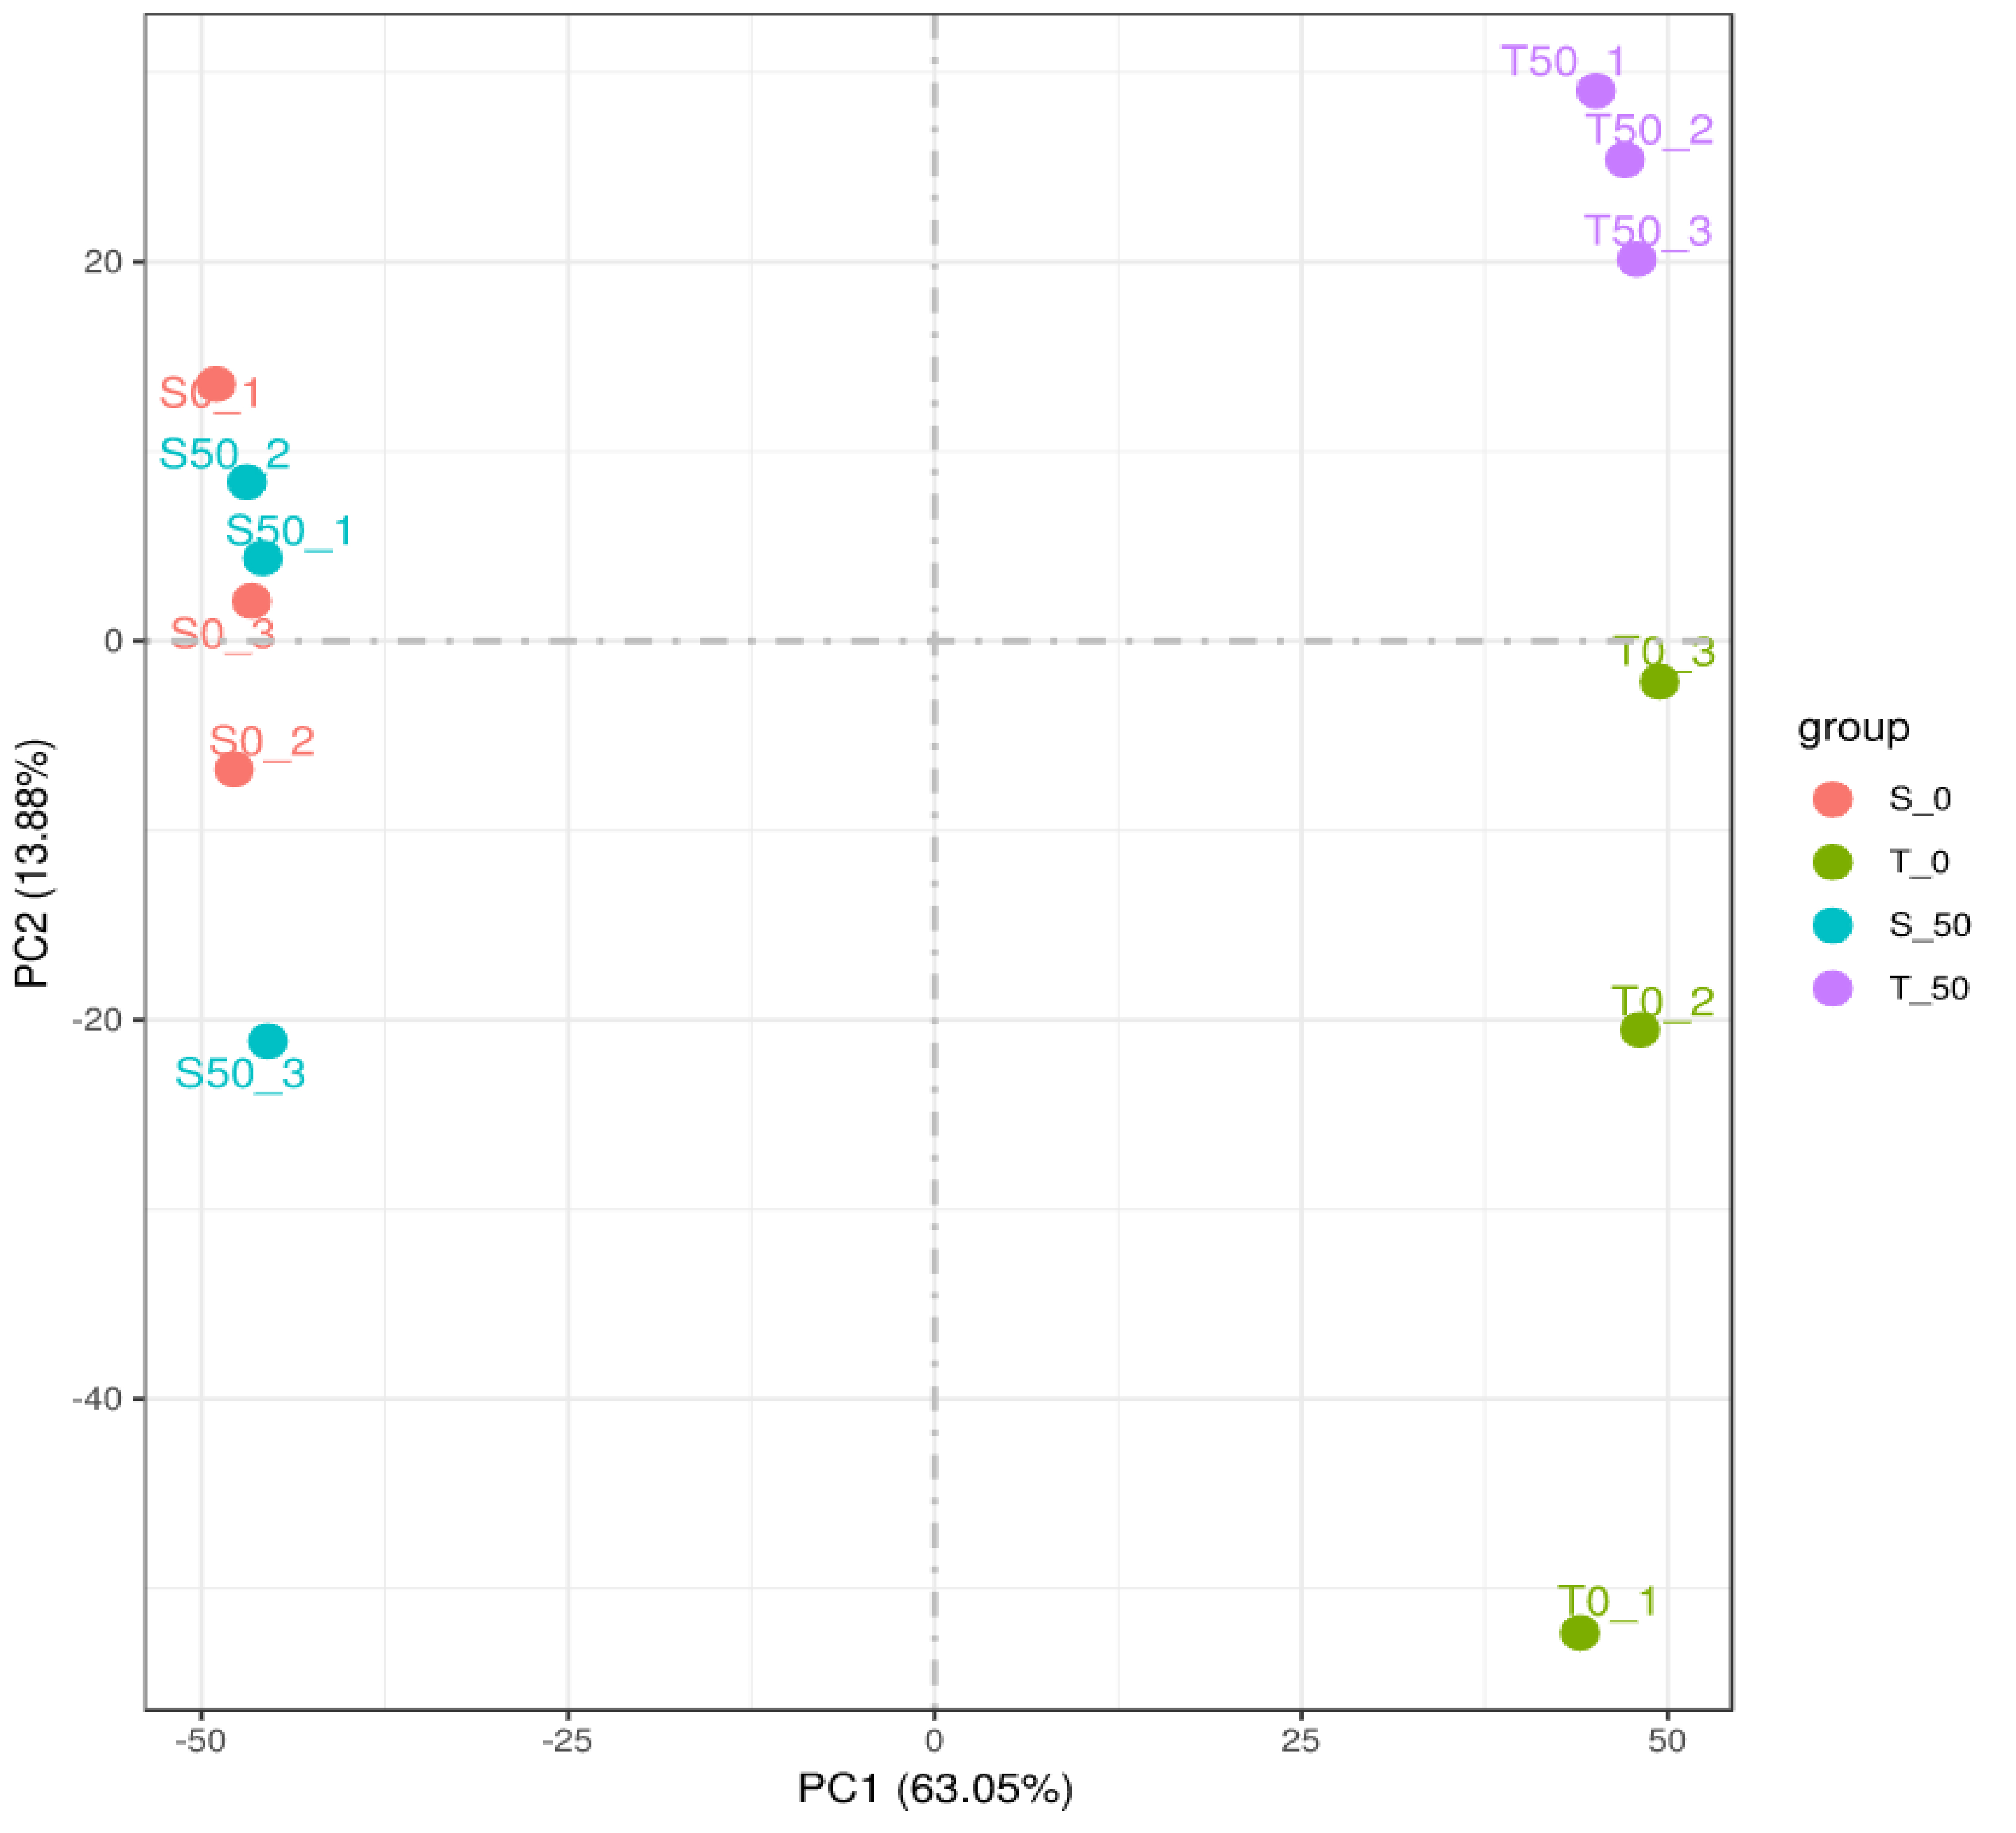
To further assess the importance of amino acids in enhancing plant tolerance in alfalfa species, Transcriptome sequencing was performed after 50 mM NaCl treatment of M. sativa and M. truncatula seedlings, and a total of 75.76 Gb of pure data were obtained. The results showed that the sequencing results of M. sativa and M. truncatula seedlings after 50 mM NaCl treatment were highly correlated with the sequencing results of the respective controls (R2>0.8), indicating reliable biological replicates (Fig. S1). The results of principal component analysis (PCA) showed that PCA values were distributed more discrete between M. sativa and M. truncatula species and separated mainly in the PC1 direction (Fig. S2), indicating that compared with S0 and T0, S50 and T50 showed significant differences in transcript levels.
The KEGG heatmap of transcriptional sequencing was drawn based on the expression of DEGs in control and experimental groups of M. sativa and M. truncatula. From Fig. 3, we can know that most of the DEGs are involved in the metabolism of other amino acids and lipid metabolism these 2 KEGG pathways. Compared with the control groups, the expression of DEGs contained in metabolism of other amino acids and carbohydrate metabolism of M. sativa and M. truncatula subjected to salt treatment did not change significantly, the expression of DEGs in the amino acid metabolism pathway showed a decreasing trend, while the expression of DEGs in the lipid metabolism pathway showed a significant increasing trend.
In this experiment, genes with adjusted P value < 0.05 and absolute fold changes ≥ 2 were considered significant DEGs. The differentially expressed amino acids involved in the KEGG pathway in this study were statistically analysed and the results are shown in Table 1. The results showed that after 50 mM NaCl treatment, there were no significantly expressed amino acid metabolic pathways in M. sativa (S0 vs S50), while valine, leucine and isoleucine degradation was significantly expressed in M. truncatula (T0 vs T50) and most of the DEGs which participate in the pathways were down-regulated. When comparing the control group of M. sativa and M. truncatula (S0 vs T0), tyrosine metabolism was found to be significantly expressed and most DEGs were down-regulated. When comparing the treatment groups of M. sativa and M. truncatula (S50 vs T50), not only tyrosine metabolism but also glutathione metabolism was significantly expressed, with the difference that the majority of DEGs involved in tyrosine metabolism were down-regulated, while those involved in glutathione metabolism were up-regulated.
Table 1 Summary of amino acid metabolic pathways involved in DEGs of the transcriptome in each groups
|
Groups
|
Name of KEGG pathways
|
up-regulation
|
down-regulation
|
Total
|
|
S0 vs S50
|
-
|
-
|
-
|
-
|
|
T0 vs T50
|
Valine, leucine and isoleucine degradation
|
3
|
16
|
19
|
|
S0 vs T0
|
Tyrosine metabolism
|
1
|
5
|
6
|
|
S50 vs T50
|
Tyrosine metabolism
|
3
|
7
|
33
|
|
Glutathione metabolism
|
20
|
3
|
Note: S0 stands for M. sativa control group; T0 stands for M. truncatula control group; S50 stands for M. sativa under 50 mM NaCl treatment; T50 stands for M. truncatula under 50 mM NaCl treatment;
The GSEA analysis was used to analyze whether the amino acid metabolism was the important pathway which many DEGs participate in. The results showed that a total of 24,460 genes were detected in the S0 and S50 groups, 28,444 genes in the T0 and T50 groups, and 27,968 genes in the S50 and T50 groups. A total of 2 KEGG pathways which were acid metabolism with significant differences were detected in this experiment, namely valine, leucine and isoleucine degradation (NES=1.887, FDR=0.045, P=0.000) detected in T0 and T50 groups, another is tyrosine metabolism (NES=1.769, FDR=0.085, P=0.043) which was found in S50 and T50 groups (Fig. 4). Meanwhile ,the significantly expressed amino acid metabolic pathways were expressed as shown in Fig. 5, which shows that the metabolism of leucine, isoleucine and valine showed an increasing and then decreasing trend, while tyrosine and glutathione showed a decreasing trend.
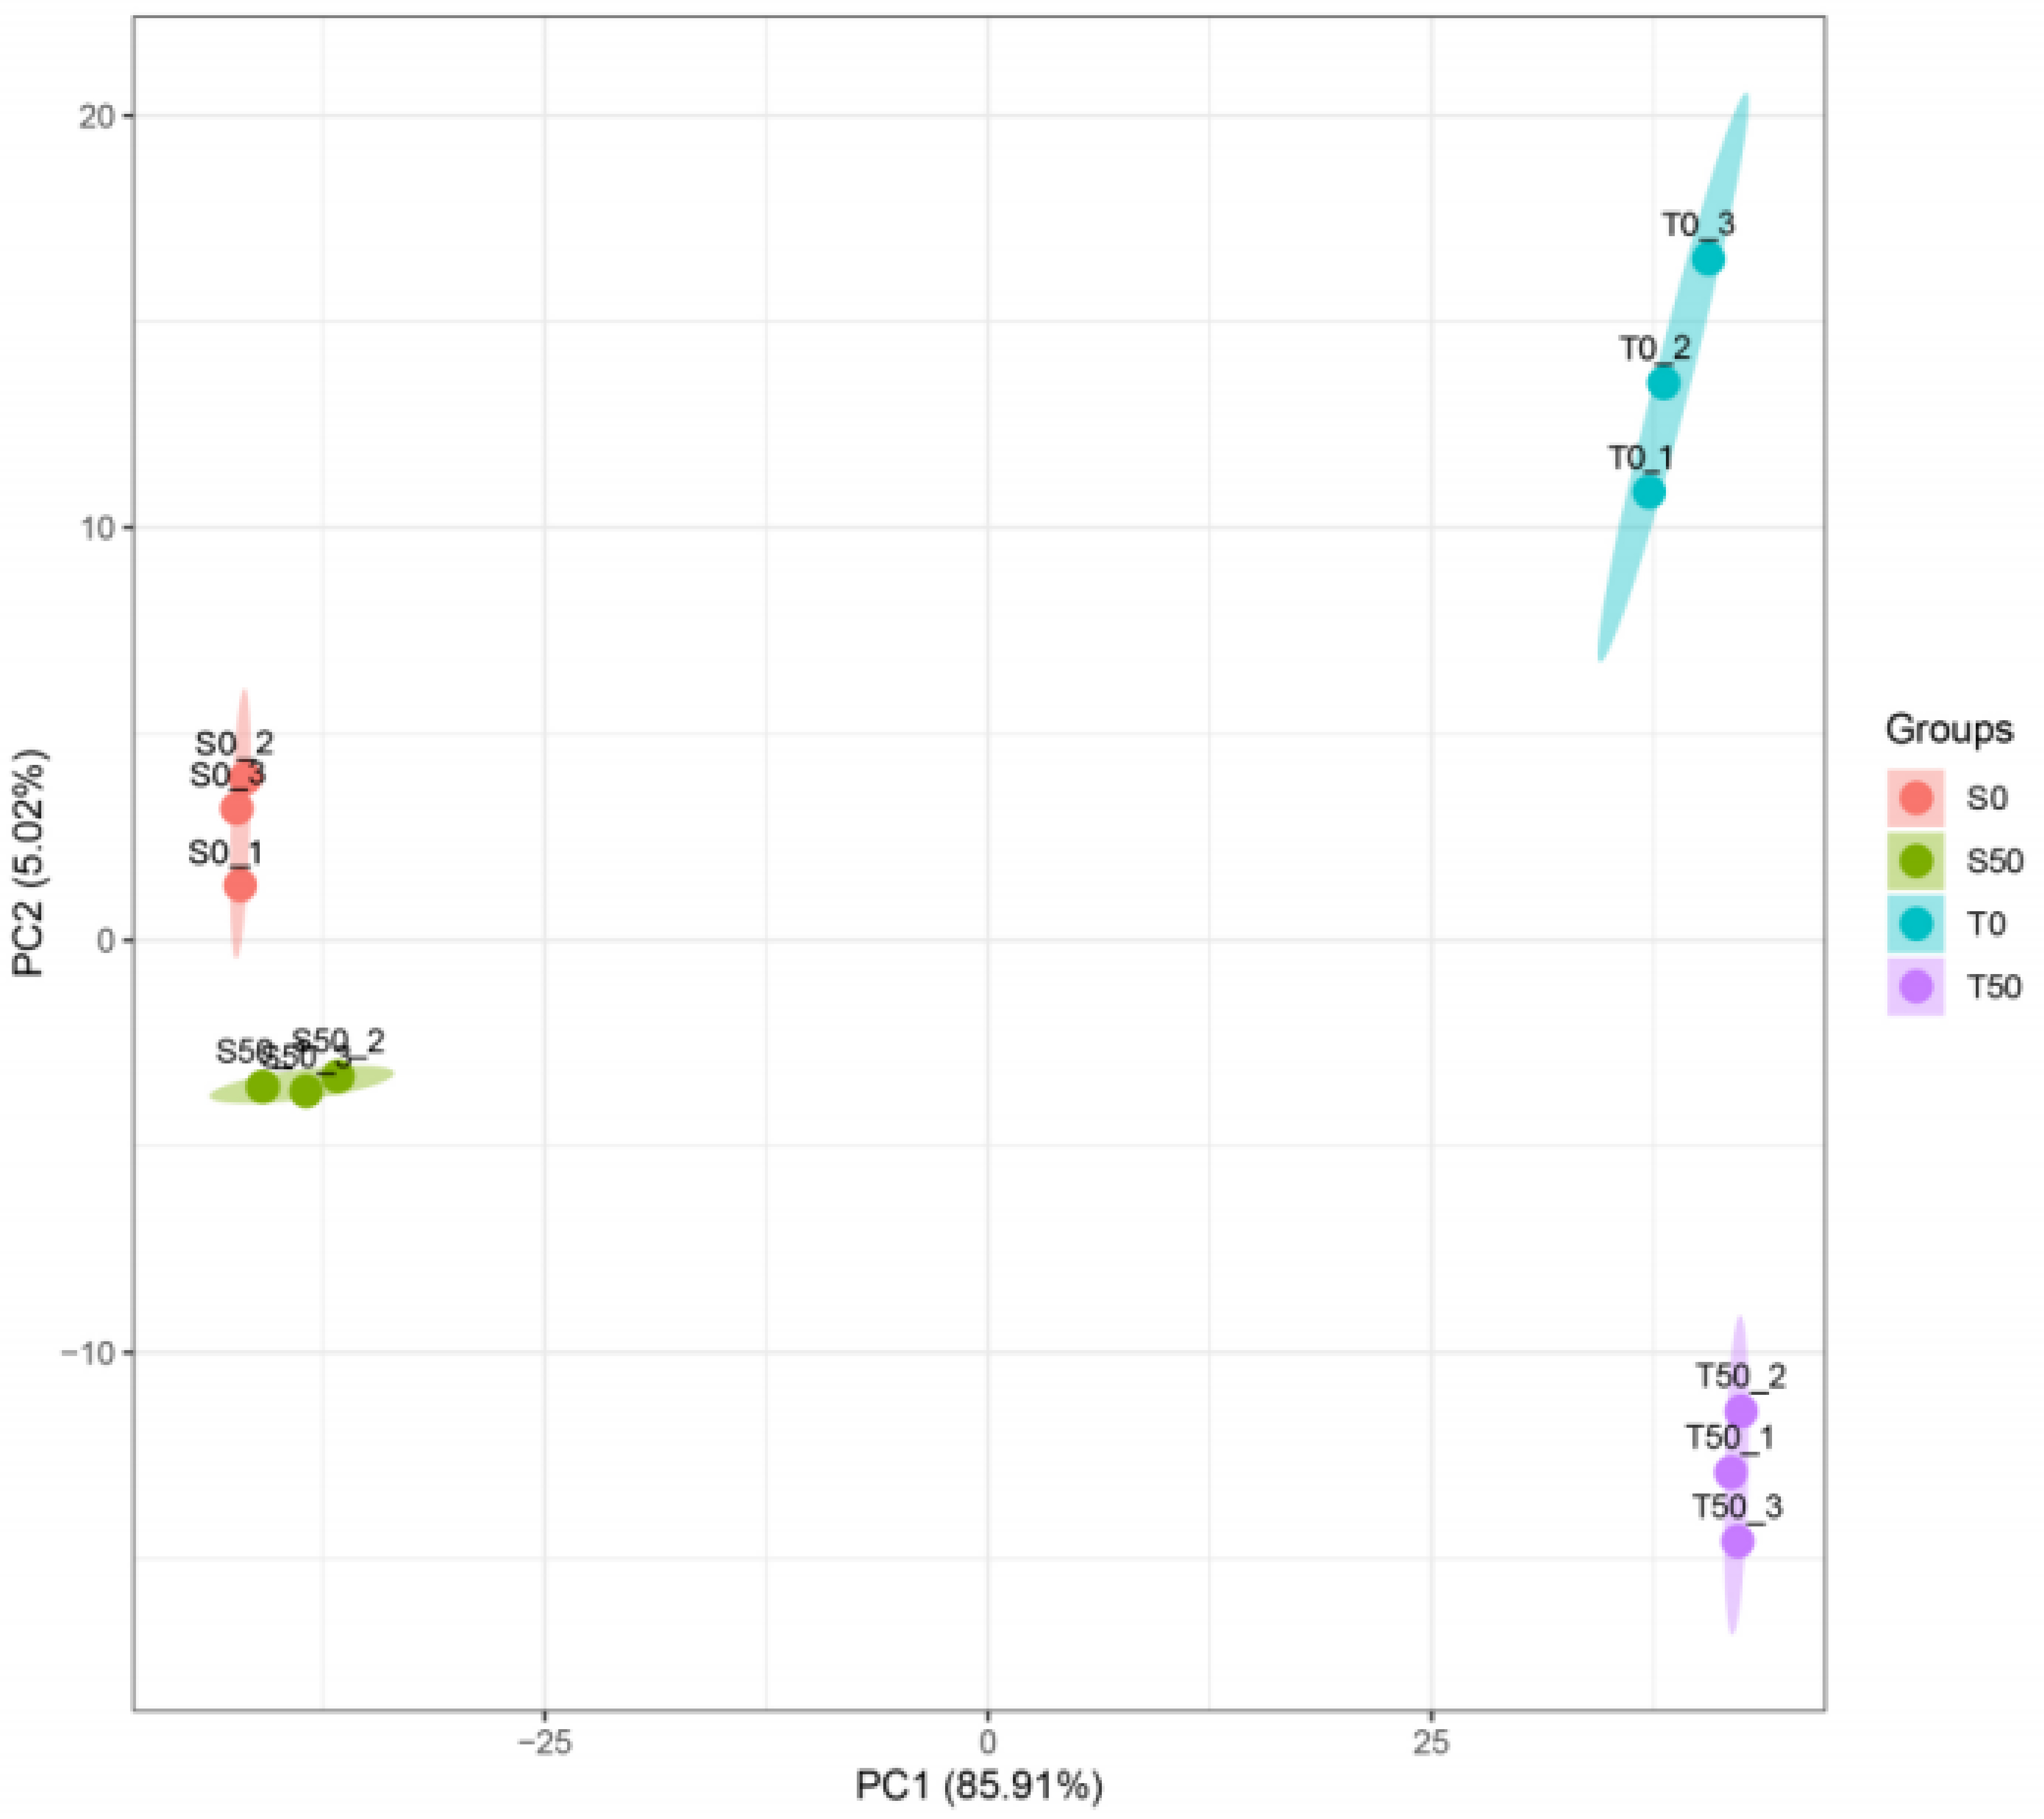
The 50 mM NaCl treatment of M. sativa and M. truncatula seedlings for proteome sequencing yielded a total of 266,819 spectra, including 71,265 matched spectrum, 42,350 peptides, 7,192 proteins identified, and 7,154 total proteins for all quantifiable proteins (Table 2). The results of principal component analysis (PCA) showed that the PCA values of T50 were discrete in the PC2 direction compared with the control, while the PCA values between M. sativa and M. truncatula species were discrete in the PC1 direction (Fig. S3), indicating that there was species were significantly different from each other at the protein level.
Table 2. General overview of protein identification
|
Total spectra
|
Matched spectrum
|
Peptide
|
Identified protein
|
ALL
|
|
266819
|
71265
|
42350
|
7192
|
7154
|
We also used the expression data of DEPs to draw the heatmap of proteomics and find whether there were many amino metabolism involved in, from the results of proteomic analysis, the expression of most of the DEPs in the KEGG pathway was significantly increased in M. sativa compared to M. truncatula. Meanwhile, after 50 mM NaCl treatment, the expression of the majority of DEPs which involved in metabolism of other amino acids and carbohydrate metabolism did not change significantly, as can be seen from Fig. 6. Compared with the control, the expression of the majority of DEPs involved in lipid metabolism showed an upward change, and the expression of DEPs involved in amino acid metabolism showed a downward trend, which was consistent with the changes in the results of transcriptomics analysis(Fig. 3).
In this experiment, we selected to screen up-regulated expression proteins when FC ≥ 2.0 while P value ≤ 0.05, and down-regulated expression proteins when FC ≤ 0.50 while P value ≤ 0.05. The results showed that there were 0 differentially expressed DEP which participate in amino acid metabolism detected in M. sativa after 50 mM NaCl treatment compared with the control (S0 vs S50). Only 1 DEP which was down-regulated was detected in seedlings of M. truncatula treated with 50 mM NaCl compared with the control in amino acid metabolism (T0 vs T50). Comparing M. sativa and M. truncatula control-treated seedlings, a total of 21 DEPs were detected in amino acid metabolism, of which 14 were up-regulated and 7 were down-regulated (S0 vs T0). Comparing 50 mM NaCl-treated M. sativa and M. truncatula seedlings, there were 3 significant amino acid metabolism expressed (S50 vs T50), among these 3 pathways, DEGs in tryptophan metabolism and tyrosine metabolism were predominantly down-regulated, while DEGs in glutathione metabolism were predominantly up-regulated (Table 3).
Table 3. Summary of amino acid metabolic pathways involved in DEGs of the proteomics in each groups
|
Groups
|
Name of KEGG pathways
|
up-regulated
|
down-regulated
|
Total
|
|
S0 vs S50
|
-
|
-
|
-
|
-
|
|
T0 vs T50
|
Valine, leucine and isoleucine degradation
|
0
|
1
|
1
|
|
S0 vs T0
|
Glutathione metabolism
|
14
|
7
|
21
|
|
S50 vs T50
|
Tryptophan metabolism
|
2
|
4
|
49
|
|
Tyrosine metabolism
|
1
|
8
|
|
Glutathione metabolism
|
24
|
10
|
To investigate the function of amino acid metabolism in M. sativa and M. truncatula after 50 mM NaCl treatment, a combined transcriptomics and proteomics analysis was performed. The results showed that M. sativa and M. truncatula obtained a few differentially expressed DEGs/DEPs after treatment with 50 mM NaCl compared with the control,respectively. While there were a total of 563 DEGs/DEPs were obtained with differential expression at the gene and protein levels comparing between the seedlings of M. sativa and M. truncatula treated with 50 mM NaCl. At the same time, the KEGG enrichment analysis showed that there were 19 KEGG pathways were detected as co-enriched by M. sativa and M. truncatula after treatment with 50 mM NaCl. After analyzing the 563 shared proteins, these proteins were found to be predominantly enriched in 3 categories, including amino acid metabolism, metabolism of other amino acids and lipid metabolism(Table S2). Among these pathways, we found that proteins which participate in glutathione metabolism are most, following the pathway linoleic acid metabolism, and finally are tryptophan metabolism. The results of the correlation analysis showed that amino acid also played an important role in 2 alfalfa species, which is consistent with heatmap analysis and GSEA analysis.
3.3. Quantitative analysis of amino acids
Based on the results of transcriptome and proteomics, this experiment selected Tyr, Leu and Ile this 3 amino acids to determine the contents of in leaves and roots of M.sativa and M. truncatula were detected respectively. The results are shown in Fig.7. From Fig. 7, it can be seen that the content of three amino acids in leaves was significantly higher than that in roots. The Leu content in M. sativa and M. truncatula is the highest, followed by the Ile content, and the Tyr content is the lowest. After 50 mM NaCl treatment, the contents of three amino acids in leaves and roots of M. sativa and M. truncatula were significantly higher than those of their respective control groups (P < 0.05 ). At the same time, this study found that in the whole plant (root + leaves), the Leu content of M. sativa was always higher than that of M. truncatula, while the Tyr content was always lower than that of M. truncatula, indicating that Leu and Tyr may be important amino acids that affect the salt resistance of determine the 2 species of alfalfa.
3.4. Epitaxial experimental validation
In order to verify the effect of Leu, Ile and Tyr on the salt tolerance of M. sativa and M. truncatula, a series of epitaxial experiments were done in this experiment. At the same time, due to the Pro has been shown to have a mitigating effect on salt stress, it was used as a marker to assess whether the other three amino acids have a positive effect on alfalfa salt stress. From Fig. 8, it can be seen that after adding three amino acids, compared with the salt treatment groups, all biochemical indexes of M.sativa and M. truncatula showed a decreasing trend. After adding Leu, the chlorophyll content of the two alfalfa was significantly higher than that of other amino acids ( P < 0.05 ), and the CAT and POD content of alfalfa was significantly lower than that of Pro ( P < 0.05 ). Interestingly, after adding Tyr, the content of SOD and H2O2 in M. truncatula was significantly lower than that of Pro group ( P < 0.05 ). While after adding Ile treatment, most of its indicators are between the two. In conclusion, the three amino acids all improved the salt resistance of the two alfalfa species, and Leu had a better effect on M. sativa while Tyr on M. truncatula, which was consistent with the quantitative results of amino acids, indicating that Leu and Tyr may be important factors affecting the salt resistance mechanism of the 2 species of alfalfa.