Hypertension is a recognized comorbidity for COVID-19. The contribution of medications to COVID-19 morbidity in hypertensive patients is unknown; however, ACE2, responsible for SARS-CoV-2 cell entry, is upregulated in patients taking ACEI and ARB antihypertensive drugs. Here, we evaluated prevalence of pulmonary adverse drug events (ADEs) in hypertensive patients receiving ACEIs/ARBs to help elucidate how these medications may affect clinical outcomes in acute respiratory illnesses. ADEs reported to the FDA’s Adverse Event Reporting System for hypertensive patients taking ACEI or ARB drugs show a cluster of pulmonary symptoms potentially exacerbating symptoms in COVID-19 patients. We found that retrospective analysis of 13 predominant pulmonary ADEs showed significant differences in ADEs associated with Quinapril and Trandolapril, compared to all other ACEIs and all ARBs. This study suggests that specific members of the ACEI hypertensive class (Quinapril and Trandolapril) have a cluster of pulmonary ADEs which could impact the management of COVID-19 patients.
Research Article
Pulmonary Adverse Event Data in Hypertension with Implications on COVID-19 Morbidity
https://doi.org/10.21203/rs.3.rs-37854/v1
This work is licensed under a CC BY 4.0 License
Version 1
posted
You are reading this latest preprint version
COVID-19
ACEI and ARB antihypertensive drugs
Hypertension
Pulmonary adverse drug events
Following the outbreak of a novel betacoronavirus, SARS-CoV-2, in Wuhan, China in late 2019, numerous questions have emerged regarding the effect comorbidities and their associated medications—including angiotensin-converting enzyme inhibitors (ACEIs) and angiotensin-II receptor blockers (ARBs)—may have on the infection’s clinical course. Studies to address the role of these drugs in COVID-19 pathogenesis have primarily focused on broad drug classes rather than individual drugs within a class. However, our recent investigation of renin-angiotensin system (RAS) inhibitors in diabetic patients identified only Captopril as having a unique cluster of multiple pulmonary adverse drug events (ADEs) that could impact the pulmonary symptomology of COVID-191.
The RAS is a complex pathway that regulates, among other things, blood pressure and cardiovascular remodeling2. Nearly half of adults in the United States have hypertension and ACEIs/ARBs are recommended as first-line agents in non-black patients with hypertension, making use of these medications widespread3,4. Angiotensin-converting enzyme receptor 2 (ACE2) is a counter-regulatory carboxypeptidase of the RAS and the cellular receptor responsible for the viral entry of SARS-Cov-2. ACE2 is predominately expressed in the heart, intestine, kidney, and pulmonary alveolar cells and is upregulated in patients taking ACEIs and ARBs as well as those receiving ibuprofen and thiazolidinediones 5,6,7.
Mounting evidence indicates that patients with underlying comorbidities, such as hypertension, are at a higher risk of a severe clinical course with COVID-19. However, studies to evaluate if ACEI/ARB use is associated with a higher risk of severe COVID-19 infection as well as increased
risk of contracting COVID-19, have failed to find a significant difference5,7. As a result, clinicians have been left to answer patient’s questions without confirmatory data8. Unfortunately, studies conducted by drug class may unintentionally limit interpretation of the impact specific drugs may have and the resultant clinical effects on COVID-19. Patients with hypertension are reported to have a 2.5-fold increased risk in developing severe COVID-19 or dying from it, therefore the present study reports on a retrospective analysis of curated ADE databases to evaluate the incidence of a cluster of pulmonary ADEs in hypertensive patients taking ACEIs or ARBs9. Although the nature of ACEI/ARB interaction in COVID-19 infection is unresolved, we hypothesized that specific drugs within the ACEI/ARB classes with more commonly reported pulmonary ADEs may worsen acute pulmonary disease states, including SARS-CoV-2 infection.
A total of 296,359 ADEs were reported by the FDA’s Adverse Event Reporting System (FAERS) from the first quarter of 2004 to the last quarter of 2019, including the April 2020 MedDRA update. Thirteen pulmonary ADEs (pulmonary edema, pleural effusion, oropharyngeal pain, dyspnea, dysphonia, cough, sinusitis, pneumonia, nasopharyngitis, bronchitis, pneumonia aspiration, emphysema, and pleurisy) were then isolated from all reported ADEs, based on their potential impact on acute pulmonary illnesses such as COVID-1910,11,12,13,14,15. Of the 8,687 reported pulmonary ADEs for ACEIs (Captopril, Lisinopril, Quinapril, Ramipril, Enalapril, Perindopril, Fosinopril, Cilazapril, Benazepril, Trandolapril), 3292 were related to the above-mentioned pulmonary ADEs. Of the total 1,440 reported pulmonary ADEs for ARBs (Azilsartan, Irbesartan, Losartan, Olmesartan, Telmisartan, Valsartan), 1,290 were related to pulmonary ADEs.
Fig. 1 illustrates the percent incidence of pulmonary ADEs reported for all ACEIs and ARBs studied, see also Figs. S1 and S2 in SUPPLEMENTARY DATA. As seen in Table 1, the Friedman test indicated that the pulmonary ADEs associated with the ACEI Quinapril was statistically significantly different compared to ACEIs-2 (𝑝 < 0.001; excludes Quinapril and Trandolapril) as well as ARBs (𝑝 = 0.0007). Trandolapril, another ACEI, was statistically significantly different compared to ACEIs-2 (𝑝 = 0.0001; excludes Quinapril and Trandolapril). The results indicated that all the seven comparative analyses were extremely significant, especially when comparing ACEIs-2 vs. ARBs vs. Quinapril vs. Trandolapril (𝑝 < 0.0001), except for the ACEIs-2 vs. ARBs (𝑝 = 0.1481) and Quinapril vs. Trandolapril (𝑝 = 0.1864).
Fig. 1: Percent incidence of pulmonary adverse drug events reported for ACEIs and ARBs in hypertensive patients.
Table 1: The results of Friedman tests comparing seven pairwise/groups were calculated using ACEIs-2, ARBs, Quinapril, and Trandolapril.
|
Pairwise/Group Comparison |
P-value |
|
ACEIs-2 vs. ARBs vs. Quinapril vs. Trandolapril |
*<0.0001 |
|
ACEIs-2 vs. ARBs |
0.1481 |
|
ACEIs-2 vs. Quinapril |
*<0.0001 |
|
ACEIs-2 vs. Trandolapril |
*0.0001 |
|
ARBs vs. Quinapril |
*0.0007 |
|
ARBs vs. Trandolapril |
*0.0004 |
|
Quinapril vs. Trandolapril |
0.1864 |
*: denotes statistical significance (𝑝 < 0.05)
KEY: ARBs: angiotensin receptor blockers; ACEIs-2: angiotensin-converting enzyme inhibitors excluding Quinapril and Trandolapril
Fig. 2 depicts the optimal representation of two active variables (ADEs) in biplots acquired by PCA and correspondence analysis, which diminishes the effect of supplementary variables that have no or little influence on the ACEI/ARB drugs. The first and second principal components, PC1 and PC2, explaining approximately 90% of variation are presented by the two axes of variation in the proportional reporting ratio (PRR) of ACEIs and ARBs and account for 68.03 and 19.26% of the variation, respectively. Arrows are used to reflect all the variables of pulmonary ADEs, and filled circles show drugs using different colors. The cluster pattern of ACEI and ARB drugs shows three groups: Quinapril, Trandolapril, and the other ACEIs-2 and ARBs as one group. This results in a triangle shape where each group occupies a different vertex of the triangle. Also depicted in Fig. 2, sinusitis and pneumonia aspiration have the largest positive loadings on PC1 (pointing to the positive direction of PC1), while dysphonia, cough, and nasopharyngitis have the largest negative loadings on PC2 (pointing downward in the negative direction of PC2).
Fig. 2: Principal component analysis of proportional report ratios for ACEIs and ARBs.
Table 2 shows the results of PRR for each of the thirteen ADEs given each drug against the same ADE from other drugs in the same or different classes. The results of each PRR for sixteen ACEI/ARB drugs are obtained from equations (1) and (2) as compared to the ratio factors 2 and 1, respectively, shown by the black-dashed and grey-dash lines in each panel, and more than 3 incidences reported for each drug-ADE combination in Table 2.
Table 2. ADEs (flagged red) meeting criteria for reporting. Numbers in the table indicate how many criteria of these three are met: criteria 1) more than 3 incidences, criteria 2) a PRR > 2, and criteria 3) a PRR that is > than the lower 95% confidence interval boundary with the lower confidence interval being greater than 116. ADEs meeting all three criteria are flagged red.

Fig. 3 shows the results of PRR and corresponding confidence interval for each of the thirteen ADEs given each drug against the same ADE from other drugs in the same or different classes. The results, including the confidence interval of each PRR for sixteen drugs of ACEIs and ARBs, are obtained from equations (1) and (2) as compared to the ratio factor 1 shown by the black- dashed line in each panel of Fig. 3. As depicted in each panel, most PRRs with their confidence intervals given an ADE-drug combination are distributed around PRR=1 or ≤1 while Quinapril and Trandolapril remain on the right-hand side of PRR=1 with only one exception of Emphysema in Quinapril, corroborating our findings in Tables 1 and 2 and Fig. 2.
Fig. 3: PRR ranges and corresponding confidence intervals for all thirteen ADEs and sixteen ACEI and ARB drugs with Quinapril and Trandolapril significantly different from others shown in red. Two different shadings are used to identify PRR ≥𝟏 by gray background and PRR ≥ 𝟐 by white diagonal lines.
This retrospective analysis results in three points to consider—first, when conducting multifactor analyses across clinical databases containing complex disease processes, individual drugs rather than drug classes should be assessed as ADE profiles vary in a statistically significant manner. Second, ADEs are generally studied based on individual signs, which may mask patterns of symptoms reflecting dysfunction of a specific organ system. Namely, two ACEIs in this study, Quinapril and Trandolapril, were found to have a statistically significant difference in reported pulmonary ADEs that should be considered when evaluating how hypertension may potentiate COVID-19 morbidity and mortality. Third, our results prompt consideration of the etiology responsible for the differences in pulmonary ADEs of Quinapril and Trandolapril in comparison to other ACEIs. A previous study completed by the authors found that in evaluating these drugs in diabetic patients, only Captopril had a statistically significant difference in pulmonary ADEs— suggesting that underlying disease etiology plays a role in ADE reports. Patients commonly have comorbid conditions, which makes correlating specific patterns of ADEs difficult. Ultimately, it is important to realize that individual drugs—not entire classes—can potentially worsen concurrent pulmonary diseases, such as COVID-19, complicated even further by the complex, time- dependent, and divergent symptomology of COVID-19 itself.
That some covariates possess confounding factors does not diminish the impact of these ADEs on pulmonary issues. Correspondingly, in the COVID patient data, it was observed that these ADEs are present in all age, weight, and sex groups and since our assessment shows that there are no apparent negative effects caused by confounding factors, they seem to be extraneous variables which do not affect the PRR analysis of individual drugs vs. drug classes. We found that some ADEs (dysphonia, bronchitis, and pleurisy) are not significantly affected by any of these covariates.
Very few studies have analyzed the comparative potencies of ACEIs, and none have categorized Quinapril and Trandolapril together—and distinct from other ACEIs—as seen in our analysis of ADEs. It should be noted that it is their metabolites, Quinaprilat or Trandolaprilat (respectively), that are the active moieties in vivo. Hayase et al. 2003 reported that Quinaprilat and Trandolaprilat had the highest lipophilicity compared to other ACEIs and investigated their protection from damage affected by lysophosphatidylcholine (LPC)17. It was shown that these two ACEIs significantly reduced the LPC-induced hemolysis compared to other drugs in this class. However, this study did not look at ADEs related to these drugs and we have not examined the link between the ADE observed and the similarities in lipophilicity17.
One limitation of the present study is that it is a retrospective analysis of curated ADE databases from spontaneous reporting systems and nuances in reporting could affect our datasets. Because this project uses data voluntarily reported to the FAERS and MedDRA databases, it is unknown if the patterns depicted in our data are due to true underlying etiologies or simply, reporting patterns. Prevalence of hypertension is another major limitation, depicted by the fact that 29% of all Americans over the age of 18 have hypertension but that number dramatically increases to 63.1% for American adults over the age of 6018. This natural confounding of age and hypertension is a frequent limitation to discerning the impact RAS medications may have on the COVID-19 clinical course, made more difficult by the fact that older adults are more likely to be affected by both hypertension as well as SARS-CoV-27.
Our results emphasize that there are disparities of reported pulmonary ADEs between drugs within the same class, even though most drugs are typically grouped by their class. It is possible that conflicting data regarding the effect ACEIs/ARBs may have on SARS-CoV-2 infection is, in part, due to drugs being evaluated by class instead of individually, and that studies do not take into account different underlying comorbidities. Despite statistically significant differences of pulmonary ADEs reported for Trandolapril and Quinapril compared to other ACEIs as well as ARBs, more research is needed to determine the clinical significance regarding the management of pulmonary diseases, including COVID-19.
Definition of Adverse Events
The Food and Drug Administration (FDA) defines the term ‘adverse event’ as: “any untoward medical occurrence associated with the use of a drug in humans, whether or not considered drug related, including the following: an adverse event occurring in the course of the use of a drug product in professional practice; an adverse event occurring from drug overdose whether accidental or intentional; an adverse event occurring from drug abuse; an adverse event occurring from drug withdrawal; and any failure of expected pharmacological action”19,20.
Multidimensional Database Sources
The data used in this study have been curated from multiple publicly available data sources for hypertensive patients, including the FDA’s Adverse Event Reporting System (FAERS), which houses all ADEs reported to the FDA by pharmaceutical companies, healthcare providers, andconsumers. The data, including the hypertension dataset, is updated quarterly by the FDA and currently includes reports submitted from the first quarter of 2004 to the last quarter of 2019. This dataset focuses on drugs and their ADEs but includes additional data such as disease, drug, and demographic information as well as information related to patient outcome.
The data structure of these ADEs is organized in accordance with the Medical Dictionary for Regulatory Activities (MedDRA) terminology, along with the International Safety Reporting Guidance Database. We utilized the MedDRA hierarchy for regulatory information of medical products in hypertension, which is grouped based on etiology, manifestation site, or purpose. Here we utilized the 23.0 or earlier version of MedDRA, with the most recent update from April 2020 that includes new COVID-19 related terms and revisions.
Data Mining and Search Strategy
In alignment with our previous multidisciplinary work1,21, we implemented a three-stage approach to curate disparate databases and identified patients with hypertension including pulmonary arterial and intracranial hypertension. First, data mining algorithms were used to identify hypertension datasets and associated post-marketing ADEs for ACEI/ARB drugs that were prevalent among the top reported symptoms in COVID-19 patients. Next, as part of data cleaning, standard libraries were utilized to curate missing information or unify distinct groups within the data. For example, drug names in the FAERS database are reported by a combination of active ingredients, generic names, or brand names. Using PostgreSQL (PostgreSQL Global Development Group), allowed us to map and search all the possible drug names to drug parents in the DrugBank database (Alberta Innovates - Health Solutions, The Metabolomics Innovation Centre) creating a unified dataset22. Additionally, ADEs derived from unstructured data (e.g. text) needed data scrubbing, cleansing,and merging16. For this purpose, deep learning techniques were employed to implement and map the informatic structure of the FAERS database into the international safety reporting guidance coded using terms in MedDRA16. Finally, ADEs associated with medications in the ACEI and ARB classes administered to patients with hypertension were recorded.
Proportional Reporting Ratio
Statistical analysis was performed using SAS (SAS® University Edition version 9.4, North Carolina, U.S). First, data based on the frequency of each ADE related to respiratory, thoracic, and mediastinal disorders/infections were parsed in the MedDRA and FAERS databases. Specific ADEs collected were pulmonary edema, pleural effusion, oropharyngeal pain, dyspnea, dysphonia, cough, sinusitis, pneumonia, nasopharyngitis, bronchitis, pneumonia aspiration, emphysema, and pleurisy (Fig. 1). These ADEs were consistent with globally reported information, which found that pneumonia, pneumonitis, shortness of breath, cough, and sore throat were among the top reported symptoms in COVID-19 positive patients10,11,12,13,14,15. We then employed a method proposed and implemented by the FDA for analyzing ADE disproportionality in pharmacovigilance data by observed-expected ratios16. This method, the proportional reporting ratio (PRR), provides a statistical summary for the commonality of an ADE for a specific drug as compared to the entire database for drugs in the same or other classes16.
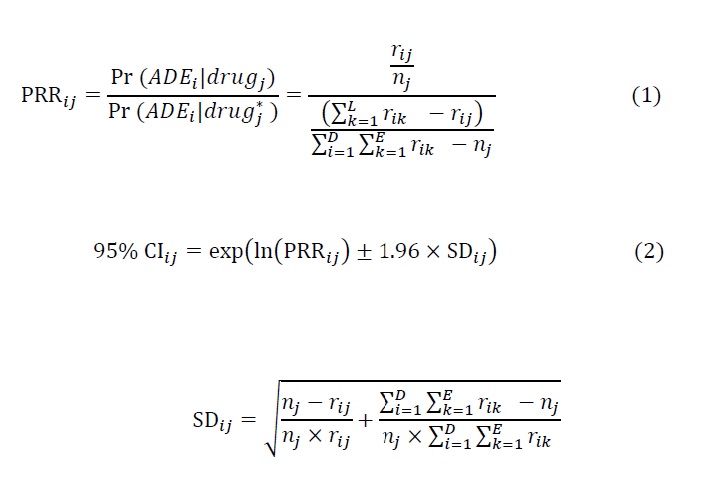
We then addressed confounding factors including patient demographics and drugs that are under- reported in voluntary reporting systems, including the FAERS, since conditional slicing and sub- setting can confine the use of quantitative signal detection methods such as PRR. For this purpose, we were able to correct the analysis after applying logistic regression for the known covariates of age, weight, and sex, and combine this approach with PRR to improve analyses of drug effects using the hypertension data sets. As a result, we found that the following identity is chiefly correct in numerous scenarios:
Pr(ADE|drug, age, weight, sex) = Pr (𝐴DE|drug)This helped us to estimate a PRR for a specific drug-ADE combination by calculating the following equation: (see Equation 1 in the Supplementary Files)
where 𝑟𝑖𝑗 gives the total number of a specific ADE 𝑖 ∈ {1,2, . . , 𝐸} for a given drug 𝑗 in {1,2, . . . , 𝐷}. Here 𝐸 and 𝐷 represent the number of all events and drugs in the drug class, respectively. 𝑑𝑟𝑢𝑔∗ denotes the drug class, excluding the specific drug 𝑗. Also, 𝑛𝑗 shows the total events for the given drug 𝑗. As the distribution of PRR samples are all positive, we then applied a log transformation to data and found the confidence interval23 using the following equation: (see Equation 2 in the Supplementary FIles)
Friedman Test Results
Using SAS, sample differences among the four groups—Quinapril, Trandolapril, ACEIs, and ARBs—were assessed for a pairwise analysis with the assumption that data were not normally distributed using the non-parametric Friedman test for two independent unequal-sized data. Friedman test was also applied to perform multiple comparison tests (P values for statistical significance < 0.05). For the non-parametric Friedman test of statistical significance, seven pairwise and multiple comparisons were performed based on the ARBs and ACEIs excluding Quinapril and Trandolapril, hence denoted as ACEIs-2. Tests performed included ACEIs-2 vs. ARBs, ACEIs-2 drugs vs. Quinapril alone, ACEIs vs. Trandolapril alone, Quinapril vs. ARBs, Trandolapril vs. ARBs, and Quinapril and Trandolapril vs. all ACEIs-2 and ARBs.
Principle Component Analysis
Principal components of PRR in pulmonary ADE for ACEIs and ARBs were calculated using the built-in function prcomp in R 3.6 (R Core Team, GNU GPL v2)24. Implementing principal component analysis (PCA) to the drugs with 13 pulmonary ADEs reduced the dimension into a smaller number of PCs, significantly explaining and visualizing variation of ACEIs and ARBs. Biplot was generated using the R package factoextra25.
Data availability
All the data supporting the findings in this study are available in the paper and Supplementary Information. Data related to this paper are available from the corresponding authors upon request.
Acknowledgements
GJW and MJD accepted funding from BioNexus KC for funding on this project but BioNexus KC had no direct role in this article. No other authors report any additional conflicts of interest or funding for this project.
Contributions
E.G.S.: Conceptualization, Validation, Resources, Writing - Original Draft, Visualization, Writing- Review & Editing; J.R.: Conceptualization, Writing - Review & Editing; X.X.: Conceptualization, Methodology, Software, Validation, Writing - Original Draft, Data Science; N.I.M.G.: Conceptualization, Software, Validation, Data Science; J.K.: Modelling, Writing - Review & Editing; G.J.W.: Conceptualization, Methodology, Validation, Writing - Original Draft, Writing - Review & Editing, Funding acquisition; M.J.D.: Conceptualization, Methodology, Software, Validation, Writing - Original Draft, Writing - Review & Editing, Funding acquisition, Data Science
- Stafford, E. G. et al. Pharmacovigilance in Patients with Diabetes: A Data-Driven Analysis Identifying Specific RAS Antagonists with Adverse Pulmonary Safety Profiles That Have Implications for COVID-19 Morbidity and Mortality. Am. Pharm. Assoc. (2020).
- Hilal-Danden, R. Renin and Angiotensin. in Goodman & Gilman’s: The Pharmacological Basis of Therapeutics (eds. Brunton, L. L., Hilal-Dandon, R. & Knollman, B. C.) (McGraw-Hill).
- James, P. A. et al. 2014 Evidence-Based Guideline for the Management of High Blood Pressure in Adults. JAMA 311, 507 (2014).
- Facts About Hypertension. Centers for Disease Control and Prevention.
- Mehra, M. R., Desai, S. S., Kuy, S., Henry, T. D. & Patel, A. N. Cardiovascular Disease, Drug Therapy, and Mortality in Covid-19. Engl. J. Med. NEJMoa2007621 (2020) doi:10.1056/NEJMoa2007621.
- Fang, L., Karakiulakis, G. & Roth, M. Are patients with hypertension and diabetes mellitus at increased risk for COVID-19 infection? Lancet Respir. Med. 8, e21 (2020).
- Mancia, G., Rea, F., Ludergnani, M., Apolone, G. & Corrao, G. Renin–Angiotensin– Aldosterone System Blockers and the Risk of Covid-19. Engl. J. Med. NEJMoa2006923 (2020) doi:10.1056/NEJMoa2006923.
- Allan S. Brett, M. ACE Inhibitors and ARBs During the COVID-19 Pandemic. NEJM J. Watch 2020, (2020).
- Lippi, G., Wong, J. & Henry, B. M. Hypertension and its severity or mortality in Coronavirus Disease 2019 (COVID-19): a pooled analysis. Polish Arch. Intern.(2020) doi:10.20452/pamw.15272.
- Coronavirus disease (COVID-19) Situation Report-108. https://www.who.int/ethics/publications/key-criteria-ethical-acceptability-of-.
- Madrigal, A. & Meyer, R. The COVID Tracking Project. The COVID Tracking Projecthttps://covidtracking.com/ (2020).
- European Centre for Disease Prevention and Control. COVID-19. Situation update worldwide, as of 6 April 2020. https://www.eceuropa.eu/en/geographical-distribution- 2019-ncov-cases (2020).
- Almukhtar, S. et al. Coronavirus in the U.S.: Latest Map and Case Count - The New York Times. The New York Times https://www.nytimes.com/interactive/2020/us/coronavirus- us-cases.html (2020).
- Dong, E., Du, H. & Gardner, L. An interactive web-based dashboard to track COVID-19 in real time. The Lancet Infectious Diseases 20 533–534 (2020).
- ai COVID-19 Data Lake - C3.ai. https://c3.ai/products/c3-ai-covid-19-data-lake/.
- S. Department of Health and Human Services Food and Drug Administration. Guidance for Industry Good Pharmacovigilance Assessment Guidance for Industry Practices and Pharmacoepidemiologic Assessment. Serv. U.S. Dep. Heal. Hum. Adm. Food Drug (CDER), Cent. Drug Eval. Res. Cent. Biol. Eval. Res. 1–20 (2005).
- Hayase, N. et al. Protective Effects of Quinaprilat and Trandolaprilat, Active Metabolites of Quinapril and Trandolapril, on Hemolysis Induced by Lysophosphatidylcholine in Human Erythrocytes. Pharm. Bull. 26, 712–716 (2003).
- Fryar, C. D., Ostchega, Y., Hales, C. M., Zhang, G. & Kruszon-Moran, D. Hypertension Prevalence and Control Among Adults: United States ,2015-2016. Centers for Disease Control National Center for Health Statistics (2017).
- Code of Federal Regulations 21CFR310.305. (Food and Drug Administration).
- Regulations, C. of F. 80.
- Xu, X. et al. Making Sense of Pharmacovigilance and Drug Adverse Event Reporting: Comparative Similarity Association Analysis Using AI Machine Learning Algorithms in Dogs and Cats. Companion Anim. Med. 37, (2019).
- Wishart, D. S. et al. DrugBank: a comprehensive resource for in silico drug discovery and exploration. Nucleic Acids Res. 34, 668–672 (2006).
- Böhm, R. Primer on Disproportionality Analysis. Openvigil (2015).
- prcomp function | R Documentation. https://www.rdocumentation.org/packages/stats/versions/3.6.2/topics/prcomp (2020).
- Package ‘factoextra’ Type Package Title Extract and Visualize the Results of Multivariate Data Analyses. https://github.com/kassambara/factoextra/issues (2020).