In the current paper, we obtained the following data: 1) COVID-19 cases and deaths (Supplemental Table 1); 2) Total country population, median age, senior citizens (aged>65 and aged>70 years) per population, and life expectancy (Supplemental Table 2); 3) Healthcare resources including the number of beds, physicians, nurses and midwives, GDP per capita, and out-of-pocket spending (Supplemental Table 3); 4) NCD-DALYs, HALE, and access to healthcare (HAQI) (Supplemental Table 4). The final analysis included data from 139 countries which had all the information needed for our study.
COVID-19 mortality, healthcare resources, and ageing
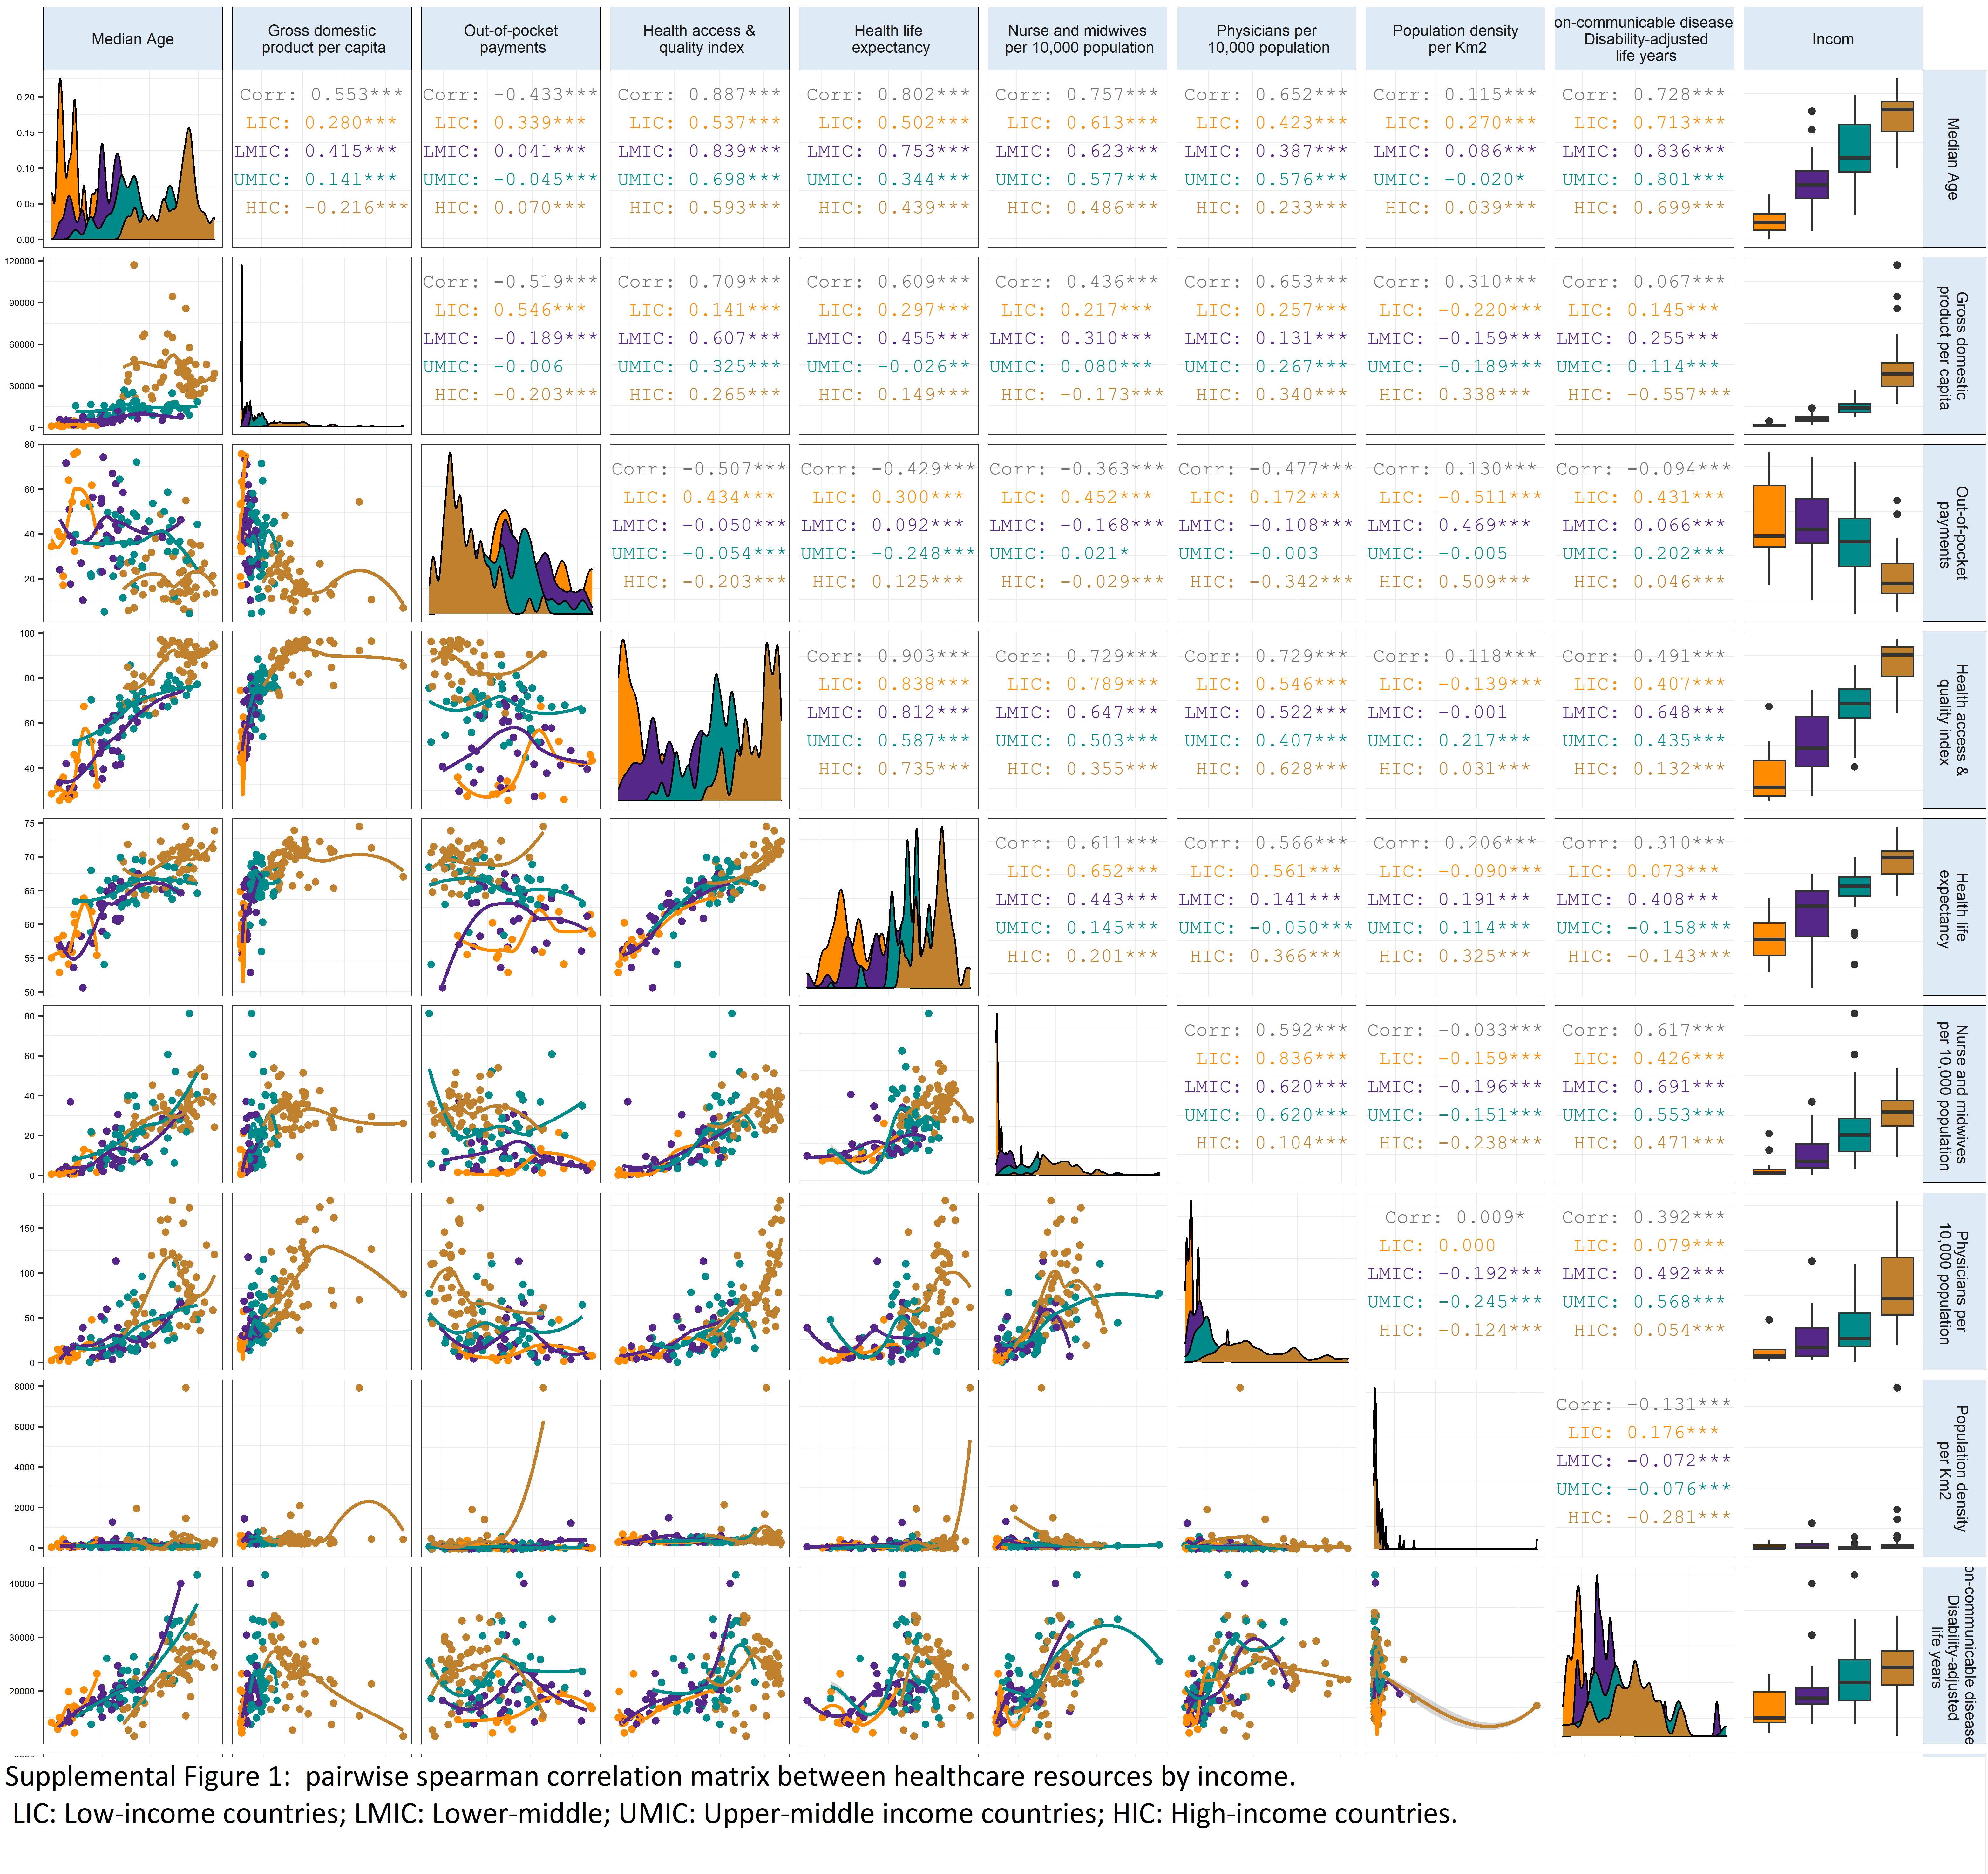
As of March 23, 2021, 35.69 COVID-19 deaths per 100,000 population have been reported globally, including 2.5 (95%CI: 2.5, 2.502) in low-, 11.2 (95%CI: 11.204, 11.205) in lower-Middle-income countries-, 35.46% (95%CI: 35.461, 35.462) in upper-middle-income countries, and 112.47 (95%CI: 112.47, 112.48) in High-income countries. Correlations between variables and possible collinearity are summarized in Supplemental Figure 1.
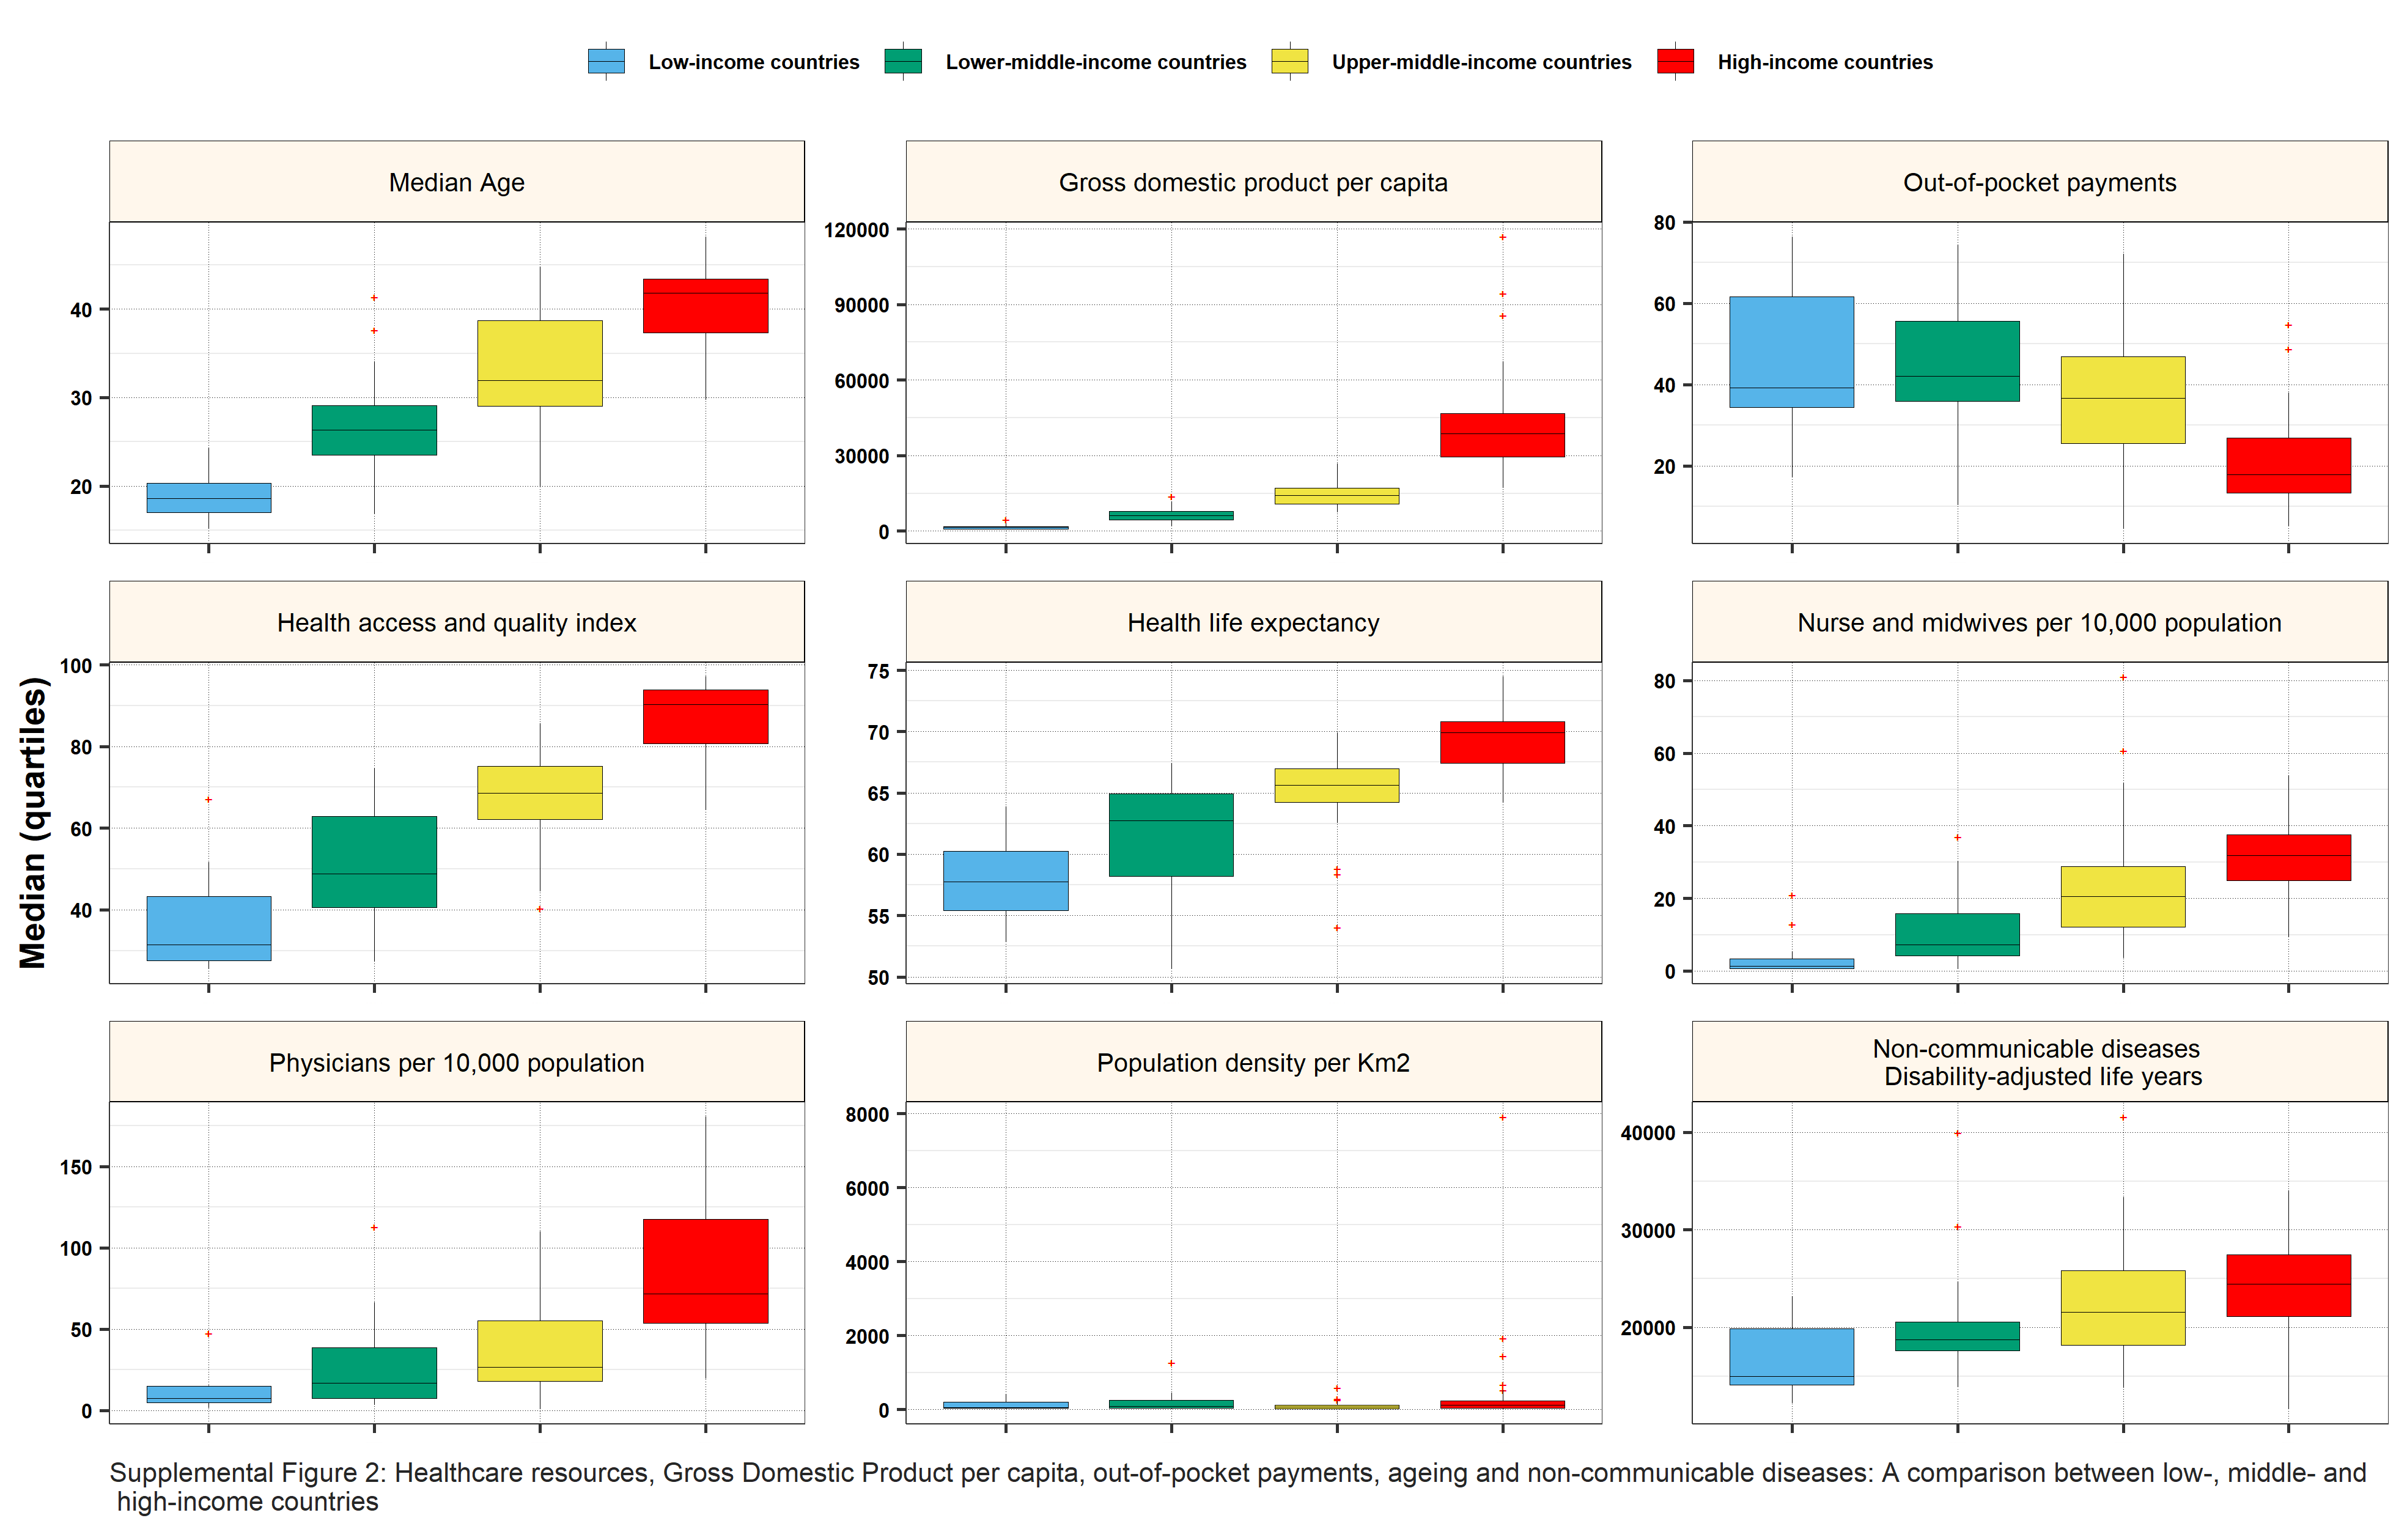
High-income countries had a higher median number of all healthcare resources as compared to lower-middle-income countries (p<0.0001) (Supplemental Figure 2). A positive independent association was observed between COVID-19 mortality rate and median age ratio (MRR=1.077 [1.07, 1.08]).
COVID-19 mortality, pandemic phases, and number of hospital beds
In the multilevel model, lower COVID-19 mortality was associated with higher numbers of hospital beds, with the greatest reduction in COVID-19 deaths seen in the highest percentile of hospital beds (for >Percentile 80th MRR: 0.53 [0.49, 0.56], Table 1).
In a subgroup analysis based on COVID-19 mortality periods, the number of hospital beds per population reduced COVID-19 mortality in both peak and non-peak mortality periods (Figure 1-A). A similar pattern with an inverse association between COVID-19 MRR and the number of hospital beds was observed in both COVID-19 peak and non-peak mortality periods in middle-income countries (Figure 1-B).
In a subgroup analysis, in lower-middle-income countries, we observed a declining trend of COVID-19 mortality with an increasing number of hospital beds during both peak and non-peak mortality periods. In upper-middle-income countries, we found the following declining trend only during non-peak mortality periods (COVID-19 MRR for hospital beds per population <20thpercentile: 0.80 [0.72, 0.87]; 20th-40th percentile: 0.68[0.60, 0.77]; and >60th percentile: 0.56[0.50, 0.63]). However, during peak mortality periods a non-significant increase in COVID-19 mortality was observed in upper-middle-income countries with an increasing number of hospital beds (COVID-19 MRR for hospital beds per population <20th percentile: 0.77 [0.68, 0.86]; 20th to 40th percentile: 1.05[0.91, 1.22]; and >60th percentile: 0.90[ 0.79, 1.02]).
In High-income countries during peak mortality periods, despite a declining trend in COVID-19 mortality rate with an increasing number of hospital beds, the odds of COVID-19 mortality increased even with beds per population above 60th or 80th percentile (COVID-19 MRR for hospital beds per population 20th-40th percentile: 2.19[2.39, 3.74]; >60th: 2.59[1.17, 1.94]; >80th: 2.50 [1.27, 1.68]) ( Figure 1-C).
The association between the number of COVID-19 cases and deaths
During the period of study, 124,535,520 confirmed COVID-19 cases were reported globally. Globally the death-to-case ratio was 2.2%, ranging from 1.85% to 2.56% during non-peak and peak mortality periods, respectively (Table 2). In the Poisson-Tweedie mixed-effects model, we observed a significant interaction effect of “COVID-19 cases × periods” on COVID-19 mortality rate (interaction effect: 3.79 [3.62, 3.97]). Globally, the risk of death-to-case ratio increased significantly by 1.95 times (1.75, 2.18) during peak mortality periods compared to the non-peak periods, with a different pattern in countries depending on income levels (Lower-middle-income countries: 1.3[0.99, 1.71]; upper-middle-income countries: 1.77 [1.43, 2.20]; High-income countries: 2.14[1.79, 2.57]). We were not able to analyze lower-income countries due to missing information.
Death-to-case ratio during non-peak and peak mortality periods: ranking and clustering of 139 countries
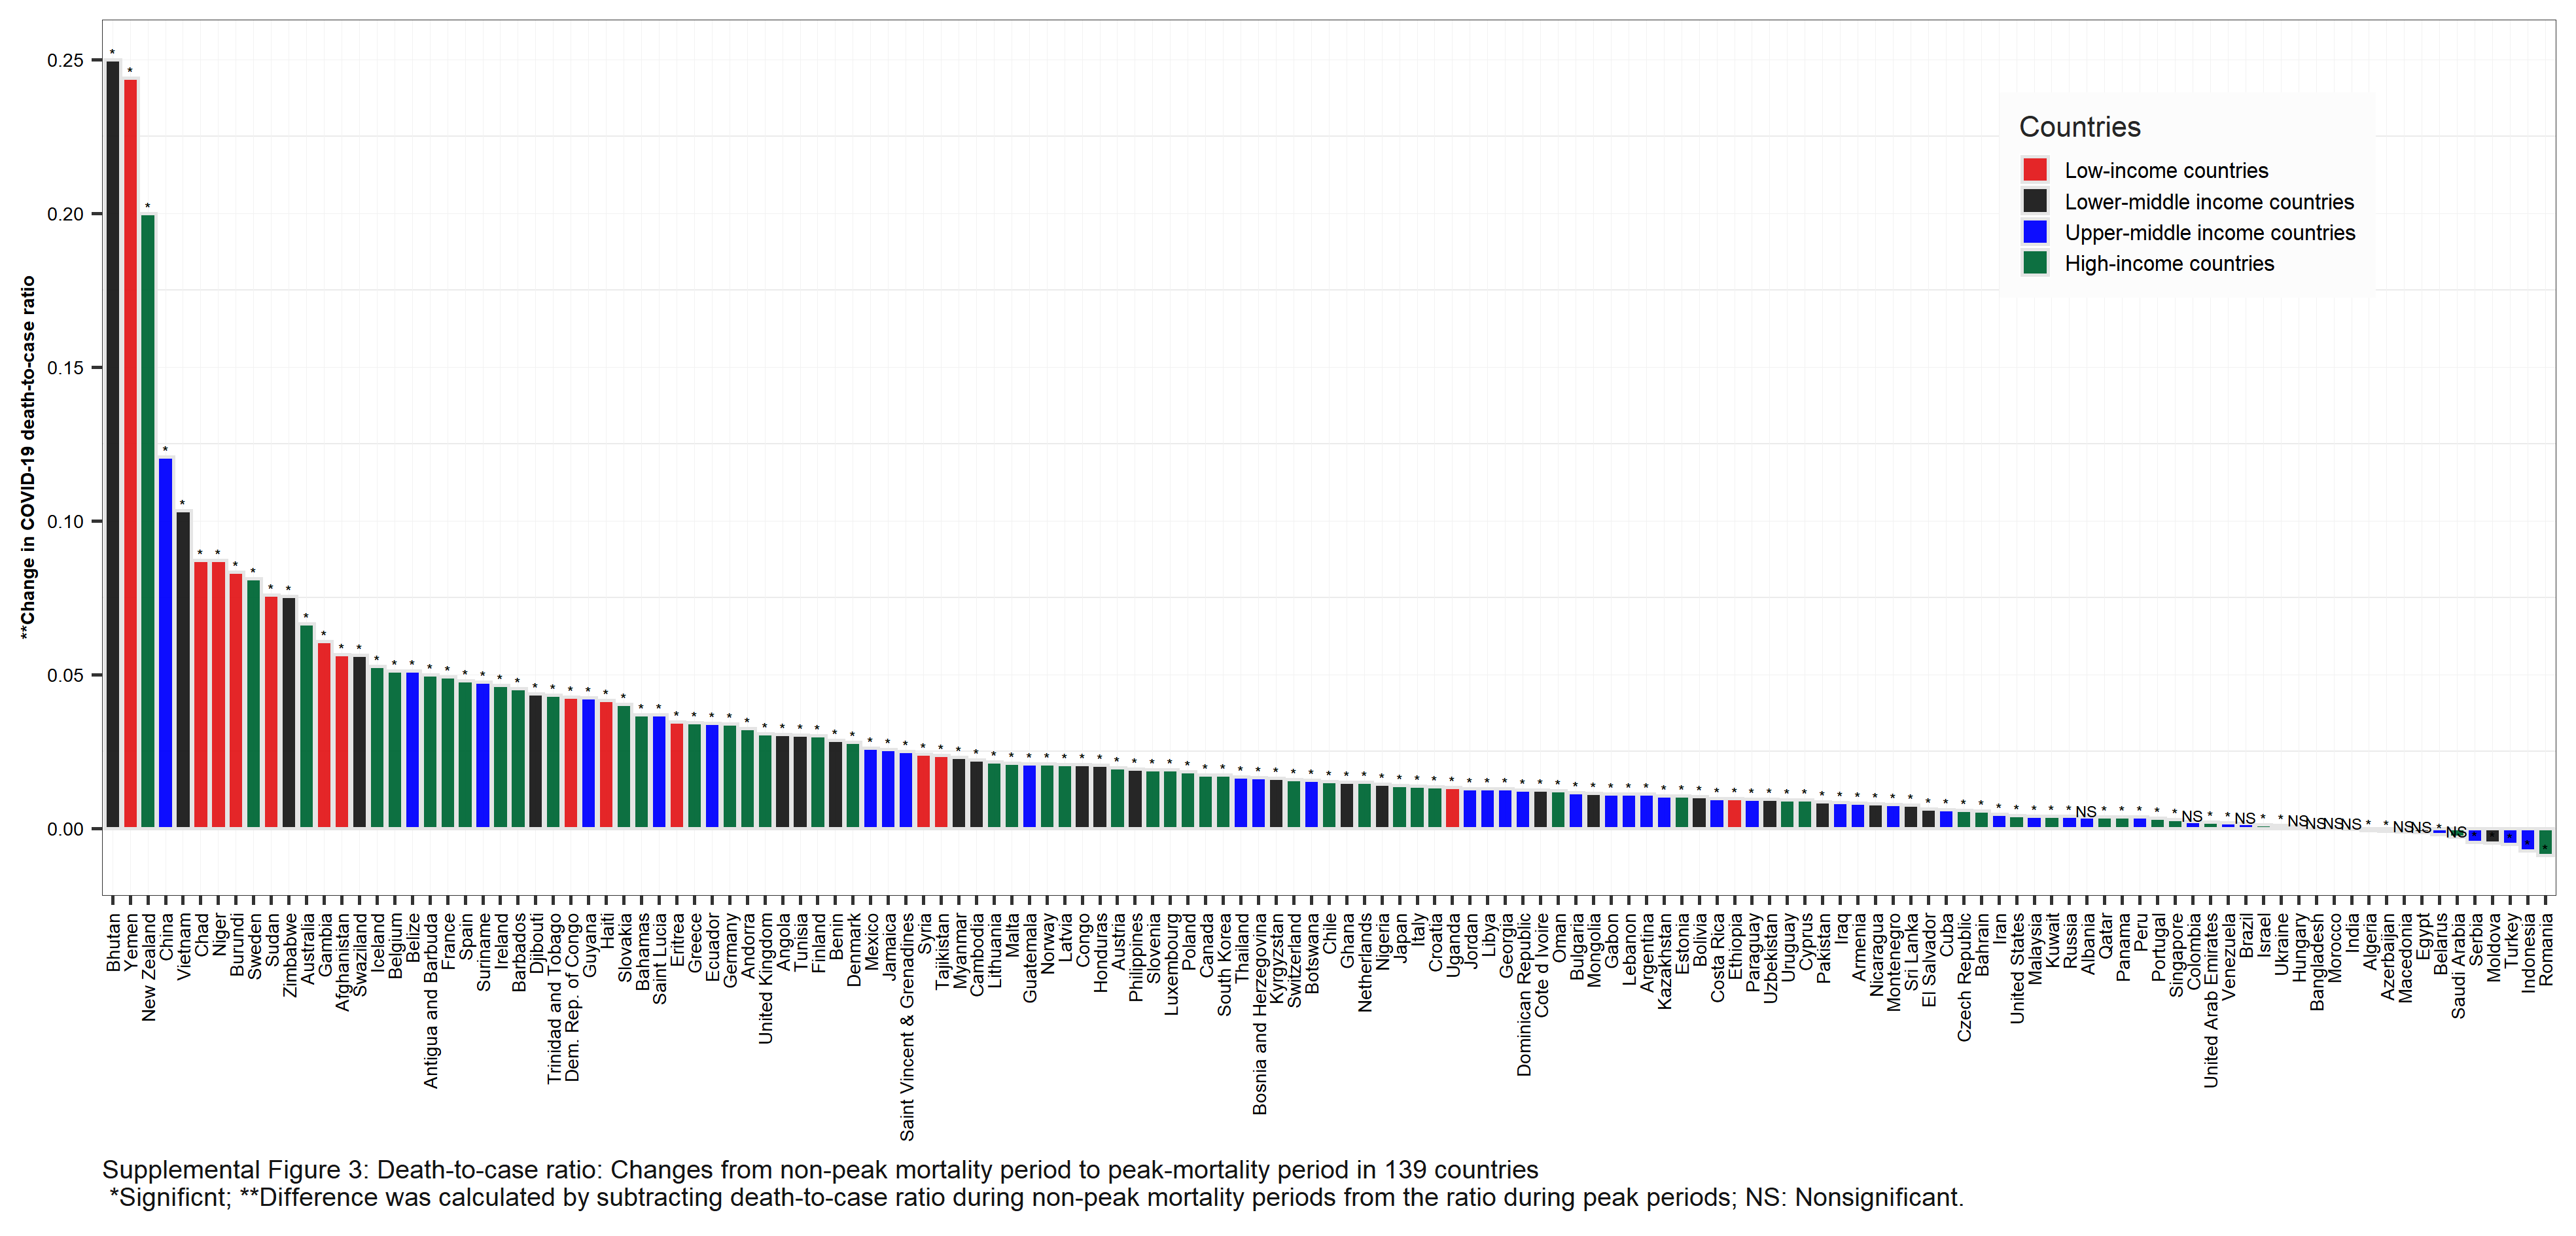
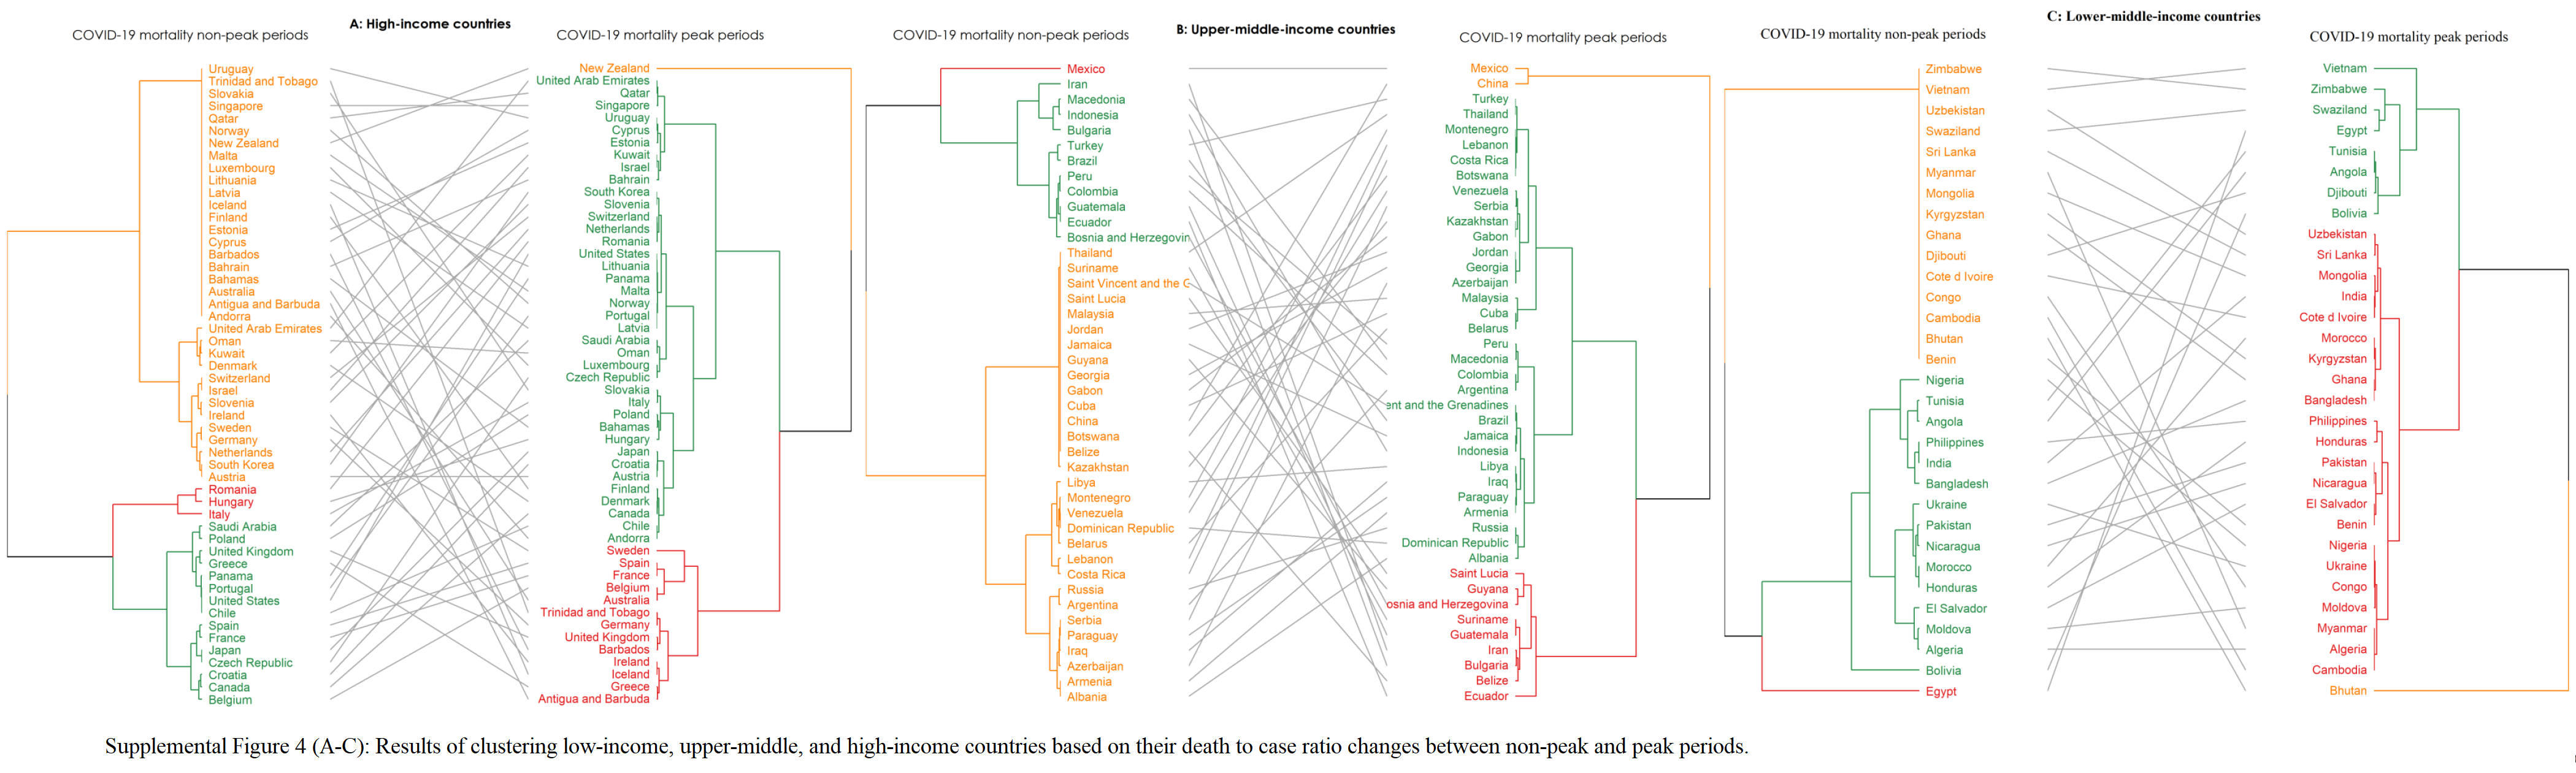
We categorized all countries according to the death-to-case ratio in non-peak and peak mortality periods. Death-to-case ratio during peak mortality periods compared to non-peak mortality periods increased significantly in 121 countries. The greatest changes can be seen in Bhuran and Yemen followed by NewZealand as a High-income country (Supplemental Figure 3). In 10 countries (Albania, Colombia, Brazil, Hungary, Bangladesh, Morocco, India, Macedonia, Egypt, and Saudi Arabia) the increase in death-to-case ratio did not reach significance. The death-to-case ratio decreased during peak mortality periods only in eight countries (Algeria, Azerbaijan, Belarus, Serbia, Moldova, Turkey, Indonesia, and Romania). In the hierarchical clustering analysis of countries, we observed a significant change in the clustering of countries according to their death-to-case ratio during the peak mortality periods compared to non-peak periods (Supplemental Figure 4).
COVID-19 and the burden of non-communicable diseases
The burden of NCDs was associated with increased COVID-19 mortality rate globally in both peak and non-peak mortality periods (Figure 2-A). This association was, in particular, more evident in High-income countries where NCD DALYs increased COVID-19 mortality rate by 1.45 (1.35, 1.56) and 3.24 (3.04, 3.44) during non-peak and peak mortality periods, respectively (Figure 2-C). In upper-middle-income countries, during non-peak and peak mortality periods, NCD DALYs increased COVID-19 mortality by 0.995 (0.94, 1.04), and 1.51 (1.41, 1.61), respectively (Figure 2-B). We could not analyze lower-income countries and lower-middle-income countries during peak and non-peak mortality periods due to missing information.