Description of studies
Detailed steps of literature search and study selection were shown in a flow diagram [54] (Fig. 1). A total of 1153 studies were initially retrieved with search strategies described above. In line with the selection criteria, 762 articles were left after duplicated records removed. After screening the titles and abstracts of identified articles, 555 articles were excluded due to irrelevant topics. The remaining articles were reviewed in full text, 164 articles were excluded, including 64 cell or animal studies, 13 reviews or abstracts, 84 studies without clinicopathological or survival data, and 3 studies based on data from public databases. A total of 43 studies were eventually included in the present meta-analysis. Thirty-one studies including 2205 cases were available for investigating the correlation between CD44s/CD44v6 expression and clinicopathological features of glioma and 15 studies including 794 cases were available for evaluating the impact of CD44s expression on the survival outcomes of glioma patients. 3 studies were included in both qualitative and quantitative synthesis at the same time. The main characteristics of eligible studies in the quantitative and qualitative synthesis were summarized in Table 1 and Table 2, respectively.
Correlation between CD44s expression and overall survival
Fourteen studies [52, 53, 55-66], including 743 patients, reported overall survival (OS) data using univariate analysis (Table 1). With substantial heterogeneity (P<0.0001, I2=72.2%), a pooled analysis in a random-effects model showed increased CD44s expression in glioma patients predicted reduced OS (pooled HR =1.63, 95% CI= [1.16, 2.29], P=0.005) (Fig. 2A). The heterogeneity may be generated from the studies by Pinel B et al [52] and Wei KC et al [53] as CD44s expression was correlated with favorable OS in their studies. When these two studies were omitted, the pooled analysis of the remaining thirteen studies [51] showed no heterogeneity (pooled HR=2.01, 95%CI= [1.66, 2.42], P<0.00001, I2=0%). Moreover, subgroup analysis of OS on the basis of univariate data was conducted and stratified in terms of ethnicity, counting method, cancer type, source of data and NOS score (Table 3). The results revealed that increased CD44s expression was significantly associated with OS in the following subgroups, including European & American, IHC method, mixed gliomas, survival data from Kaplan-Meier curves and NOS score > 7. No significant association was observed in other subgroups.
In addition, a pooled analysis of four studies [52, 60, 61, 64] including 312 patients investigated the correlation between CD44s expression and OS based on multivariate data (Table 1). Without heterogeneity (P=0.903, I2=0%), a fixed-effects model showed the similar result (pooled HR=2.14, 95% CI= [1.21, 3.78], P=0.009) (Fig. 2B).
Correlation between CD44s expression and progression-free survival
A total of 235 patients from four studies [60-62, 67] were included in the univariate analysis of the correlation of CD44s expression with progression-free survival (PFS) (Table 1). The pooled result indicated that high expression of CD44s was associated with poorer PFS (pooled HR=2.09, 95% CI= [1.59, 2.75], P<0.00001, I2=0%) (Fig. 2C). However, according to Iwadate Y et al[61], CD44 is not an independent prognostic factor for PFS of patients with GBM in the multivariate Cox regression analysis (HR=2.481, 95% CI= [0.962, 6.402], P=0.0603).
Correlation between CD44s/CD44v6 expression and clinicopathological parameters
Eleven studies [68-78] and three studies [72, 79, 80] compared the differential expression of CD44s and CD44v6 in glioma tissue samples vs. adjacent non-tumorous brain tissue samples (including normal brain tissue and pan-cancer brain tissue), respectively (Table 2). The pooled analysis showed both CD44s and CD44v6 were predominantly expressed in paired glioma tissues than that in adjacent non-tumorous brain tissues (CD44s, OR=31.31, 95% CI= [15.22, 64.43], P<0.00001, I2=33%; CD44v6, OR=13.18, 95% CI= [5.51, 31.51], P<0.00001, I2=0%) (Fig. 3A, 3B).
According to the WHOClassifications of Tumors of the CNS, gliomas can be classified into four grades (grade I-V) [3]. Twelve studies [59, 63, 70-73, 75, 76, 78, 81-83] with 737 glioma patients and five studies [69, 84-87] with 406 glioma patients investigated the correlation of CD44s-positive expression and CD44s-high expression (in terms of different cut-off values of CD44s expression) with WHO grades of glioma, respectively (Table 2). The pooled results showed CD44s was significantly overexpressed in grade III-IV group when compared with grade I-II group (positive expression, OR=4.67, 95% CI= [3.18, 6.87], P<0.00001, I2=23%; high expression, OR=3.51, 95% CI=[2.12, 5.81], P<0.00001, I2=0%) (Fig. 3C, 3D). Besides, a pooled analysis of five studies [72, 79, 88-90] with 329 glioma patients investigating the association between CD44v6-positive expression and WHO grades of glioma demonstrated that CD44v6 expression was also upregulated in higher tumor grade (grade III-IV vs. grade I-II, OR=1.98, 95% CI= [1.15, 3.40], P=0.01, I2=0%) (Table 2; Fig. 3E).
Frequent recurrence of high-grade gliomas is an inevitable problem in clinical practice despite a combined treatment with surgery, chemo- and radiation therapy [91]. Three studies [58, 59, 76], including 137 primary glioma samples and 66 recurrent glioma samples, investigated the relationship between CD44s expression and recurrence of glioma (Table 2). The pooled result showed there was no significant difference in CD44s expression between recurrent and primary gliomas (OR=1.70, 95% CI= [0.87, 3.33], P=0.12, I2=0%) (Fig. 3F).
Brain metastases (BM) is a major neurological complication of advanced cancer that frequently originate from lung, breast, and skin by means of hematogenous dissemination [92, 93]. Six studies [68, 73, 87, 94-96] with 254 glioma patients and five studies [80, 87, 96-98] including 339 glioma patients investigated the differential expression of CD44s and CD44v6 in brain metastases vs. primary glioma tissues, respectively (Table 2). The pooled analysis revealed that CD44s-positive expression in brain metastases was lower than that in primary gliomas (OR=0.25, 95% CI= [0.10, 0.60], P=0.002, I2=13%) (Fig. 3G). However, with substantial heterogeneity (P=0.03, I2=62%), a random-effects model showed that a remarkably increased expression level of CD44v6 was noted in brain metastases when compared with primary gliomas (pooled OR=49.92, 95% CI= [8.93, 279.06], P<0.00001) (Fig. 3H).
Sensitivity analysis and publication bias.
A sensitivity analysis was performed to verify the stability of each pooled study (Fig. 4). As shown in Table 4, no individual study could statistically significantly alter the combined results of survival outcomes and clinicopathological parameters, except the study by Hou CX et al[60] which can affect the pooled HR of CD44s expression on OS in multivariate analysis (Fig. 4B), the study by Du Q et al [79] included in the pooled analysis of the correlation between CD44v6 expression and WHO grades of glioma (Fig. 4H), and the study by Wei HQ et al [87] which can affect the pooled OR of CD44s expression between brain metastases and primary gliomas (Fig. 4J).
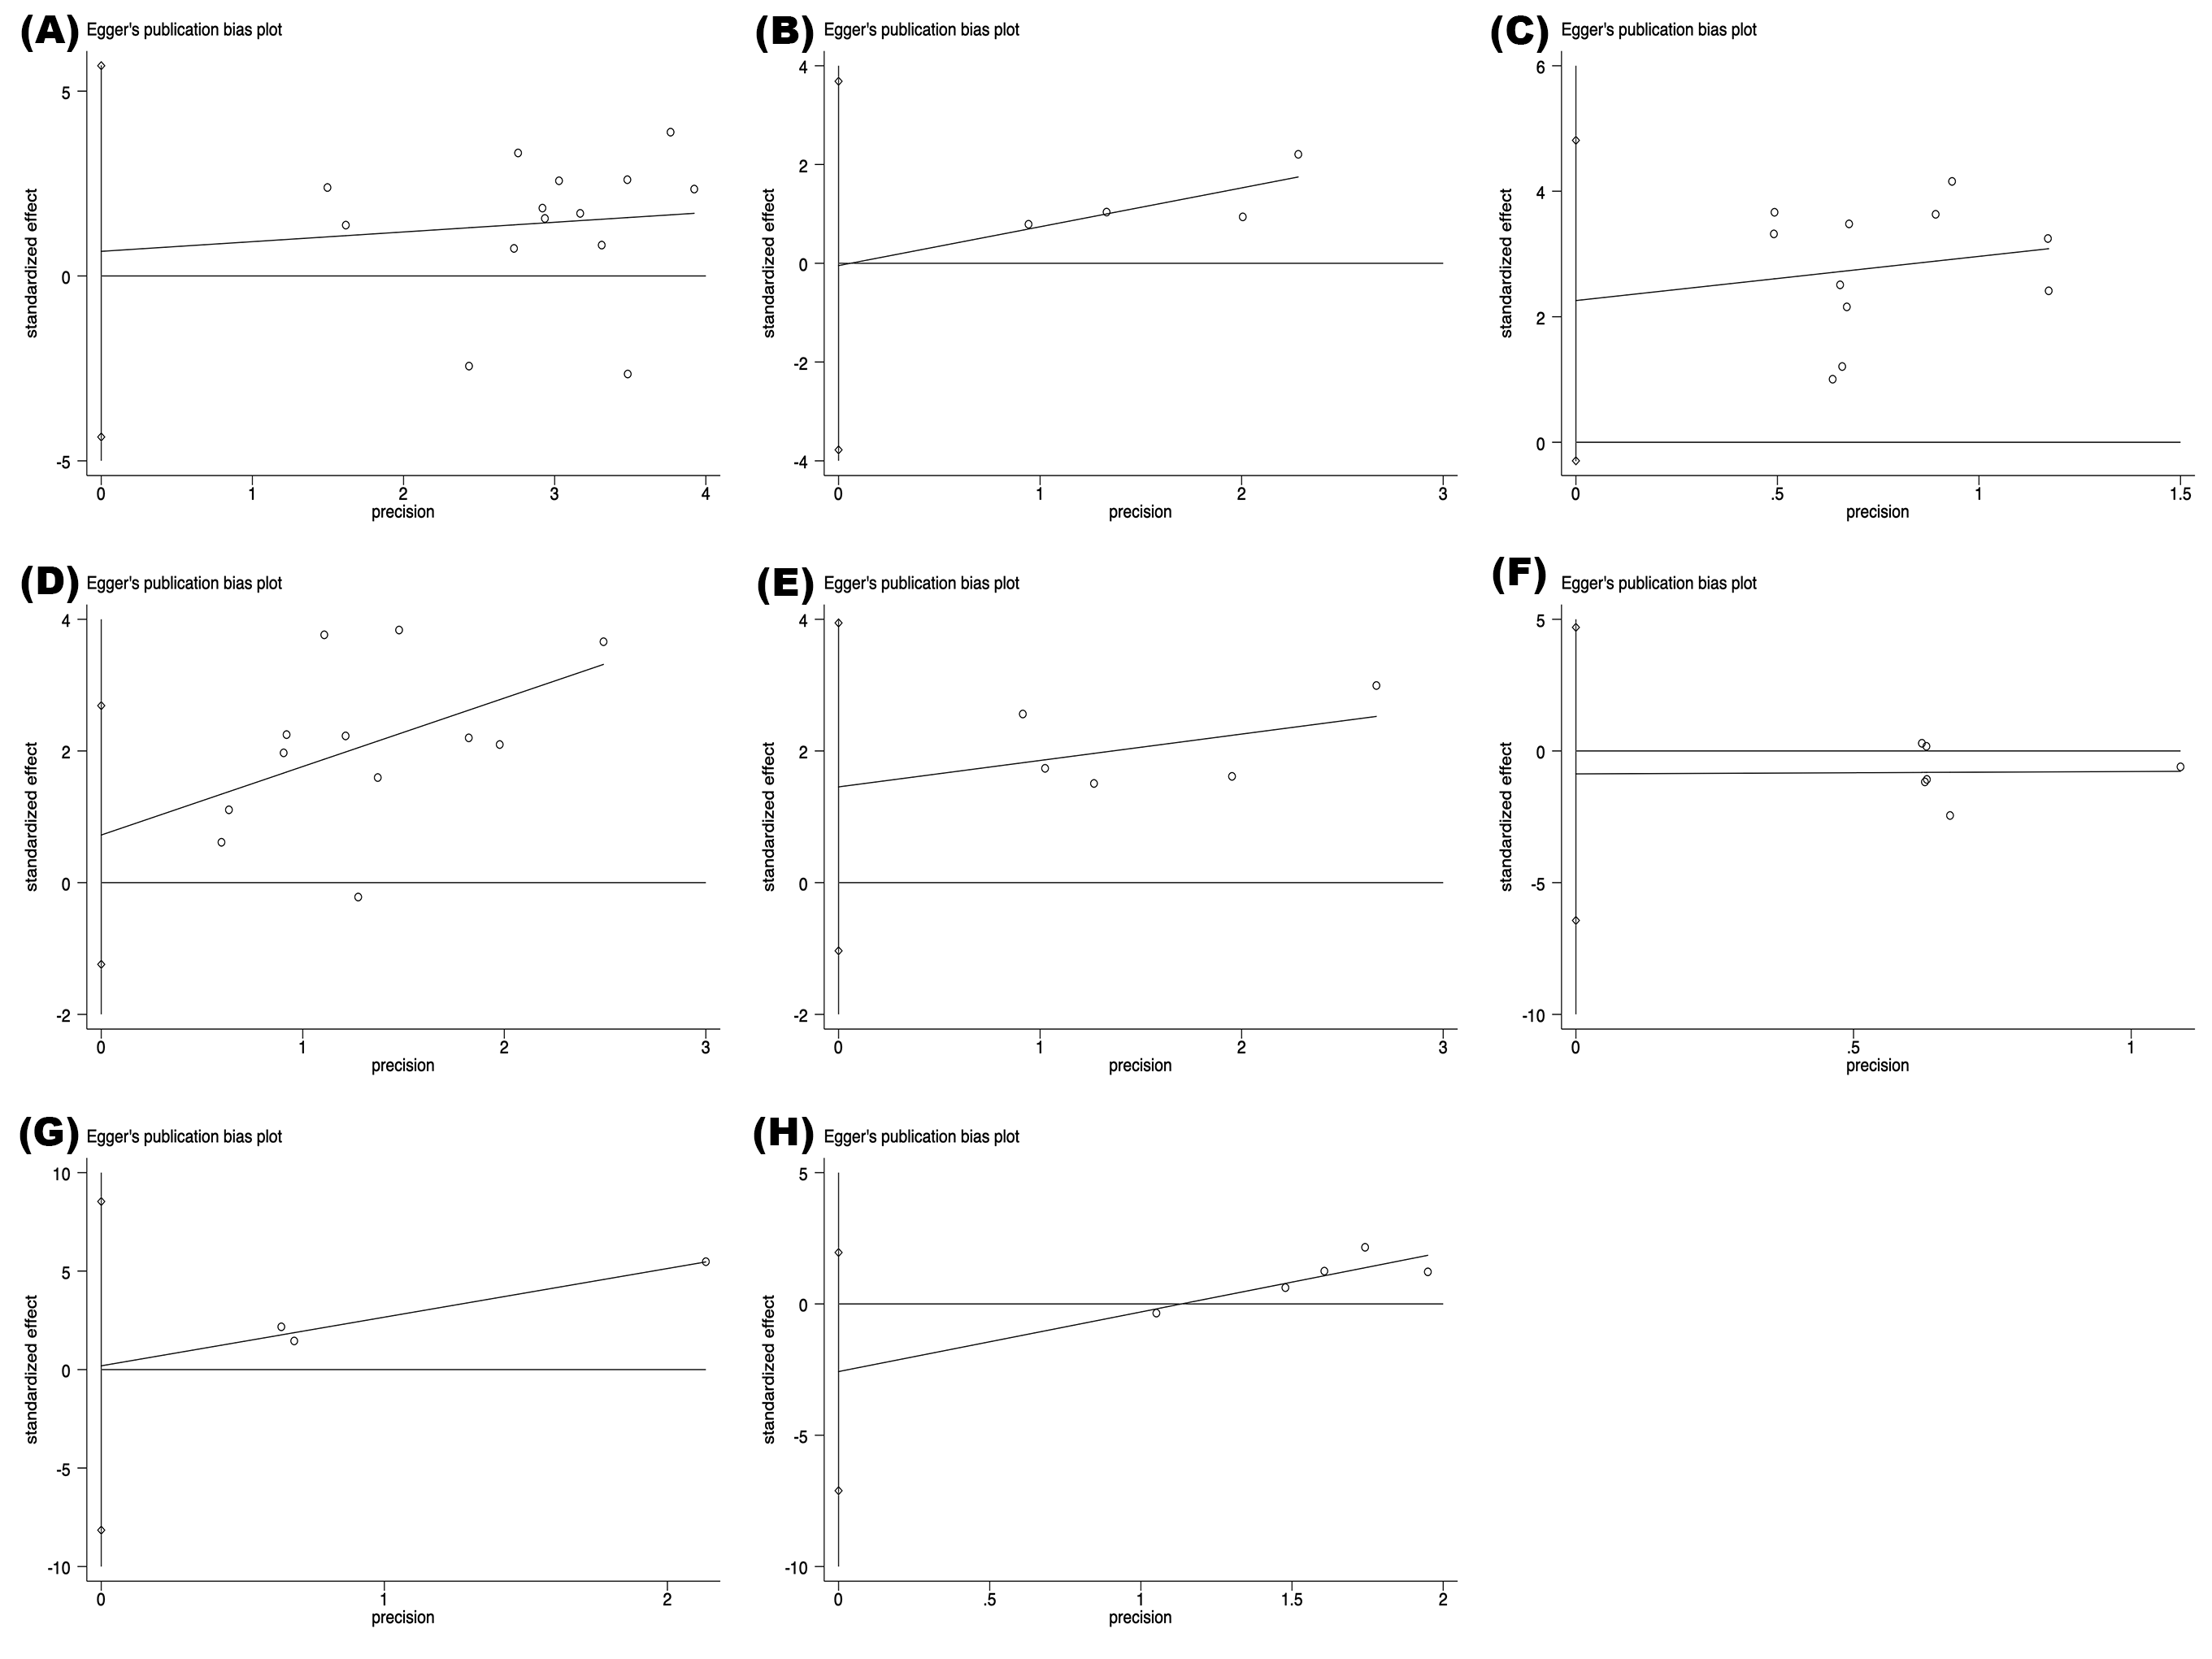
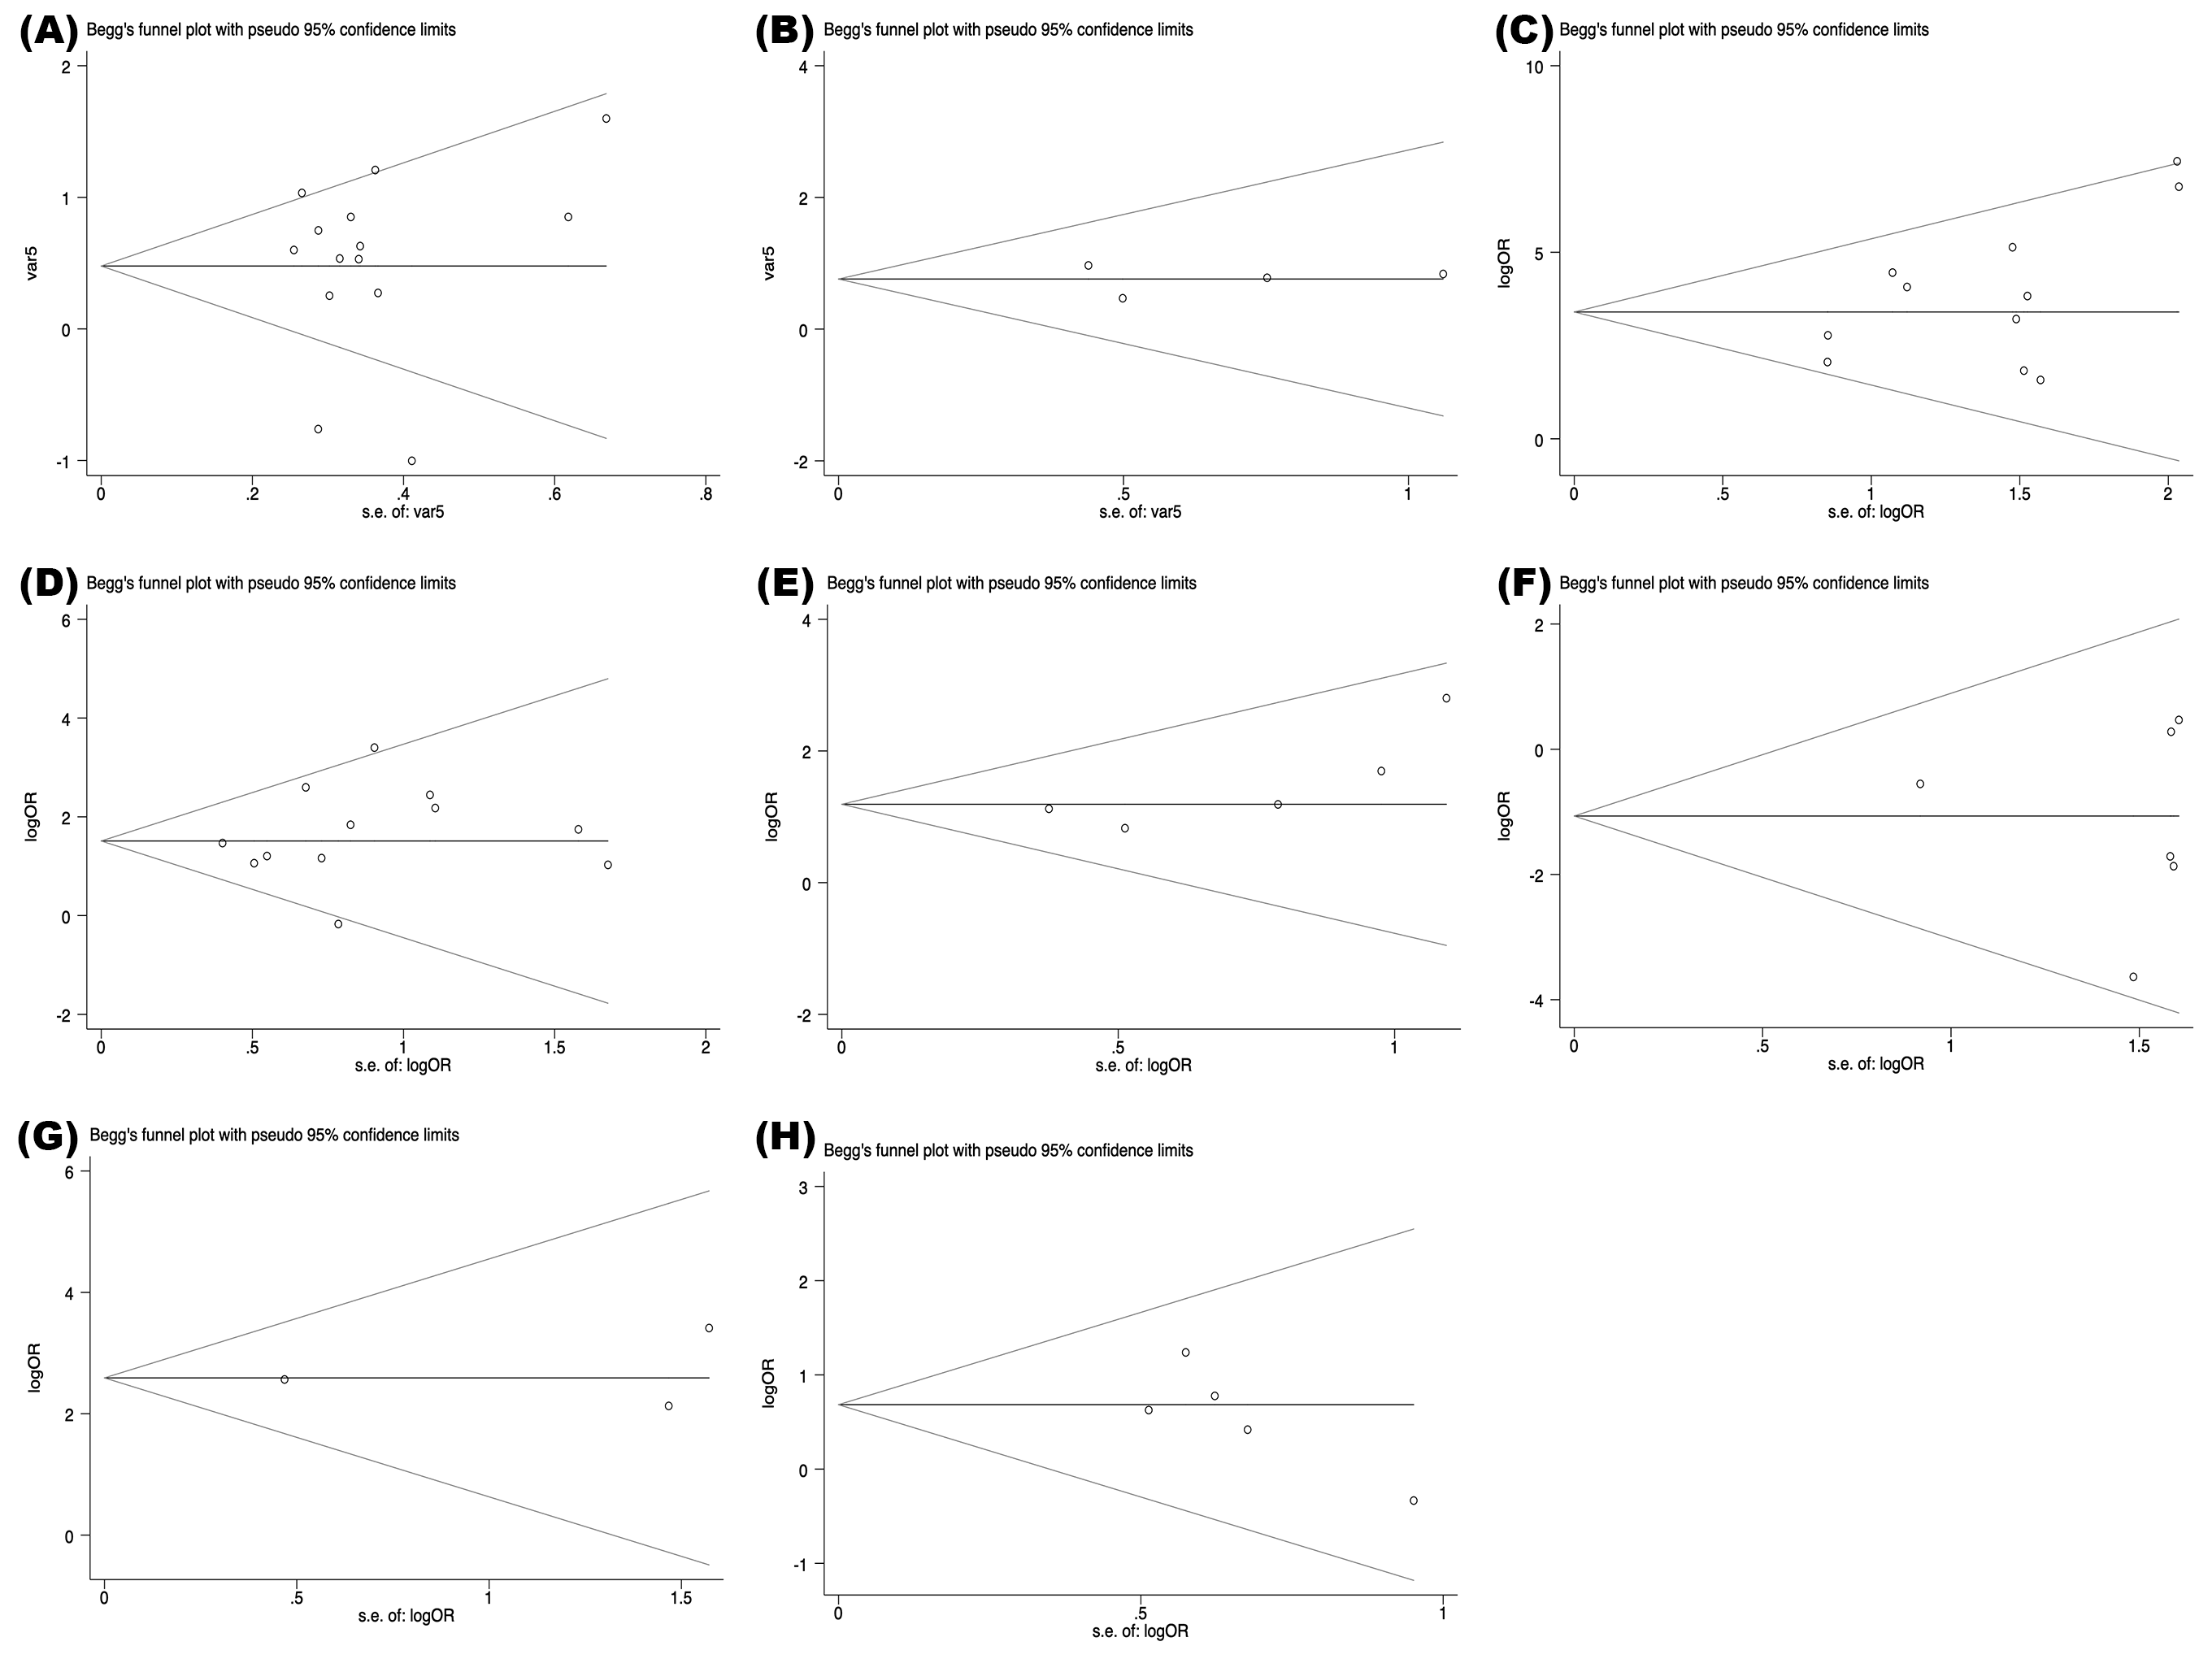
Begg’s test (Fig 5A-5C, S1) and Egger’s test (Fig 5D-5F, S2) were conducted to evaluate the potential publication bias of survival outcomes and clinicopathological parameters. As shown in Table 4, p values assessed by Begg’s test and Egger’s test were all greater than 0.05 except the evidence of significant publication bias (P<0.05) in three pooled studies (Fig 5). Therefore, the trim and fill method was utilized to evaluate the potential impacts of publication bias. For the pooled analysis of the association of CD44s expression with PFS of gliomas in the univariate analysis (Begg’s test, P=0.089; Egger’s test, P=0.011), a filled funnel plot was generated by trim and fill analysis including two imputed studies, and the meta-analysis incorporating these two imputed studies demonstrated the similar result (adjusted HR=1.956, 95% CI= [1.518–2.521]; P<0.001) (Fig. 6A). Similarly, trim and fill analysis including two imputed studies generated a symmetrical funnel plot for the pooled analysis of CD44v6 expression between brain metastases and primary gliomas, and the meta-analysis incorporating these two imputed studies demonstrated the semblable result (adjusted HR=23.222, 95% CI= [5.415–99.595]; P<0.001) (Fig. 6B). Intriguingly, despite a significant publication bias in the analysis of the association between CD44s expression and tumor recurrence (Begg’s test, P=1.000; Egger’s test, P=0.017), the trim and fill analysis revealed that no trimming was performed and thus pooled data remained unchanged. In conclusion, the results of the three pooled studies were robust in spite of significant publication bias.