Epidemiology of Wheezing Episodes
In total, 509 prescriptions of salbutamol have been recorded for 479 children over the 3 study periods. Fourteen children did not meet the inclusion criteria and were excluded. Among the 495 childhood wheezing episodes (observed in 465 children) 86 occurred in 2019, 111 in 2020 and 298 in 2021. The number of wheezing episodes in 2021 was significantly higher than in 2019 (p<0.001) (figure 1).
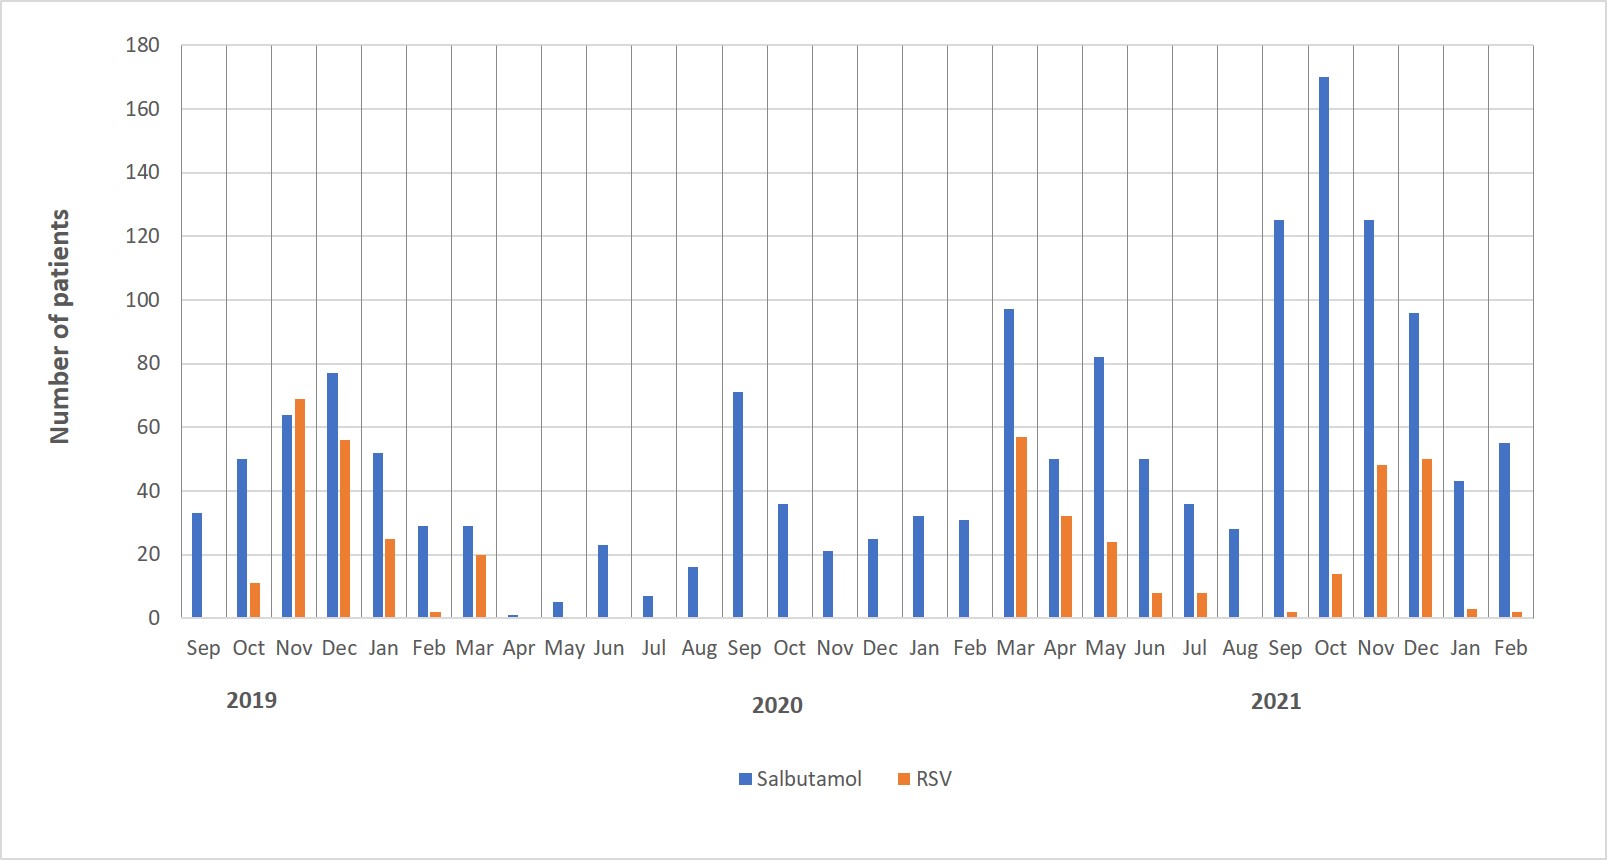
Our longitudinal data confirmed a peak in salbutamol prescriptions in September and October 2019, 2020 and 2021 during a period of low RSV hospitalizations (supplemental figure 1).
The total number of visits to our pediatric emergency and outpatient department during the study period was 10 263 in 2019, 6989 in 2020 and 10 296 in 2021. The attendance rate of 2020 was lower than in 2019 (IRR 0.68 (95%CI: 0.66-0.70, p<0.0001)), while in 2021, the attendance rate was similar to 2019 (IRR =1.00 (95%CI: 0.98-1.03)).
Study Population
Demographic, clinical and treatment characteristics of the study population are presented in table 1.
Table 1 - Demographic, clinical and treatment characteristics of the study population
|
|
2019
n=86
|
2020
n=111
|
2021
n=298
|
P value 2020 vs 2019
|
P value 2021 vs 2019
|
|
Age (years) (mean ± SD)
|
3.62 ± 2.78
|
4.13 ± 2.80
|
4.55 ± 2.98
|
0.207
|
0.011
|
|
Gender: Male (n (%))
|
54 (63)
|
75 (68)
|
167 (56)
|
0.484
|
0.265
|
|
Hospitalization (n (%))
|
28 (33)
|
28 (25)
|
64 (22)
|
0.258
|
0.034
|
|
Origin (n (%))
|
|
|
|
0.009
|
0.388
|
|
Caucasian
|
14 (16)
|
15 (14)
|
34 (11)
|
|
Nord Africa
|
27 (31)
|
35 (32)
|
100 (34)
|
|
Sub-Saharan Africa
|
9 (11)
|
30 (27)
|
38 (13)
|
|
Other
|
14 (16)
|
7 (6)
|
29 (10)
|
|
Unknown
|
22 (26)
|
24 (22)
|
97 (33)
|
|
Known asthma (n (%))
|
23 (27)
|
27 (24)
|
59 (20)
|
0.699
|
0.166
|
|
Recurrent wheezing (n (%))
|
55 (64)
|
69 (62)
|
128 (43)
|
0.780
|
<0.001
|
|
Mean duration of symptoms before presentation (days) (mean ± SD)
|
2.60 ± 2.90
|
2.18 ± 2.82
|
2.86 ± 4.71
|
0.315
|
0.642
|
|
Diagnoses (n (%))
|
|
|
|
|
|
|
Asthma
|
15 (17)
|
29 (26)
|
87 (29)
|
0.336
|
0.070
|
|
Bronchiolitis
|
16 (19)
|
20 (18)
|
39 (13)
|
|
Viral induced wheezing
|
55 (64)
|
62 (56)
|
172 (58)
|
|
Treatment
|
|
|
|
|
|
|
Salbutamol dose a
|
0.43
|
0.46
|
0.42
|
0.560
|
0.325
|
|
Methylprednisolone (n (%))
|
20 (23)
|
27 (24)
|
56 (19)
|
0.861
|
0.360
|
|
Ipratropium (n (%))
|
3 (4)
|
2 (2)
|
2 (1)
|
0.455
|
0.042
|
|
Magnesium sulphate (n (%))
|
0
|
0
|
3 (1)
|
/
|
0.350
|
|
Oxygen therapy (n (%))
|
23 (27)
|
21 (19)
|
52 (18)
|
0.191
|
0.055
|
|
a) Salbutamol dose is expressed in number of puffs per kilo over the 1st hour
SD: standard deviation
|
Children attending the clinic with wheezing were significantly older in 2021 compared to 2019 (p=0.011) whilst no difference was noted between 2019 and 2020 (p=0.207).
Overall, the most common diagnosis was viral induced wheezing, followed by asthma and bronchiolitis. Children with known asthma represented about 20-25% of the population in all three study periods. However, in 2021, the number of patients without antecedent of wheezing was significantly higher (p<0.001). Due to inclusion criteria, all children received salbutamol therapy with a mean of 0.4 puff per kilogram (corresponding to 4 puffs per 10 kilograms) over the first hour. Around 25% of children were treated with a systemic corticosteroid while ipratropium and magnesium sulfate were seldomly used. There were no significant changes in treatment practices over the three study years.
The proportion of children with wheezing who were hospitalized was lower in 2021 than in 2019 (21% versus 32%, p=0.034). Characteristics of hospitalized children were presented in table 2.
Table 2 - Characteristics of hospitalized patients
|
|
2019
|
2020
|
2021
|
P value 2020 vs 2019
|
P value 2021 vs 2019
|
|
|
n = 28
|
n = 28
|
n = 64
|
0.258
|
0.034
|
|
Duration of hospitalization (days) (mean ± SD)
|
4.86 ± 4.40
|
3.26 ± 1.10
|
3.77 ± 1.55
|
0.073
|
0.089
|
|
Transfer to ICU (n (%))
|
0
|
1 (3)
|
4 (6)
|
|
|
|
Respiratory support (n (%))
|
21 (75)
|
21 (72)
|
51 (80)
|
0.191
|
0.055
|
|
Low flow oxygen
|
13 (62)
|
14 (67)
|
41 (80)
|
|
|
|
High flow oxygen
|
7 (33)
|
5 (24)
|
9 (18)
|
|
CPAP
|
1 (5)
|
2 (10)
|
1 (2)
|
|
SD: standard deviation, ICU: intensive care unit, CPAP: continuous positive airway pressure
|
Infection Data
Not all children benefited from viral testing. In 2019, 25 out of 86 children (29%) were tested. In 2020, 42 out of 111 children (38%) were tested for SARS-CoV-2 and 11 (10%) for other viruses and in 2021, 77 out of 298 children (26%) benefited from SARS-CoV-2 PCR tests and 40 (13%) were tested for other viruses. The details of viral testing are depicted in table 3.
Table 3 – Viral testing (number of positive results/total tested)
|
|
2019
|
2020
|
2021
|
|
Respiratory syncytial virus
|
4/25
|
0/11
|
5/40
|
|
Influenza
|
0/25
|
0/11
|
0/40
|
|
Parainfluenza
|
5/25
|
0/11
|
3/40
|
|
Metapneumovirus
|
0/25
|
0/11
|
1/40
|
|
Adenovirus
|
1/25
|
0/11
|
0/40
|
|
SARS CoV-2
|
/
|
0/42
|
4/77
|
|
Rhinovirus
|
3/25
|
3/11
|
3/40
|
|
Other
|
0/25
|
2/11
|
1/40
|
Data on viral epidemiology from the surveillance network are presented in figures 2 and 3.
September and October 2020 were characterized by the absence of RSV and parainfluenza but ongoing circulation of adenovirus (number of infections comparable to 2019 (p= 0.291)). In 2021 there were fewer RSV (p<0.001) but more adenovirus infections (p<0.001) than in 2019 whilst the number of parainfluenza infections did not differ between the two years (p= 0.344). The number of SARS-Co-V-2 infections was 3 to 9 times higher in 2021 than in 2020, depending on the week of the year (p<0.001). Mycoplasma Pneumoniae infections were less frequent in 2020 (p=0.003) and 2021 (p=0.005) than in 2019.
The number of viral cultures in our hospital was 271 in 2019, 131 in 2020 and 133 in 2021 with a proportion of positive cultures for rhinovirus of 14%, 11% and 9% respectively (p= 0.338).
Air Pollution
There were five monitoring stations within a 5 km radius of the hospital and in total, 392 of 465 children (82%) lived in a municipality located within this area.
In September and October 2020, the concentration of NO2 was significantly lower (p<0.001) and the concentration of O3 and PM2.5 were higher than in 2019 (p<0.001). In 2021, the concentration of NO2 remained lower than pre-COVID levels (p=0.001) but all other pollutants continued to rise significantly (p<0.001) moving further away from the WHO AQG level (table 4).
Table 4 - Averages of pollutant concentrations in the months September-October over the three study years compared to the WHO AQG level
|
|
2019
|
2020
|
2021
|
WHO AQG level
|
P value 2020 vs 2019
|
P value 2021 vs 2020
|
P value 2021 vs 2019
|
|
NO2 (µg/m3)
|
26.3 ± 11.8
|
25.8 ± 15.7
|
25.6 ± 12.8
|
10
|
<0.001
|
0.427
|
0.001
|
|
O3 (µg/m3)
|
36.0 ± 17.5
|
39.6 ± 20.9
|
42.1 ± 22.8
|
60
|
<0.001
|
<0.001
|
<0.001
|
|
PM10 (µg/m3)
|
12.8 ± 6.10
|
14.4 ± 10.5
|
15.6 ± 8.46
|
15
|
0.972
|
<0.001
|
<0.001
|
|
PM2.5 (µg/m3)
|
6.40 ± 3.93
|
7.93 ± 6.62
|
10.0 ± 6.71
|
5
|
<0.001
|
<0.001
|
<0.001
|
|
Values are mean ± SD: standard deviation
NO2: nitrogen dioxide, O3: ozone, PM10: particulate matter 10 microns, PM2.5: particulate matter 2.5 microns, WHO AQG: World Health Organization Air Quality Guidelines
|
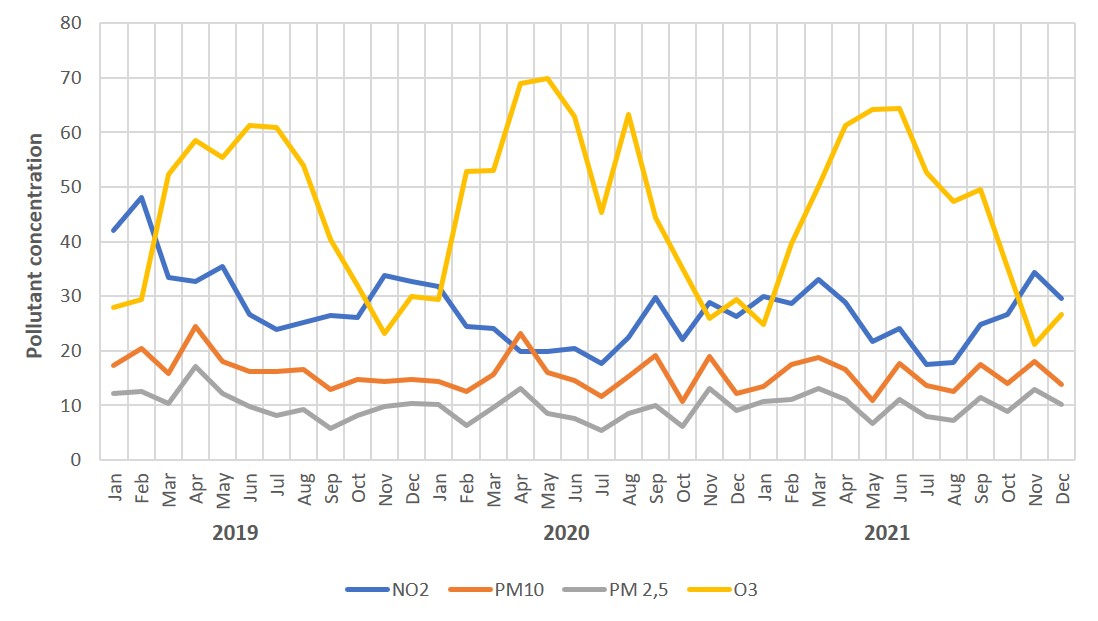
The monthly mean concentration of air pollutants throughout the three study years are depicted in supplemental figure 2.
Only O3 showed a clear seasonality with a peak in spring-summer (April-July). From 2019 to 2021, the year-round concentration in NO2 decreased significantly (p=0.038) whilst no change was notable for PM10, PM2.5 and O3 (supplemental table 1).
Aeroallergens
Compared to 2019, the daily concentrations of Alternaria and Cladosporium spores were higher in 2020 (IRR 1.08 (p<0.0001) and IRR 1.07 (p<0.0001) respectively) and lower in 2021 (IRR 0.66 (p<0.0001) and IRR 0.84 (p<0.0001) respectively). For the Basidiospora, the daily concentration was lower in both 2020 (IRR 0.84 (p<0.0001)) and in 2021 (IRR 0.52 (p<0.0001)) compared to 2019 (figure 4).
