Identification of THCA subtypes based on immune gene sets
The 502 tumour samples of THCA were divided into k subtypes (k = 2-9) using the R package ConsensusClusterPlus. Consensus distributions for each k were displayed, which dissect the optimal k value at which the sample distribution was stable (Figure 1A). Based on the consensus score of the CDF curve, the optimal cluster number was determined as k = 2, and the relative changes in the area under the CDF curve were evaluated. These were finally divided into two distinct and nonoverlapping subtypes, i.e., cluster 1 and cluster 2. The consensus matrix heat map of these two clusters was shown in Figure 1B. A principal component analysis (PCA) plot (Figure 1C) and a two dimensional t-SNE analysis (Figure 1D) further verified the LUAD cohort and the reliability of the consensus clusters.
Association among subtypes, clinical parameters and ferroptosis signature genes
To explore the association among subtypes, clinical parameters and ferroptosis signature genes, we analysed gene cluster, tumour stage, survival status, pathologic stage, pharmaceutical, radiation, race, gender, age, and ferroptosis signature genes in the TCGA cohort. The relationship among subtypes, clinical parameters and ferroptosis signature genes is derived by thermography (Figure 2). On the left side of the heatmap, genes that were positively associated with ferroptosis were coded red (such as Csf2, Hsbp1, Pebp1, Nfs1, Hmgcr, Sqle, Mt1g, and Pgd), whereas blue colour was used to indicate genes that are negatively associated with ferroptosis (incl. Tp53, Keap1, Rpl8, Nox1, Fth1, Hmox1, Acsl4, Sat1, Gpx4, Ptgs2, Gls2, Fancd2, Alox5, Slc1a5 and Dpp4). Gene cluster differed significantly between the two subtypes. In particular, the proportion of cluster 2 was significantly higher than cluster 1 in ferroptosis signature genes that are positively associated, yet the expression of these genes generally appeared higher in cluster 2, such as Acsf2, Mt1g, Gclc and Aifm2. Moreover, cluster 1 had remarkably larger proportion of genes that are negatively associated with ferroptosis, for instance, Tp53, Dpp4, Slc1a5, Alox5 and Ptgs2.
In terms of the spread magnitude to nearby lymph nodes (stage_N), N1 was largely relevant to cluster 1, while N0 and NX were more present in cluster 2. The metastasis to distant sites (stage_M) showed an increased proportion of MX in cluster 2, while the extent of the tumour (stage_T) distributed across both cluster 1 and 2, with latter exhibited higher proportion of T2 (Figure 2). There were more pathological stage III and IV cases associated with cluster 1, whereas cluster 2 subtype showed more genes associated with stage II, which represents non-invasive tumour with no spread to lymph nodes and no metastasis.
Somatic mutation landscape of the two subtypes were identified by GSEA
We continued to explore the differences between the two subtypes using the maftools package to explore the mutation profile and drawing the waterfall map of them (Figure 3). It was found that the somatic mutation types of the two subtypes were missense mutations. The top 2 somatic mutation genes of subtype cluster 1 were Braf (88%) and Tnn (7%) (Figure 3A), with the other 47 genes with low mutation frequency less than 5%. Cluster 2 showed somatic mutations of Nras, Hras and Tg with more than 10% of mutation frequency (Figure 3B). This indicates biological differences between the two subtypes.
Gene set enrichment analysis
GSEA and GSVA were used to analyse the enriched pathways in each cluster to investigate the molecular differences in the phenotypes of these two subtypes. GSEA analysis suggested that subtype cluster 1 was mainly involved in bacterial invasion of epithelial cells, cell adhesion molecules, completion and coaggregation cascades and intestinal immune network for IgA production (Figure 4A). In subtype cluster 2 phenylalanine, tyrosine and tryptophan biosynthesis, thyroid hormone synthesis, tyrosine metabolism, ubiquinone and other terpenoid−quinone biosynthesis were enriched (Figure 4B). GSVA was used to further explore the differences in participating KEGG pathways between the two subtypes, and the results were shown in Figure 4C (adjust P-value<0.05; see Supplementary Table S1 for more details). In addition, there were more immune response relevant pathways present in cluster 1 than cluster 2, such as antigen processing and presentation (P-value=1.27E-22), natural killer cell mediated cytotoxicity (P-value=1.36E-37), Fc gamma R-mediated phagocytosis (P-value=1.12E-23), cytokine-cytokine receptor interaction (P-value=7.18E-45), and toll-like receptor signalling pathway (P-value=1.17E-24). Cluster 2 was enriched with more metabolism pathways, for instance, metabolisms of glycine, serine and threonine (P-value=1.04E-30), porphyrin and chlorophyll (P-value=2.93E-33), and fatty acid (P-value=4.05E-41).
Immune characteristics of the two subtypes
The difference between two immune subtypes might be formed because of the complexity of the TME. To explore the biological behaviours between the two clusters, we performed ssGSEA algorithm to analyse the proportion of 28 kinds of immune cells in immune infiltration microenvironment in THCA. The results showed that the degree of immune infiltration in cluster 1 was largely higher than in cluster 2, suggested by the greater activation of immune response relevant cells, among which activated B cells, CD8 and CD4 T cells appeared to be the top three cell types (Figure 5A). Spearman correlation analysis was used to calculate the correlation between ferroptosis gene expression and the proportion of immune infiltrating cells (Figure 5B). This showed positive correlation of Alox5, Fancd2, Dpp4, Hmox1, Ptgs2, Slc1a5, Sat1 and Acsl4 with most cell types with relatively high magnitudes. In contrast, the negative correlation of these cells with ferroptosis was indicated by the relative low expression of Acsf2, Pebp1, Nfs1, Hsbp1, Hmgcr, Acsl3 and Gss. The difference of immune cell contents between the two subtypes were compared (Figure 5C and Supplementary Table S2). Notably, cluster1 was remarkably enriched (P-value<0.0001) with nearly all innate immune cell types, except eosinophil and monocyte, compared to cluster 2.
Identification of DEGs distinct phenotypes derived from gene co-expression network
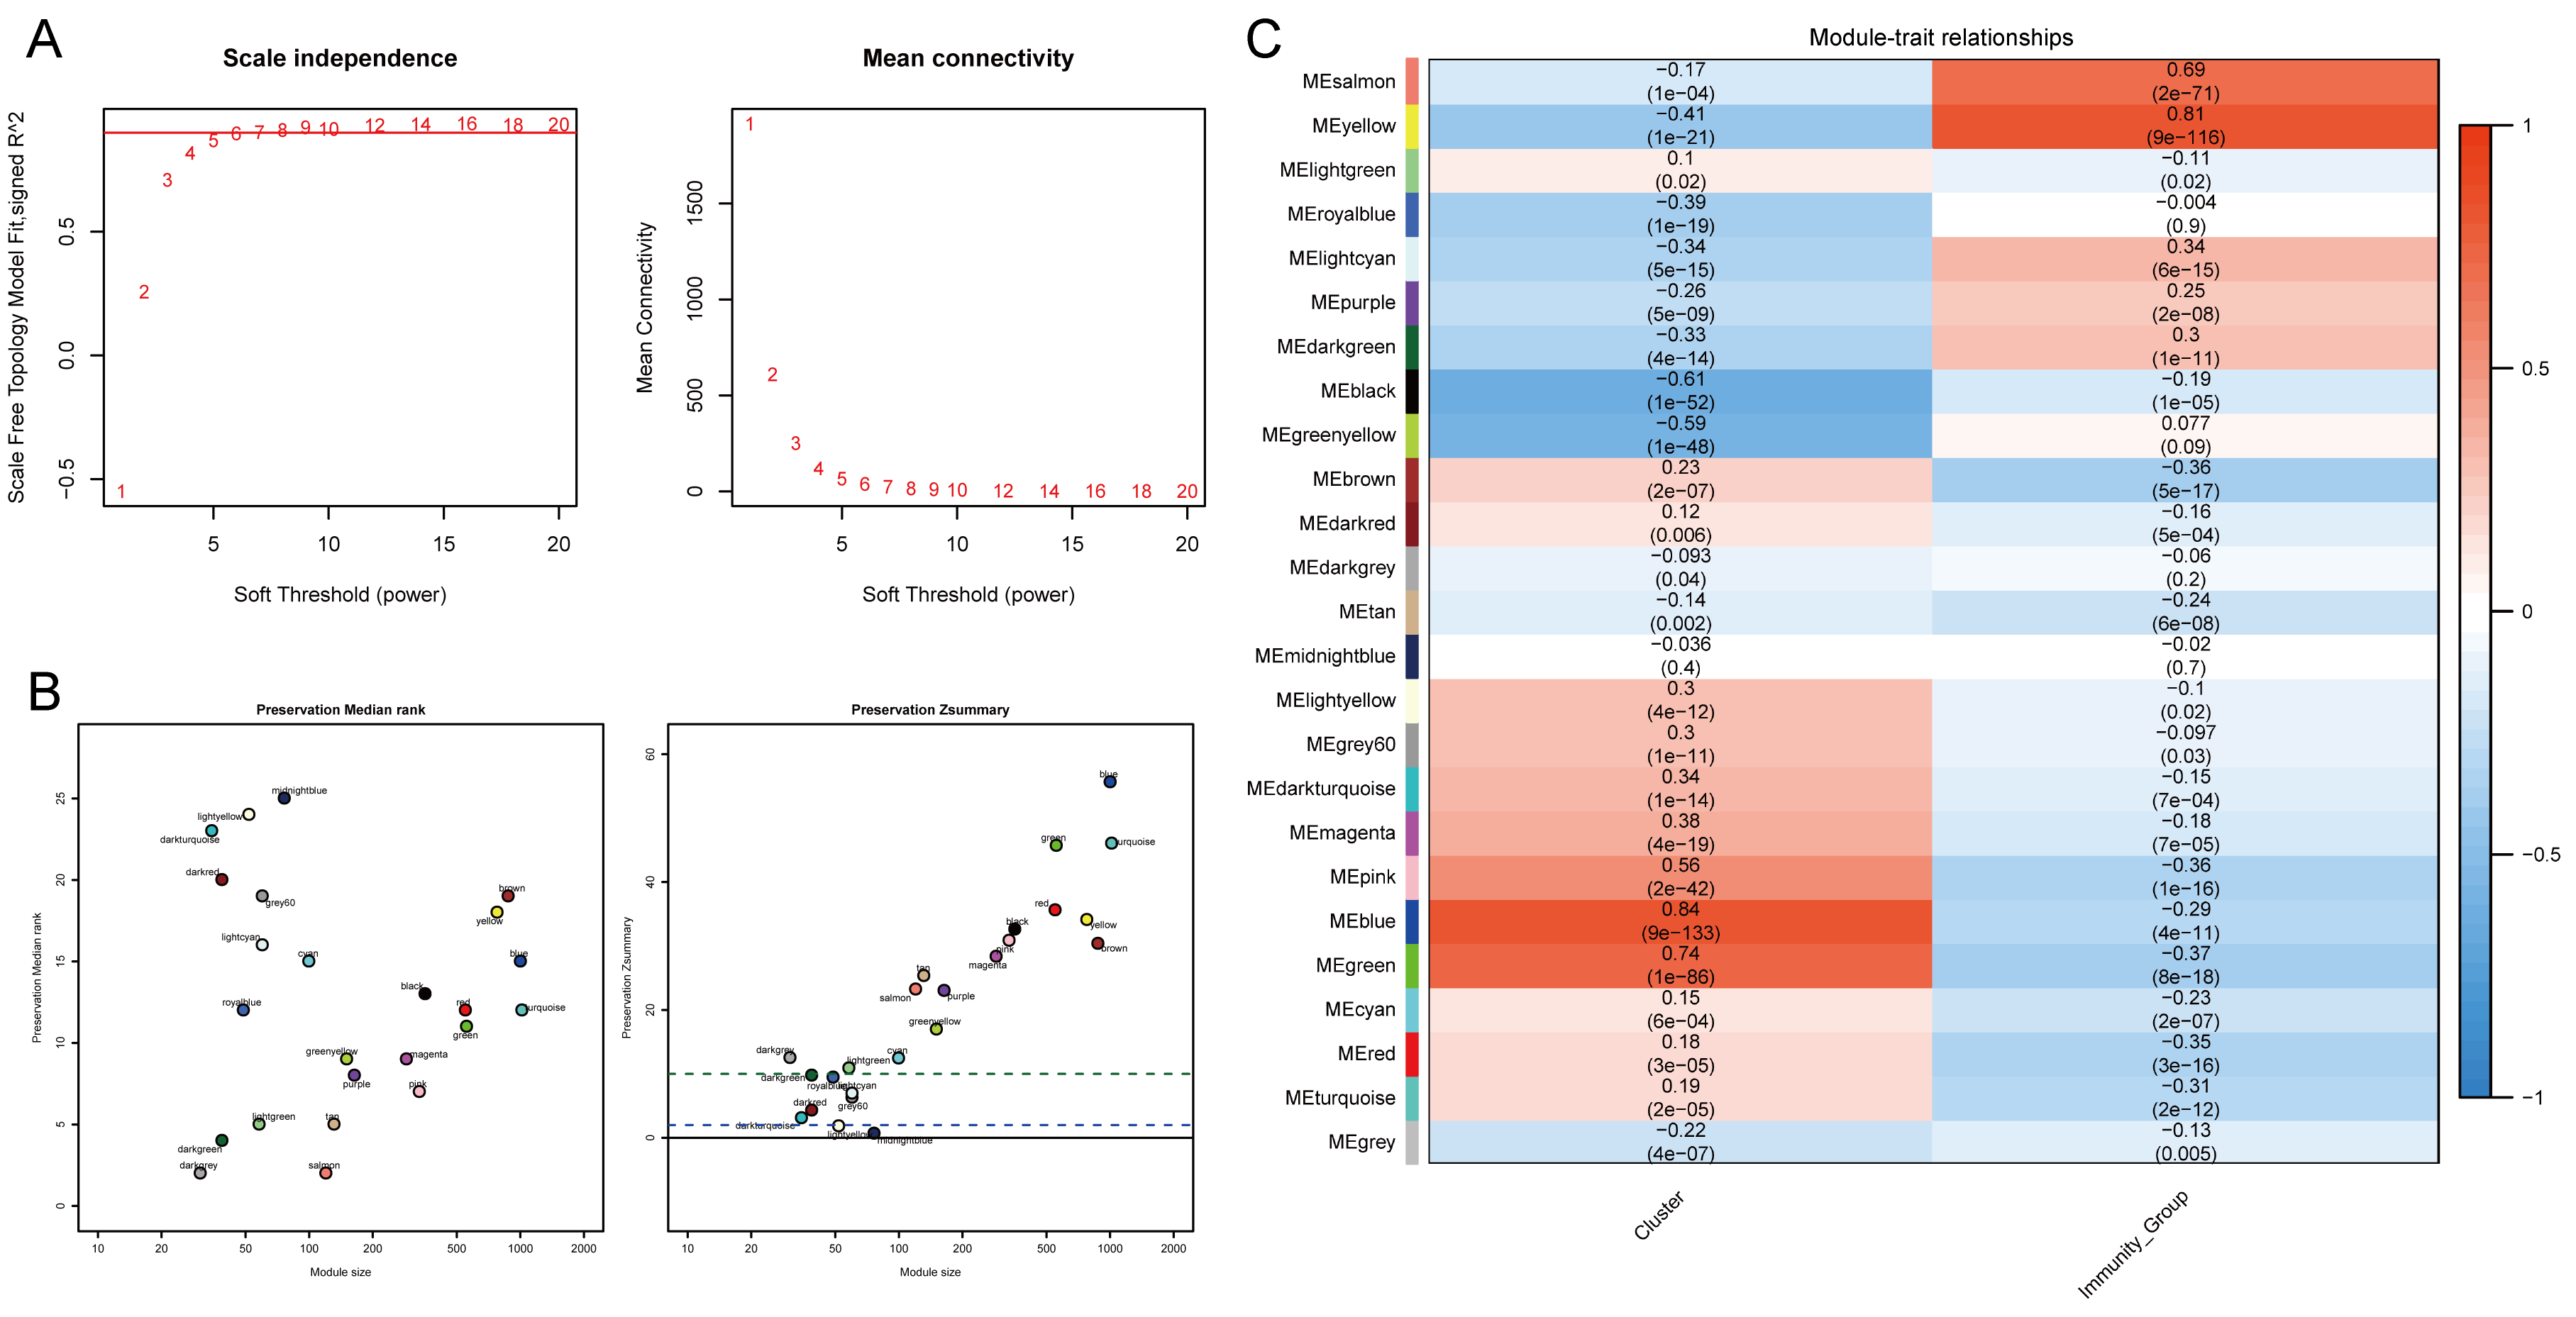
The distribution of genes expression profiles in the subtypes was investigated to identify genes or gene modules highly related to immune infiltration microenvironment. The WGCNA R-package was used to evaluate the expression matrix data from 502 tumour samples. Analysis of network topology for various soft-thresholding powers indicated that when the power value was equal to 5 (β=5), the predicted gene co-expression network exhibited scale-free topology by the fit index greater than 0.8, with inherent modular features (Figure S1A). The adjacency function was used to generate the adjacency matrix based on the β and gene expression matrix. The hierarchical clustering was built based on the TOM dissimilarity measure (Figure 6A). A total of 25 seven co-expression modules were detected. The module preservation statistics was employed to achieve reliable and preserved modules (Figure S1B). The co-expression network was examined by the NULMS Stanford dataset, with genes assigned to modules based on the modules in the reference dataset. There are 16 modules strongly preserved (Z-summary more than 10), such as blue, green, turquoise yellow and red modules; while seven modules are moderately preserved (5 < Z-summary < 10).
The association between module eigengenes, subtypes and immunity were then computed through the Pearson’s correlation coefficient, which evaluates the P-value was calculated for any given correlation. The blue module was most significantly correlated with subtypes, and the yellow module had the highest correlation with immune typing (Figure S1C). Therefore, the genes of these two modules were selected as subtype related hub genes for subsequent analysis, which included a total of 1,747 hub genes. The DEseq2 algorithm was used to further analyse the hub genes in the sequencing data, and significant differentially expression of 814 hub genes were found, among which 308 were up-regulated and 506 were down-regulated in tumour tissues (Figure 6B). The heat map comparing the expression of these 814 genes in log2FC values was displayed in Figure 6C (See Supplementary Table S3 for the full gene list).
Gene ontology and KEGG pathway analysis showed functional enrichment in immune regulations
To further analyse the functions and pathways that 814 hub genes are potentially involved in, GO term and KEGG pathway enrichment analyses were performed using the clusterProfiler package. GO analysis showed that 814 hub genes were mainly involved in biological processes such as regulation of small GTPase mediated signal transduction, positive regulation of endocytosis and regulation of plasma lipoprotein particle levels. In terms of cellular components, these genes showed high relevance to membrane (Figure 7A). KEGG pathway analysis showed that 814 hub genes were mainly enriched in Salmonella infection and endocytosis pathways (Figure 7B). The enrichment analysis of Wikipathway revealed that regulation of apoptosis by parathyroid hormone-related protein, apoptosis modulation and signalling, and pathogenic Escherichia coli infection were the top 3 pathways (Figure 7C). Besides, several cancer relevant pathways were also enriched in the hub genes (Supplementary Table S3).
Establishment and assessment of the predict model
To explore the clinical efficacy of 814 hub genes, Univariate Cox analysis was performed with clinical prognosis data and the results of P-value<0.05 were recorded in Supplementary Table S3. The results of Univariate Cox regression (P-value<0.05) were included in lasso regression. Dimensionalisation was reduced according to the Lambda curve (Figure 8A) and the proportional hazards model curve (Figure 8B), which showed that the deviance was the smallest when the number of genes in the model was 19. The lasso regression results were incorporated into multivariate Cox regression, as seven genes were identified by LASSO regression (Supplementary Table S3), including Ac008063.2, Apoe, Bcl3, Acap3, Alox5ap, Atxn2l and B2m. The risk regression model diagram was displayed in Figure 8C according to the multivariate analysis results. In order to evaluate the specificity and sensitivity of the prognostic model, ROC curve and survival curve were used for evaluation. The AUC value of the ROC curve was 0.748 (Figure 8D) and the survival curve showed a significant difference between the high-risk and low-risk groups (P-value=6.329E-4), indicating a good result of the model (Figure 8E).
The risk score predicted prognosis
To further evaluate the clinical efficacy of the model, univariate Cox analysis (Figure 9A) and multivariate Cox analysis (Figure 9B) were performed by combining THCA clinical data and risk score values, which implied that the risk score value of the model could be used as an independent prognostic indicator to predict the prognosis of patients with thyroid papillary carcinoma (see Supplementary Table S4 for full statistical results).

