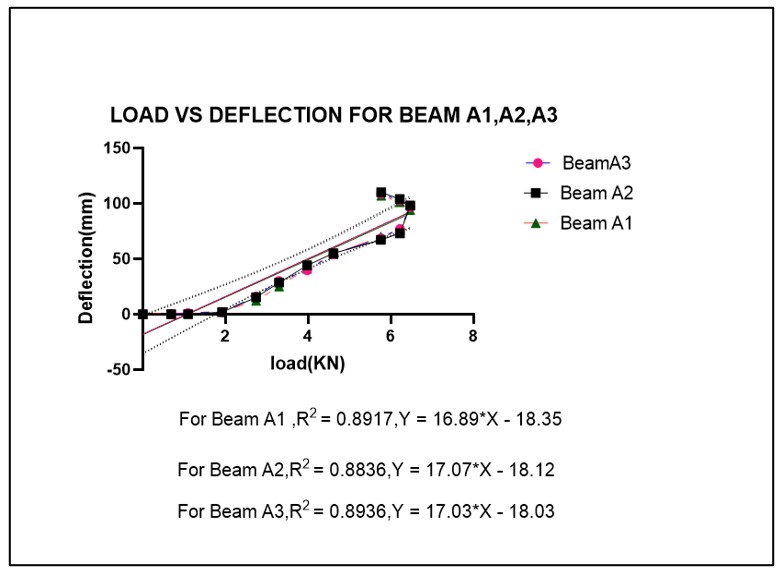
4.1 Load vs Deflection for beams A1, A2, A3
The flexural behaviour of the beam is mainly due to the composite action of steel and concrete. Initially, when it is subjected to loading, it deforms under the load. All the Normal beams were singly reinforced with 8 mm diameter HYSD bars at the bottom tension face. Shear links of 8mm dia with a spacing of 150 mm c/c was provided. To hold bottom bars and shear links 2 number of 8 mm deformed bars were used as hanger bars. The load-carrying capacity of specimen A1 increases linearly with deflection until a load of 1.910 KN. Initial cracking starts to appear which reduces the stiffness of the beam further it was observed that with an increase in the load, cracks start getting wider and deflections increase. The width of these cracks increased leading to the formation of clear noticeable wide cracks as shown in Figure 3. With further increase in the load, larger cracks begin to appear at loads 3.294 KN, 5.756 N, and 6.469 N corresponding to deflections 25 mm, 70 mm, and 94 mm respectively. The Specimen A1 failed at a maximum load of 6.469 KN with a midspan deflection of 94 mm as depicted in table 6. After this point, the beam was unable to resist any load. On further application of load, which is less than the ultimate load, there is very much increase in deflection of the beam as shown in graph 1.
The second normal beam A2 was reinforced similar to specimen A1. When the beam is loaded deformation occurs under load with no sign of cracks. The load capacity of specimen A2 increased proportionally with deflection until a load of 1.270 KN. The major cracks appeared at loads of 2.192 KN, 3.836 KN, 5.587 KN, and 6.576 KN corresponding to deflections of 1.82 mm, 39.5 mm, 68.5 mm, and 96.5 mm respectively as depicted in Table 7. The Specimen A2 failed at a maximum load of 6.576 KN with a maximum deflection of 96.5 mm as shown in Graph 1. The third normal beam A3 Exhibited almost similar behaviour to specimens A1, and A2. Initially, deformation occurs under the application of load with no sign of cracks. The load capacity of specimen A3 increases proportionally with deflection until a load of 1.233 KN. The major cracks appeared at loads of 2.247 KN, 4.201 KN, 6.028 KN, and 6.850 kN corresponding to deflections of 1.85 mm, 44 mm, 73mm, and 98 mm as depicted in Table 8. The specimen A3 failed at a maximum load of 6.850 KN with a maximum deflection of 98 mm. After this load the beam sustained load without exceeding the ultimate load. The cracking pattern of beams A1, A2, and A3 is shown in Figures 3, 4 and 5 respectively.
Table 6: Load and Deflection Values for Beam A1
|
S.No.
|
Proving ring readings
|
Load (KN)
|
Deflection (mm)
|
|
1
|
0
|
0
|
0
|
|
2
|
2.5
|
0.685
|
0.6
|
|
3
|
5
|
1.096
|
1.2
|
|
4
|
7.5
|
1.919
|
2.4
|
|
5
|
11
|
2.741
|
12
|
|
6
|
14
|
3.294
|
25
|
|
7
|
17.5
|
3.974
|
41
|
|
8
|
19.83
|
4.612
|
54
|
|
9
|
21
|
5.756
|
70
|
|
10
|
22.7
|
6.222
|
76.8
|
|
11
|
23.6
|
6.469
|
94
|
|
12
|
22.67
|
6.214
|
101
|
|
13
|
21.14
|
5.765
|
107
|
Table 7: Load and Deflection Values for Beam A2
|
S.No.
|
Proving ring reading
|
Load (KN)
|
Deflection (mm)
|
|
1
|
0
|
0
|
0
|
|
2
|
2
|
0.548
|
0
|
|
3
|
5
|
1.270
|
1
|
|
4
|
8
|
2.192
|
1.82
|
|
5
|
11
|
3.014
|
16
|
|
6
|
13
|
3.562
|
30
|
|
7
|
14
|
3.836
|
39.5
|
|
8
|
17
|
4.66
|
54
|
|
9
|
20.39
|
5.587
|
68.5
|
|
10
|
22.18
|
6.028
|
77
|
|
11
|
24
|
6.576
|
96.5
|
|
12
|
23.02
|
6.312
|
102.7
|
|
13
|
20.91
|
5.732
|
108.6
|
Table 8 : Load and Deflection Value of Beam A3
|
S.No.
|
Proving ring reading
|
Load (KN)
|
Deflection (mm)
|
|
1
|
0
|
0
|
0
|
|
2
|
2.3
|
0.63
|
0
|
|
3
|
4.5
|
1.233
|
0
|
|
4
|
8.2
|
2.247
|
1.85
|
|
5
|
10.6
|
2.904
|
15.2
|
|
6
|
13
|
3.562
|
28.65
|
|
7
|
14.3
|
4.201
|
44
|
|
8
|
18
|
5.012
|
55
|
|
9
|
20.6
|
5.644
|
67
|
|
10
|
22
|
6.028
|
73
|
|
11
|
25
|
6.85
|
98
|
|
12
|
24.06
|
6.597
|
103.9
|
|
13
|
22.27
|
6.106
|
110
|
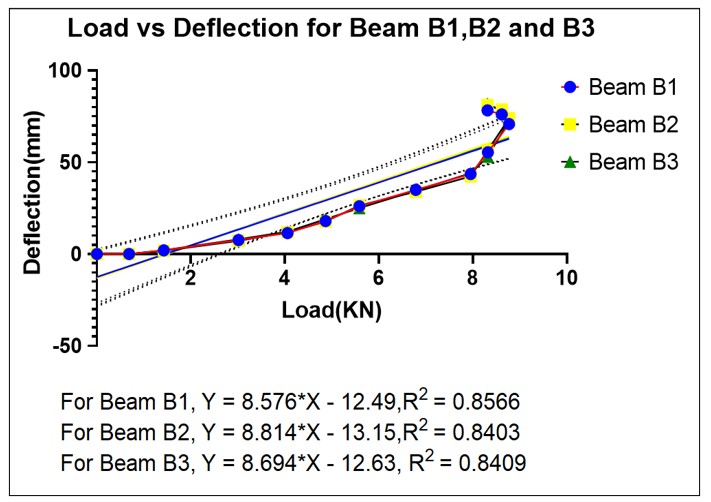
4.2 Load Vs Deflection for Beam B1, B2 and B3
In addition to the above-mentioned reinforcement Beam B1, B2, and B3 were retrofitted with a 6 mm MS plate fixed with the help of geyser bolts at the bottom of the beam. The behaviour of the beam was altogether different from the normal RCC beam in terms of load and deformation behaviour and cracking. When the beam was initially loaded beam started to deformed under load, however, no cracks in the beam were observed. On further increase load minor cracks developed in the central portion of the beam, which further turned into major visible cracks towards the bottom of the beam which occurred at the load 1.370 KN. On further application of load diagonal cracks started to appear towards the end of the steel plate unlike in the case of a normal RCC beam where cracks propagated towards the end supports of the beam as shown in figure 6 which depicts that retrofitting of mild steel plate in beam adds rigidity in that portion of the beam. The major cracks started to appear at loads of 3.753 N, 8.494 KN, and 8.634 KN corresponding to deflections of 11.4 mm, 55.4 mm and 70.8 mm respectively as shown in Table 9. Graph 2 shows the variation of load vs deflection curve in the case of specimens B1, B2 and B3. The ultimate load Sustained by Beam B1 was 8.634 KN and the corresponding deflection recorded by the strain gauge at Point was 70.8 mm. Also, the Same pattern was followed by Beam B2. The major cracks appeared at loads of 4.652 KN, 7.809 KN and 8.768 KN corresponding to deflections of 17.7 mm, 42.3 mm and 56.6 mm respectively as shown in Table 10. The ultimate load sustained by beam Beam B2 was 8.823 KN and the corresponding deflection recorded by strain gauge at this load was 74 mm. Also, a similar pattern was followed by beam B3 as followed by beams B1 and B2. The major cracks appeared at loads of 4.055 KN, 7.950 KN and 8.768 KN corresponding to deflections of 12.2 mm, 44 mm and 73 mm respectively shown in Table 11. The ultimate load retained by the beam B3 was 8.768 KN and the deflection corresponding to the strain gauge at this point was recorded at 73 mm. The cracking pattern of beams B1, B2 and B3 is depicted in Figures 6.7, and 8 respectively.
Table 9. Load and deflection values for Beam B1
|
S.No.
|
Proving ring reading
|
Load (KN)
|
Deflection (mm)
|
|
1
|
0
|
0
|
0
|
|
2
|
3
|
0.822
|
0
|
|
3
|
5
|
1.37
|
2
|
|
4
|
11
|
3.014
|
7.6
|
|
5
|
13.7
|
3.753
|
11.4
|
|
6
|
16
|
4.395
|
18
|
|
7
|
19.4
|
5.325
|
26
|
|
8
|
23.3
|
6.402
|
35
|
|
9
|
27
|
7.461
|
43.6
|
|
10
|
31
|
8.494
|
55.4
|
|
11
|
31.5
|
8.634
|
70.8
|
|
12
|
30.61
|
8.391
|
76
|
|
13
|
29.18
|
8.00
|
78.2
|
Table 10: Load and Deflection Values of Beam B2
|
S.No.
|
Proving ring reading
|
Load (KN)
|
Deflection (mm)
|
|
1
|
0
|
0
|
0
|
|
2
|
3.5
|
0.96
|
0
|
|
3
|
4.8
|
1.315
|
1.78
|
|
4
|
10.5
|
2.877
|
7.2
|
|
5
|
14
|
3.898
|
11.9
|
|
6
|
17
|
4.652
|
17.7
|
|
7
|
20.9
|
5.732
|
26.5
|
|
8
|
24
|
6.668
|
33.9
|
|
9
|
28.5
|
7.809
|
42.3
|
|
10
|
32
|
8.768
|
56.6
|
|
11
|
32.2
|
8.823
|
74
|
|
12
|
31.28
|
8.574
|
78.7
|
|
13
|
30.19
|
8.276
|
81.1
|
Table 11: Load and Deflection Values for Beam B3
|
S.No.
|
Proving ring reading
|
Load (KN)
|
Deflection (mm)
|
|
1
|
0
|
0
|
0
|
|
2
|
2.5
|
0.685
|
0
|
|
3
|
5.2
|
1.425
|
2.1
|
|
4
|
11
|
3.014
|
8
|
|
5
|
14.8
|
4.055
|
12.2
|
|
6
|
17.7
|
4.865
|
19
|
|
7
|
20.3
|
5.583
|
25
|
|
8
|
24.7
|
6.786
|
34.5
|
|
9
|
29
|
7.95
|
44
|
|
10
|
30
|
8.32
|
53
|
|
11
|
32
|
8.768
|
73
|
|
12
|
31.42
|
8.614
|
77.7
|
|
13
|
30.32
|
8.311
|
81.8
|
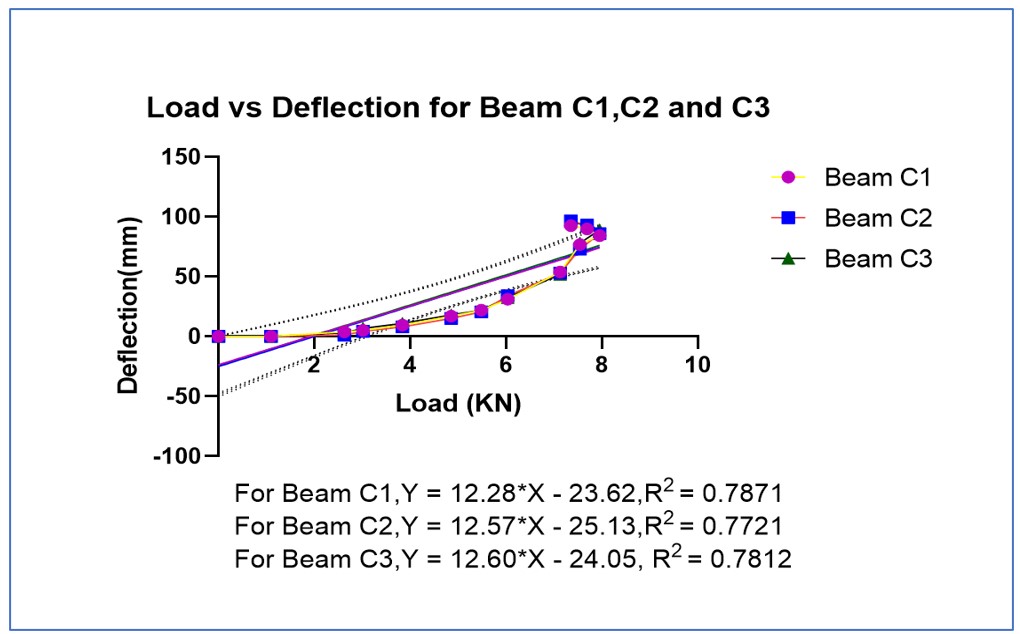
4.3 Load vs Deflection for Beam C1, C2, and C3
Beam C1 was retrofitted with 2 layers of ordinary wire mesh and the size of the wire strand size was 0.5 mm and the openings 3mm. The wire mesh was tightly wrapped around the central portion of the beam without using any epoxy. The behaviour in the case of specimens C1, C2, and C3 was found different from the Normal RCC beam but somehow was similar to the MS plate retrofitted beam underloading. The beam resisted the load in the initial phase without cracking, exhibiting noticeable deformation in the central portion. As the load increased, the observation revealed a release of small fine particles. Upon closer inspection, cracks were observed in the beam, yet they did not extend towards the supports of the beam. Notably, the cracks were confined to the central portion of the beam where a wire mesh was wrapped.
The physical observation cracks were observed at 2.623 KN, 5.480 KN, 7.535 KN, and 7.946 KN corresponding to deflections of 3.8 mm, 22 mm, 76.8 mm, and 84.2 mm respectively as shown in Table 12. The ultimate load sustained by specimen C1 was 7.946 KN and the deflection corresponding to this point was recorded as 84.2 mm. The final failure occurred due to the tearing of wire mesh at the bottom corners of the beam in the case of all three C1, C2, and C3 beams. The variation of load vs deflection for beams C1, C2 and C3 is shown in graph 3. Although somewhat similar results were found in beam C2 and the cracks were observed at 1.584 KN, 3.726 KN, 6.028 KN, and 8.220 KN corresponding to deflections of 1.2 mm, 8 mm, 34 mm, and 86 mm respectively as shown in Table 13. Also, in the case of Beam C3 similar pattern was seen as in Beam C1 and C2 and observation the cracks were observed at 1.781 KN, 3.836 KN, 5.891 KN and 8.700 KN corresponding to deflections of 3 mm, 11 mm, 32.5 mm and 89 mm respectively as shown in table 14. The ultimate load sustained by specimen C3 was 8.700 KN and the deflection corresponding to this point was recorded 89mm. The cracking pattern of beams C1, C2 and C3 is shown in Figures 9,10, and 11 respectively.
Table 12: Load and deflection Values of beam C1
|
S.No.
|
Proving ring reading
|
Load (KN)
|
Deflection (mm)
|
|
1
|
0
|
0
|
0
|
|
2
|
4
|
1.096
|
0
|
|
3
|
9.6
|
2.623
|
3.8
|
|
4
|
11
|
3.014
|
5.2
|
|
5
|
12
|
3.836
|
9.4
|
|
6
|
17.7
|
4.854
|
17
|
|
7
|
20
|
5.48
|
22
|
|
8
|
22
|
6.028
|
31.2
|
|
9
|
26
|
7.124
|
53.8
|
|
10
|
27.5
|
7.535
|
76.8
|
|
11
|
29
|
7.946
|
84.2
|
|
12
|
28.03
|
7.684
|
89.8
|
|
13
|
26.93
|
7.348
|
92.7
|
Table 13: Load and deflection Values of beam C2
|
S.No.
|
Proving ring reading
|
Load (KN)
|
Deflection (mm)
|
|
1
|
0
|
0
|
0
|
|
2
|
3
|
0.822
|
0
|
|
3
|
5.7
|
1.584
|
1.2
|
|
4
|
10
|
2.74
|
4.2
|
|
5
|
13.6
|
3.726
|
8
|
|
6
|
16.3
|
4.48
|
15
|
|
7
|
18.5
|
5.07
|
20.6
|
|
8
|
22
|
6.028
|
34
|
|
9
|
25
|
6.85
|
53
|
|
10
|
27.8
|
7.599
|
73
|
|
11
|
30
|
8.22
|
86
|
|
12
|
29.64
|
8.125
|
93.1
|
|
13
|
29.01
|
7.954
|
96.6
|
Table 14: Load and Deflection Values of Beam C3
|
S.No.
|
Proving ring reading
|
Load (KN)
|
Deflection (mm)
|
|
1
|
0
|
0
|
0
|
|
2
|
3.5
|
0.96
|
0
|
|
3
|
6.5
|
1.781
|
3
|
|
4
|
10.5
|
2.875
|
6.8
|
|
5
|
14
|
3.836
|
11
|
|
6
|
16.8
|
4.621
|
18
|
|
7
|
18.6
|
5.121
|
22
|
|
8
|
21.5
|
5.891
|
32.5
|
|
9
|
25.5
|
6.987
|
52
|
|
10
|
29
|
7.965
|
78
|
|
11
|
32
|
8.7
|
89
|
|
12
|
31.49
|
8.632
|
92.3
|
|
13
|
30.26
|
8.296
|
96.2
|