Variation of ARB during digestive process
In this study, cells treated with different digestive juice (Table S1) were washed by PBS buffer and then stained with CTC/DAPI. Finally, live cells and dead cells can be differentiated and counted by FCM. As Fig. 2 shown, compared to in vitro simulation (group C), the number of live cells was barely changed in mouth simulation (group S) as the proportions of live cell were 88.00% and 87% (total cell were both about 3.5 × 10⁹), respectively. In the simulated stomach (group G), the pH of gastric juice has great influence on cells. When gastric juice pH was more than 2.0, almost all the ARB were killed and only no more than 0.2% (total population of 2.45 × 10⁹–2.54 × 10⁹) ARB survived. However, when gastric juice pH was over 3.0, more than 80% ARB (total population of 2.71 × 10⁹–3.90 × 10⁹) survived after a 2-hour treatment. In the simulated small intestine (group D), living cell populations in group D1, D2, D3 and D4 were 1.35 × 10⁷, 1.30 × 10⁷, 1.31 × 10⁹ and 1.68 × 10⁹, and the percentages of living cells were 6.12%, 1.04%, 51.80% and 42.60%, respectively. Therefore, the pH of gastric juice might be the most important reason affecting the survival of ARB when they passed through the digestive tract. Moreover, except the survival ARB seriously damaged by stomach acid could not recover for the reason of the digestive enzyme pancreatin and lipases, others adapted, grew and reproduced in the intestinal juice.
According to the SEM images shown in Fig. 3, the cells in the control group are intact and well-structured, while the cells in the treatment groups show various morphology. The lower pH was, the more seriously the cells were damaged, the fewer the number of cells is. Compared to the control (Fig. 3e), greater damages can be found in the cells treated by the gastric juice with pH 1.0 (Fig. 3a) and pH 2.0 (Fig. 3b), showing obvious ruptures and particles on cell surface. However, bacteria cells in the gastric juice with pH 3.0 (Fig. 3c) and pH 4.0 (Fig. 3d) have similar morphology to the control and their ability of reproduction can be proved by cell division. Most bacteria can optimally grow at pH ranging from 6.7 to 7.5 but only a few can survive at extreme pH [34, 35], and ARB used here are no exception. Bacteria could adapt to low pH environments by reducing membrane lipid methyl moieties [36]. The FCM result and SEM images provided strong evidence that most of ARB died at extremely low pH (pH ≤ 2.0) with cell membrane greatly damaged, but survived with intact cell if the pH of gastric juice is no less than 3.0. Those surviving ARB even could recover and reproduce in suitable environment such as intestine tract, which might threaten human health.
Variation of eARGs and iARGs during digestive process
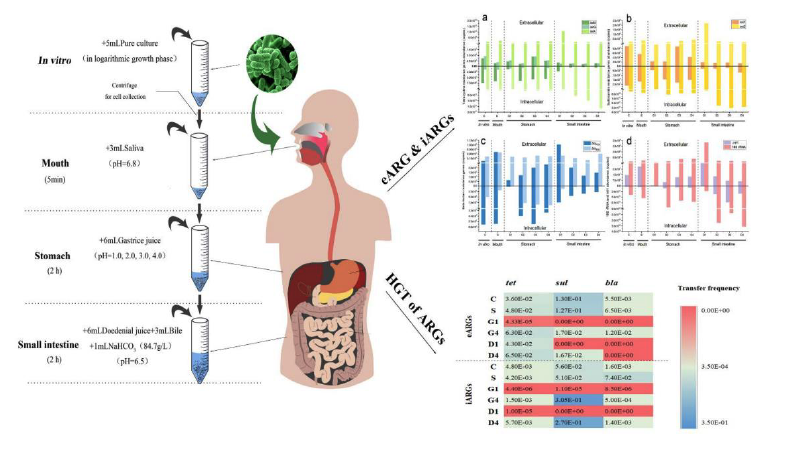
Both eARGs (Extracellular antibiotics resistance genes) and iARGs (intracellular antibiotics resistance genes) in ARB cultures treated with different digestion juices were detected by QPCR, and the results were showed in Fig. 4. In general, the abundance of iARGs was higher than that of eARGs, differing by 0–5 orders of magnitude. DNA is generally present inside cells and plays a role in the storage and transmission of genetic information as the main material foundation of biogenetics. DNA is released only when cells are damaged or lyzed by self-induced lysis or harsh conditions such as ultrasound, extreme pH, and high temperatures [37, 38]. Notably, eARGs accounted for 0.03–24.56% of total genes in the control (group C) only treated with PBS buffer. It was probably because Hormaechei could actively excrete DNA just like Acinetobacter, Bacillus, Flavobacterium, Micrococcus, Pseudomonas and Streptococcus [39–41]. Among eARGs, the average abundances of tetA, 16S rDNA, intI1 and sul2 were at high level (order of magnitude, i.e. 7–9). In the same way, among iARGs, the average abundances of sul2, intI1, 16S rDNA and tetA were also at high level (order of magnitude, i.e. 11–13). The boxplots of Fig. S5 obviously showed that the abundances of tetA, 16S rDNA, intI1 and sul2 are high in both eARGs and iARGs. 16S rDNA is the DNA sequence coding 16S rRNA, which exists in all bacterial chromosome genes. The abundances of tetA and sul2 higher than other ARGs, which is consistent with some other reports [42, 43]. The Pearson correlation coefficients (Fig. S4) of intI1 with tetA and sul2 are significantly high (r = 0.801–0.937, p < 0.01), suggesting that intI1 contains a site for integrating with tetA and sul2.
Along the simulated digestive tract, first in mouth, saliva had very little impact on the abundance of eARGs and iARGs only with slight fluctuations, which was consistent with the effect of saliva on the proportion of live ARB cells. Mercer [44] found that adding pure acids into human saliva could not lead DNA to degrade immediately and even persist for hours. Then to stomach, ARB were treated with gastric juices at different pH (i.e. 1.0, 2.0, 3.0, 4.0). Although the pH values of gastric juice increased owing to the inflow of saliva (Table S1), the acidic environment in stomach made both eARGs and iARGs decrease. The greatest downturn of ARGs recorded at the gastric juice pH of 1.0, especially the extracellular tetA, sul2, intI1, blaFOX and intracellular tetA, sul2, intI1, blaFOX, blaEBC, 16S rRNA, which all decreased by more than 91% owing to the cell injury (Fig. 3) and the bacteria activity (Fig. 2). However, both eARGs and iARGs decreased slightly when gastric juice pH ≥ 2.0, nearly in the same order of magnitude. Ferrini et al. [45] used the fresh collected human gastric juice to treat the maize Bt176 DNA carrying target traits of blaTEMl, cry/A(b) and sub-cry/A(b) and found that cry/A(b) was completely degraded when gastric juice pH = 1.59, and the fragments of the three genes can be detected when gastric juice pH ≥ 2.0, which was similar to our results. When ARB entered from stomach with gastric acid of pH 1.0, 2.0, 3.0 and 4.0 to small intestine with neutral intestinal juice, their habitat pH returned to pH 8.03, 8.45, 9.33 and 9.66, respectively (Table S1). Even though, each gene of eARGs or iARGs was different from group to group. It was found that smaller genes could survive gastric juice better [45]. However, the boxplots of Fig. S6 show the downtrend of eARGs, the uptrend of iARGs and downtrend of total genes, from group D1 to group D4. Those may result from many reasons. The stronger rupture of ARB caused by gastric juice probably lead to more genes released from cells and the reduction of genes may due to pH value or certain substances in intestinal juice.
Combined with the change of living ARB percentage along the digestive tract, it is not difficult to find: pH of gastric juice was the key reason affecting the activity of ARB and the abundance of ARGs reaching intestinal tract. The lower the pH of gastric juice was, the more obvious the destructive effects of gastric juice on ARB and ARGs were. Therefore, the food-borne ARB carrying ARGs may successfully reach the small intestine when gastric acid secretion was insufficient for some reasons such as drugs, illness and so on. Subsequently, HGT might trigger between the immigratory ARB or ARGs and the local intestinal bacteria, posing a risk of human health.
The HGT potential of eARGs and iARGs
In order to investigate the potential of immigratory ARGs horizontal transferring to intestinal bacteria, cell free supernatant (containing eDNA) and sediment (containing iDNA) were separated and used to performed ARGs horizontal transfer assays.
As shown in Fig. 5, the transfer frequency of eARGs is generally higher than that of iARGs, although the abundance of iARGs is higher than that of eARGs (Fig. 4). Transformation does allow for the uptake of plasmid DNA and chromosomal DNA and transformation with chromosomal DNA fragments is usually more efficient than with plasmids [46]. Moreover, DNA uptake by competent bacteria occurs rapidly in vitro [47, 48]. Therefore, transformation occurs more easily than conjugation, which depends on the mating-pair formation apparatus. Transconjugants and transformants peaked in selective plate with tetracycline with highest detection of 100%, followed in plate with sulfanilamide with detection of 75% and declined to the lowest in plate with cefotaxime sodium with detection of 58%. Many reports have showed that mobile integrin intI1 played an important role in horizontal transfer of ARGs [7, 26, 49]. Based on the previous result (Fig. S4), the correlations of intI1 with tetA and sul2 are very significant (r = 0.801–0.937, p < 0.01). Under in vitro condition (group C), ARGs from Hormaechei also had horizontal transfer potential, with transfer frequency ranging from 5.50 × 10− 3 to 1.30 × 10− 1. In natural environment, there are 0–100% bacteria that can develop time-limited competence in response to specific environmental conditions such as altered growth conditions, nutrient access, cell density (by quorum sensing) or starvation [11]. Soda et al. also found the high transfer frequency (transfer frequencies were 5.0 × 10− 2 to 7.5 × 10− 1/donors and 4.6 × 10− 3 to 1.3 × 10− 2/potential recipient) can be detected under natural condition [50]. Saliva barely affected on the horizontal transfer potential of ARGs since the transfer frequencies of eARGs and iARGs are similar with that under in vitro condition. Those slight changes possibly resulted from the short-time treatment of saliva.
However, there were significant differences in the transfer frequencies of eARGs and iARGs are significantly different in group G and group D. Generally, the transfer frequencies of eARGs and iARGs in group G4 are higher than those in group G1. The ARGs horizontal transfer cover three mechanisms: conjugation, transformation and transduction. Conjugation includes two preconditions: (1) cell-to-cell junctions; (2) the presence of a pore through which ARGs can pass. Transformation includes two preconditions: (1) the release and persistence of eARGs; (2) the presence of competent bacterial cells. The precondition of transduction is the presence of bacteriophage [10, 11]. Based on it, the mechanisms for the horizontal transfer of eARGs and iARGs are transformation and conjugation, respectively. Therefore, the transfer frequency of eARGs probably related to the pH value of supernatant and the abundance of eARGs, while the transfer frequency of iARGs probably related to the activity of donors and the density of receptors and donors.
ARGs in transformants and transconjugants
The relative abundance of tetracycline resistance genes (tetA, tetG, tetM), sulfonamide resistance genes (sul1, sul2) and cephalosporin resistance genes (blaFOX, blaEBC) in transformants and transconjugants is shown in Fig. 6a. In general, the relative abundance of tetracycline resistance genes (tet) was the highest among the three resistance genes, followed by sulfonamide resistance genes (sul) and cephalosporin resistance genes (bla).
Among the transformants, there was no significant difference in the relative abundance of tet between group C (control group), group S, group G4 and group D1, all of which were about 5.0 × 10− 2. The relative abundance of tet in group G1 and group G4 was significantly higher than those in other groups (1.39 × 10− 1 and 1.98 × 10− 1, respectively). The relative abundance of sul in each group was significantly different. The relative abundances of sul in group S and group G4 were lower than that in group C (control group). The relative abundance of sul in group G1 and group D4 was significantly higher than that in other groups (3.7 × 10− 2 and 3.46 × 10− 2, respectively). Bla gene was lower than that in D1 group. Except for the control group, the transformants in the other groups were higher than those in the C group (control group), and the gene abundance was about 2.09 ×10− 3.
In the transconjugants, the relative abundance of tet in group D4 was significantly higher than that in other groups (tet relative abundance was 1.8 × 10− 1), and the relative abundance of tet in other groups was about 1.2 × 10− 1; the relative abundance of sul in each group was not significant, the relative abundance of sul in group G4 was slightly higher than that in other groups; the relative abundances of bla in group C, S, G1 were similar, all of which were about 1.5 × 10− 3–2.0 × 10− 3. The relative abundances of bla in group D1 and group D4 transconjugants were both about 1.0 × 10− 3.
The proportions of three types of ARGs (tet, sul and bla) were similar among the groups of transconjugants and transformants (Fig. 6b). tet, sul and bla were 78–87%, 11–21%, 1–2% in transformants, 77–88%, 12–22% and 0–1% in transconjugants, respectively.
The relative abundance of ARGs in transformants or transconjugants varied a lot among groups, but the proportions of tet, sul and bla were quite constant. The relative abundance of ARGs is related to the copy number of ARGs in cells. When ARGs integrated into chromosomal DNA, ARGs replicate along with chromosomal DNA, which only occurs when cells divide. When ARGs integrated into stringent plasmid, the stringent plasmid replicate at the same time as chromosomal DNA. However, when ARGs integrated into relaxed plasmid, ARGs can replicate along with relaxed plasmid during the whole cell cycle [51].