Unless specified otherwise, all tables and charts presented in this study are derived from the survey conducted in 2020.
Characteristics of Road Corridors
Table 1 provides insights into the characteristics of the chosen road corridors. These corridors include Adatan Car Wash/Asero, Panseke/Adigbe, Kuto/Isabo, and Sapo-Ijaye/Iyana Mortuary. These roads play a pivotal role as major thoroughfares connecting diverse land-use activities within Abeokuta and serving as crucial links to major cities surrounding Abeokuta.
Table 1
Characteristics of selected Road Corridors and Associated Land uses
| SN | Road Corridor Name | Road Types | Types of carriageway | Major intersections | Land use Characteristics |
| 1 | Adatan/ Asero | Arterial | 2-lane (one way) | Adatan roundabout, car wash intersection, Aladesanmi intersection | Public, Religious, Motor Parks, and service industry |
| 2 | Panseke- Adigbe | Sub-arterial | 2-lane (one way) | Panseke intersection, Ibara roundabout, Kuforiji intersection | Public, Institutional, residential, retailing shops |
| 3 | Kuto- Isabo | Sub-arterial | 2-lane (one way) | Kuto roundabout, Iyana Oja intersection | Public, institutional, Motor Park and Market, retailing shops |
| 4 | Sapo-Ijaye- Iyana Mortuary | Arterial | 4-lane divided (Two way) | Sapon roundabout, Ijaye Roundabout, Iyana-Mortuary intersection | Public, service industry, Commercial Motor Park, Religious, Market |
Adatan-Car Wash/Asero Road: Adatan-Car Wash/Asero Road currently operates as a two-lane one-way, undergoing construction to transform into a four-lane dualized route. This road serves as a vital link connecting significant land uses, including Isale Abetu Cemetery (public), Adatan Market (market), banks, filling stations (service industry), and the Mudasiru Lawal International Stadium (public). Key intersections along this route include Adatan Roundabout, Car Wash Intersection, and Aladesanmi Intersection.
Panseke/Adigbe: Panseke/Adigbe is presently a two-lane one-way road, undergoing construction for a potential upgrade to a four-lane two-way road. The road interfaces with diverse land-use activities, such as Independent Park (recreational), June 12 Garage/Market (public/market), banks (service industry), and retailing shops (commercial). Major intersections along this route include Panseke Intersection, Ibara Roundabout, and Kuforiji Intersection.
Kuto/Isabo: Kuto/Isabo operates as a two-lane one-way road, connecting various essential land-use activities, including MKO International Stadium (public), June 12 Cultural Centre (recreational), religious sites, markets, and numerous retailing shops. Key intersections include Kuto Roundabout and Iyana Oja Intersection.
Sapo/Iyana Mortuary: Sapo/Iyana Mortuary is a four-lane divided (two-way) road, featuring major intersections at Sapon Roundabout, Ijaye Roundabout, and Iyana-Mortuary Intersection. This road is associated with land uses such as saw-mill industry, service industry, retailing shops, and several shopping complexes
Traffic Characteristics of Road Corridors
Traffic Volume Patterns
Average Daily Traffic Volume in the Studied Roads
Traffic volume, typically measured as Vehicles per Hour (vph), represents the count of vehicles passing a specific point on a roadway within a designated timeframe. For both peak periods (morning and evening), the total three-hour traffic volume was divided by 3 to calculate the vehicles per hour. The daily peak is derived from the average of both morning peak vph and evening peak vph. The average peak hour volume, expressed in vph, is detailed in Table 2.
Table 2
Average Peak hour volume in selected Road Corridors
| SN | Road Corridors | Morning Peak | Evening Peak | Daily Peak |
| vph | % | vph | % | vph | % |
| 1 | Adatan-Car-wash-Asero | 1187 | 18.8 | 1488 | 20.8 | 1338 | 19.9 |
| 2 | Panseke-Adigbe | 1183 | 18.8 | 1542 | 21.6 | 1363 | 20.3 |
| 3 | Kuto-Isabo | 1570 | 24.9 | 1859 | 26.0 | 1714 | 25.5 |
| 4 | Sapo-Ijaye-Iyana Mortuary | 2367 | 37.5 | 2263 | 31.6 | 2315 | 34.4 |
| Total | 6307 | 100 | 7152 | 100 | 6730 | 100 |
Traffic Volume Analysis of Road Corridors
From Table 2, the Sapo-Ijaye-Iyana Mortuary road stands out as the corridor with the highest traffic volume among the studied road networks. It contributes 37.5% (2367 vph), 31.6% (2263 vph), and 34.4% (2315 vph) to the total traffic during the morning, evening, and daily peaks, respectively. This high traffic volume underscores the significance of the land use activities it facilitates, serving as a vital link to the Lagos/Ibadan expressway through the Ogere road and connecting important establishments like the post office, sawmill, St. Jude Anglican church, and numerous retail shops.
The Kuto-Isabo road follows closely, generating the second-highest traffic volume with 1570 vph (24.9%), 1859 vph (26%), and 1714 vph for the morning, evening, and daily peaks, respectively. This road's importance is evident in its connection to MKO International Stadium, June 12 cultural center, St. John Anglican Schools (primary and secondary), Kuto garage, Oba Lipede Ultra-Modern Market, and various retail businesses.
Panseke-Adigbe secures the third position, recording 1183 vph (18.8%), 1542 vph (21.6%), and 1363 vph (20.34%) for the morning, evening, and daily peaks, respectively. The traffic flow on Panseke/Adigbe road highlights its significance in connecting June 12 Garage/Market, Independent Park, and several commercial centers linked by the road, serving as a major link to Lagos/Abeokuta road through Sango Ota.
Adatan Car Wash-Asero ranks fourth, registering 1187 vph (18.8%) in the morning peak, 1488 vph (20.8%) in the evening peak, and 1338 vph (19.94%) during daily peaks. This road connects traffic to Ibadan through Apata, links to Adatan Market, and hosts numerous retail shops.
The aggregate variation between morning and evening peak hours, depicted in Fig. 2, indicates a higher traffic volume in the evening peak (1788 vph) than in the morning peak (1577 vph). This asymmetry may be attributed to commuters leaving home before or after peak hours to avoid congestion, resulting in a staggered morning traffic pattern. However, in the evening, individuals might be eager to return home promptly after work.
This traffic pattern is consistent across all road corridors, except for Sapo-Ijaye-Iyana Mortuary, where the morning peak (2367 vph) surpasses the evening peak (2263 vph). Nevertheless, the Chi-square test results (X = 0.822604, p = 0.84405) indicate no significant differences in the number of vehicles per hour between morning and evening peaks among the studied road corridors. This suggests that any differences noted in traffic volume during these peak hours across the studied road corridors are likely due to random chance rather than meaningful patterns. However, it is essential to interpret these findings with caution. The lack of statistical significance does not negate the practical significance of observed variations. Other qualitative factors and local knowledge should be considered to gain a comprehensive understanding of the traffic dynamics.
Analysis of Average Traffic Volume by Selected Days of the Week
The traffic counts were conducted on Monday, Wednesday, and Saturday, offering insights into the variations in traffic volume based on these specific days. The aggregate data on traffic volume revealed distinct implications for different days of the week. The overall distribution demonstrates that Monday had the highest share, accounting for 39% of the total traffic generated on the selected road corridors over the three days. Following closely is Wednesday with 34%, and Saturday with 27%, as illustrated in Fig. 3.
This variation in traffic volume among the selected days carries economic implications. The heightened traffic volume on Monday is likely attributed to its perception as the most economically crucial day. Individuals are eager to commence their workweek on a positive economic note, contributing to the increased traffic. Wednesday, while still a significant working day, might not be viewed as economically pivotal as Monday. This perspective possibly results in a slight dip in traffic volume on Wednesdays. On the other hand, Saturday, being a weekend associated with relaxation and social events, experiences a comparatively lower traffic volume during peak hours. This phenomenon aligns with the general trend of fewer people rushing out on weekends, contributing to the observed decrease in traffic volume on Saturdays.
The data breakdown for each specific location reveals a consistent pattern with the overall distribution, as depicted in Fig. 4.
Pattern of Traffic Composition
The traffic composition across the studied corridors is detailed in Table 3. The data reveals that cars, encompassing both private cars and taxis, constitute the largest share with 44% of the total volume, amounting to 4444 vehicles per hour (vph). This stands in contrast to the findings of Aderamo & Atomode (2012), where motorcycles were reported to be the predominant vehicle type in Ilorin. Nevertheless, motorcycles still account for a substantial portion, comprising the second-highest type with 28.8% and 2905 vph. Buses and lorries/tippers follow, contributing 18.1% (1827 vph) and 9.1% (920 vph), respectively.
The prevalence of cars in Abeokuta signifies its dependency on automobiles for urban mobility. While cars offer individuals the convenience and flexibility to travel easily from one point to another, their extensive use raises significant concerns for the environment, public health, and the overall livability of the city. Moreover, over reliance on cars for transportation may exclude individuals who are unable to drive due to age, disability, or other reasons. This lack of inclusivity can contribute to social isolation and limit participation in various activities.
The noticeable increase in motorcycle presence further reflects a growing inclination towards using them as a key solution to tackle transportation challenges within the urban landscape.
Table 3
Traffic Composition at the studied Road Corridors
| Vehicle Type | A | % | B | % | C | % | D | % | Total | % | vph |
| Motorcycle | 1752 | 21.8 | 2572 | 31.5 | 3266 | 31.8 | 4028 | 29.0 | 11618 | 28.8 | 2905 |
| Car | 4200 | 52.3 | 3588 | 43.9 | 4394 | 42.7 | 5594 | 40.3 | 17776 | 44.0 | 4444 |
| Bus | 1198 | 14.9 | 1280 | 15.7 | 1838 | 17.9 | 2992 | 21.5 | 7308 | 18.1 | 1827 |
| Lorry/Tipper | 876 | 10.9 | 736 | 9.0 | 788 | 7.7 | 1278 | 9.2 | 3678 | 9.1 | 920 |
| Total | 8026 | 100 | 8176 | 100 | 10286 | 100 | 13892 | 100 | 40380 | 100 | 10095 |
| vph | 1338 | 19.9 | 1363 | 20.3 | 1714 | 25.5 | 2315 | 34.4 | 6730 | 100 | |
| Note: A = Adatan/Asero, B = Panseke/Adigbe, C = Kuto/Isabo, D = Sapo/Iyana Mortuary |
The distribution of vehicle types exhibits a similar trend across road corridors, albeit with varying levels of deviation. In the Adatan/Asero corridor, over half (52.3%) of the vehicles were either private or commercial (taxi), whereas this figure was 43.8%, 42.7%, and 40.3% in Panseke/Adigbe, Kuto/Isabo, and Sapo/Iyana Mortuary, respectively. Kuto/Isabo recorded a higher proportion of motorcycles at 31.8%, surpassing Panseke/Adigbe (31.5%), Sapo-Iyana Mortuary (29%), and Adatan/Asero roads, in descending order (see Fig. 5).
The prevalence of buses is notably higher on Sapo/Iyana Mortuary Road (21.5%) compared to Kuto/Isabo (17.9%), Panseke/Adigbe (15.7%), and Adatan/Asero Roads (14.9%). Adatan/Asero Road experiences a more frequent presence of Lorry/Tippers (9.2%) than Sapo/Iyana Mortuary Road (9%), Panseke/Adigbe Road (9%), and Kuto/Isabo Road (7.7%), in descending order.
Analyzing the distribution of vehicle types throughout the week reveals consistent patterns, but a closer examination (see Fig. 6) exposes notable variations. Specifically, car traffic is relatively higher on Saturdays (43.1%) than on Wednesdays (42.4%) and Mondays (40.3%), possibly due to increased weekend activities leading to greater individual car usage. Motorcycles show a higher prevalence on Wednesdays (30.9%) compared to Mondays (30.5%) and Saturdays (27.9%), suggesting mid-week transportation needs or commuting patterns favoring motorcycles. Buses are more abundant on Saturdays (19.9%) than on Mondays (19.3%) and Wednesdays (17.3%), possibly reflecting heightened demand for public transportation during weekends, particularly for leisure activities. Conversely, there is minimal variation in the presence of Lorry/Tippers on Monday (9.8%), Wednesday (9.4%), and Saturday (9.1%), indicating a consistent presence throughout the week, potentially linked to commercial or industrial activities.
The elevated counts of cars and buses on Saturday were anticipated, as it is a day traditionally designated for errands, shopping, and recreation. Residents, particularly those in two-income families with constrained schedules during weekdays, utilize Saturdays for shopping, running errands, social visits, and recreational activities.
Despite observed variations in traffic composition, ANOVA results indicate that, with f = 3.3106 and p = 1.0000, there is no significant variance in traffic composition across the surveyed roads (refer to Table 4).
Table 4
ANOVA: Traffic Composition in the studied Road corridors
| ANOVA | | | | | | |
| Source of Variation | SS | df | MS | F | P-value | F crit |
| Between Groups | 0.0025 | 3 | 0.000833 | 3.3106 | 1.0000 | 3.490295 |
| Within Groups | 3020.011 | 12 | 251.6676 | | | |
| Total | 3020.013 | 15 | | | | |
Traffic Capacity of the Studied Roads
The computed Passenger Car Unit (PCU) for the selected road corridors, outlined in Table 5, results in the following traffic capacities: Adatan/Asero road corridor − 2375 PCU/hr; Panseke/Adigbe − 2325 PCU/hr; Kuto/Isabo − 2957 PCU/hr; and Sapo/Iyana Mortuary − 4389 PCU/hr. Notably, Sapo/Iyana Mortuary boasts the highest traffic capacity, closely followed by Kuto/Isabo road. Adatan/Asero and Panseke/Adigbe roads follow in descending order.
Table 5
Passengers Car Unit Equivalent (PCUE) of Traffic Volume in the Road Corridors
| Vehicle Type | PCUE | A (PCUE) | B (PCUE) | C (PCUE) | D (PCUE) | Total (PCUE) | PCUE/hour |
| Motorcycle | 0.75 | 1314 | 1929 | 2450 | 3021 | 8714 | 1452 |
| Car | 1 | 4200 | 3588 | 4394 | 5594 | 17776 | 2963 |
| Bus | 4 | 4792 | 5120 | 7352 | 11968 | 29232 | 4872 |
| Lorry/Tipper | 4.5 | 3942 | 3312 | 3546 | 5751 | 16551 | 2759 |
| Total | 14248 | 13949 | 17742 | 26334 | 72273 | 12045 |
| PCUE/hour | 2375 | 2325 | 2957 | 4389 | 12045 | |
| Note: A = Adatan/Asero, B = Panseke/Adigbe, C = Kuto/Isabo, D = Sapo/Iyana Mortuary |
Examining the table, it is noteworthy that buses, with a capacity of 4872 Passenger Car Units per hour (PCU/hr), significantly contribute to the traffic load on the selected roads. This is followed by cars (2963 PCU/hr), lorries/tippers (2759 PCU/hr), and motorcycles (1452 PCU/hr). The data implies that motorcycles have the least impact on the traffic dynamics of the studied road corridors.
While buses exert substantial influence on the roads, it is crucial to acknowledge that they accommodate more passengers compared to other vehicle types. Consequently, buses contribute to less congestion than private cars, especially when they carry more than 4.5 passengers on average. Therefore, enhancing the proportion of buses in the multimodal travel mix could potentially alleviate congestion.
Level of Service (LOS) of the Studied Roads
Road capacity signifies the maximum flow rate under specific Level of Service (LOS) conditions, accounting for prevailing roadway and traffic conditions. LOS serves as a qualitative measure encompassing factors like speed, travel time, maneuverability, convenience, comfort, safety, and traffic disruptions (Gajjar & Mohandas, 2016). The Volume/Capacity Ratio (V/C ratio) emerges as the most precise predictor of congestion and LOS, with higher ratios indicating greater congestion. Table 6 displays the V/C ratio and associated LOS indicator values across different scenarios.
Table 6
| Level of service (LOS) | Volume/Capacity Ratio (V/C) | Level of comfort | Nature of flow |
| A | < 0.30 | Highest | Free Flow |
| B | 0.30–0.50 | | Reasonably free flow |
| C | 0.50–0.70 | | Stable flow |
| D | 0.70–0.90 | Threshold | Approaching unstable flow |
| E | 1.00 | | unstable |
| F | > 1.00 | Lowest | Forced flow |
Source: adapted from Gajjar and Mohandas, 2016.
The Volume/Capacity ratio was computed by comparing the traffic volume with the specified traffic capacity, as outlined in IRC 106:1990, to assess the Level of Service for the Roads. The volume capacity ratios for the studied roads are as follows: Adatan/Asero (1.25), Panseke/Adigbe (1.22), Kuto/Isabo (1.56), and Sapo/Iyana Mortuary (1.51).
Table 7
Level of service in Selected Road Corridors
| SN | Road Corridors | Description | Derived Traffic capacity in PCUE/hr | Recommended Capacity (IRC 106:1990) | Volume Capacity Ratio | Level of Service |
| 1 | Adatan-Car-wash-Asero | 2-lane (one way) | 2375 | 1900 | 1.25 | F |
| 2 | Panseke-Adigbe | 2-lane (one way) | 2325 | 1900 | 1.22 | F |
| 3 | Kuto-Isabo | 2-lane (one way) | 2957 | 1900 | 1.56 | F |
| 4 | Sapo-Ijaye-Iyana Mortuary | 4-lane divided (Two way) | 4389 | 2900 | 1.51 | F |
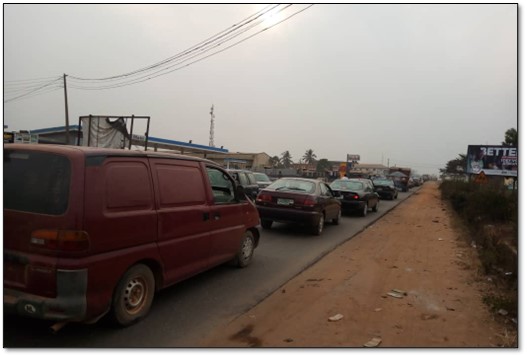
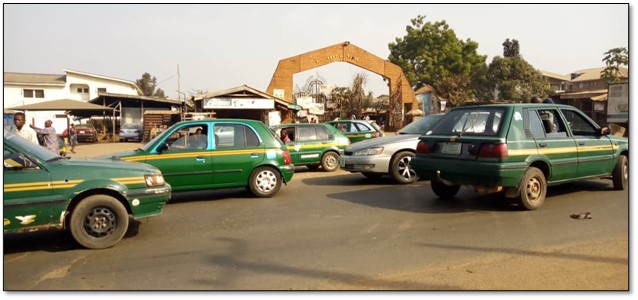
Nevertheless, referring to Table 7, the level of service for all the studied roads is categorized as F, signifying forced flow. At this level, forced operations occur at low speeds, leading to volumes below capacity. Congestion can result in notable decreases in speed and occasional or extended stoppages. In extreme cases, both speed and volume may be reduced to zero. These conditions characterize the traffic situations on the selected roads, as illustrated in Plate 1 and 2.
Plate 1: Traffic standstill at Panseke- Adigbe Road
Plate 2: Traffic Congestion at Adatan-Asero Road
The forced flow of traffic on all the studied roads, as indicated by the LOS of F, suggests an overextended usage of the roads beyond the recommended capacity. Table 8 displays the percentage difference between the derived capacity and the recommended capacity. It is evident from the table that the existing peak-hour volume for all roadways surpasses the IRC recommended capacity.
Table 8
Capacity of the studied road corridors
| SN | Road Corridors | Description | Derived Traffic Capacity in PCU/hr | Recommended Capacity (IRC 106:1990) | % Difference |
| 1 | Adatan-Car-wash-Asero | 2-lane (one way) | 2375 | 1900 | (+)25 |
| 2 | Panseke-Adigbe | 2-lane (one way) | 2325 | 1900 | (+)22 |
| 3 | Kuto-Isabo | 2-lane (one way) | 2957 | 1900 | (+)56 |
| 4 | Sapo-Ijaye-Iyana Mortuary | 4-lane divided (Two way) | 4389 | 2900 | (+)51 |
The table data reveals that Kuto/Isabo road operates at a capacity 56% beyond the recommended limit, making it the most overstretched among the studied corridors. Sapo/Iyana Mortuary is the second most overstretched, exceeding the recommended capacity by 51%. Adatan/Asero road surpasses the recommended capacity by 25%, and Panseke/Adigbe road operates 22% above the recommended limit. Particularly, Kuto/Isabo and Sapo/Iyana Mortuary, operating well beyond capacity, indicate severe traffic congestion, leading to delays for commuters and potential economic losses. Residents on these roads may face reduced quality of life due to prolonged commutes, stress, and safety concerns. Additionally, overstretched roads contribute to unsafe conditions, increasing the risk of accidents. The extent of capacity beyond the recommended limit correlates with heightened road safety concerns, impacting residents' decisions on housing, business locations, and overall urban satisfaction.
Conclusion and Recommendations
This study brings to the forefront crucial issues within the realm of traffic analysis. Primarily, it underscores the substantial variations in traffic volume during peak hours and across different days of the week. The evening peak registers a higher traffic volume than the morning peak, with Mondays standing out as the day with the heaviest traffic. In response to these findings, the study advocates for the implementation of a road pricing system during rush hours, incentivizing individuals to consider alternative transportation modes and adjust their travel times. This strategic approach aims to alleviate congestion during peak evening hours. Additionally, the study proposes the adoption of flex-time by businesses, allowing employees to work flexible hours, thereby dispersing commuting demand and reducing congestion during specific peak periods. Telecommuting or remote work options are also recommended to curtail the number of commuters on Mondays and during peak evening hours. The synergy of these strategies not only provides commuters with diverse choices but also diminishes overall demand on the road network during critical times. Effective implementation requires close collaboration with businesses, local authorities, and the community, taking into account unique circumstances and needs.
The second key issue revolves around the composition of traffic, revealing a significant influx of single-occupant cars in the study area. This finding attributes traffic congestion to individuals' strong inclination toward driving. To address this, a multifaceted approach is recommended, encompassing policies, infrastructure enhancements, and behavioral changes. The urban authority is urged to restrict the circulation of private cars during specific periods and in designated areas, promote and facilitate carpooling and ridesharing programs, and enhance the public transportation system by introducing high-capacity buses. Awareness campaigns about the environmental and health impacts of excessive car use are essential, emphasizing the benefits of alternative transportation modes and the long-term consequences of heavy reliance on private cars.
The third critical issue pertains to the traffic volume-to-capacity ratio, revealing that all studied roads, especially Adatan-Car Wash to Asero and Panseke to Adigbe, have exceeded their carrying capacities. Urgent infrastructural development is recommended, calling for road expansion and dualization to accommodate escalating traffic volumes in these corridors. Optimizing intersection and roundabout designs, particularly at Adatan and Ijaye, is crucial for ensuring smoother traffic flow.
As an overarching recommendation, the urban authority is urged to embrace and invest in intelligent transportation systems, which represent a holistic approach to modernizing urban mobility. Additionally, the study advocates for the establishment of alternative traffic routes, such as rail lines, to facilitate the movement of heavy-duty trucks and alleviate the strain on existing road networks. This multifaceted strategy aims not only to address immediate congestion concerns but also to lay the groundwork for a sustainable and efficient urban transportation infrastructure.
Funding Declaration