Clinical signs of LSD in infected cattle
The animals exhibited an increase in body temperature of 40 to 41.5°C, excessive tearing, a decrease in milk production, anorexia, a loss of weight, and various stages of firm skin nodules all over the body of the infected animals. They were raised, circumscribed, firm, and accompanied by swelling of the superficial lymph nodes. as shown in Table 3, Figs. 1 and 2. The different stages of lumpy skin disease (LSD) in cattle with characteristic skin nodules. Figure 2 (a) shows that in the early stages of LSD, the cow developed small, raised nodules on its skin. Figure 2 (b) shows that in later stages of LSD, the cow may develop larger, more widespread nodules. These nodules may be up to 5 centimeters in diameter and may be very painful. Figure 2 (c) shows that in severe cases, the cow develops edema or swelling in its dewlaps. Figure 2 (d) shows the severity of the illness: Cows may develop severe edema in dewlaps with ulceration of the hoof.
Table 3
Collection of Ticks from Cattle and Buffaloes with or without Clinical Signs of Lumpy Skin Disease (LSD) or Widespread Lumpy Skin Disease (WLSD) in Different Locations or Governorates.
| Location or Governorates | T | Cattle | T | Buffaloes | T | Ticks from cattle | T | Ticks from buffaloes |
| LSD | WLSD | LSD | WLSD | LSD | WLSD | LSD | WLSD |
| Beni-suef | 20 | 6 | 14 | 5 | 2 | 2 | 25 | 15 | 10 | 11 | 5 | 6 |
| El Fayoum | 15 | 5 | 10 | 10 | 3 | 7 | 17 | 12 | 5 | 10 | 4 | 6 |
| Giza | 13 | 5 | 8 | 10 | 4 | 6 | 18 | 13 | 5 | 4 | 4 | - |
| Monefia | 3 | 2 | 1 | 2 | 1 | 1 | 13 | 10 | 3 | 6 | 6 | - |
| Sharqiya | 16 | 7 | 9 | 7 | 3 | 4 | 13 | 3 | 10 | 3 | 3 | - |
| Marsa Matrouh | 3 | 2 | 1 | 2 | 1 | 1 | 6 | 6 | - | 6 | 2 | 4 |
| Gharbiya | 14 | 3 | 11 | 9 | 4 | 4 | 9 | 5 | 4 | 4 | 4 | - |
| Total | 84 | 30 | 54 | 45 | 18 | 25 | 101 | 64 | 37 | 44 | 28 | 16 |
| T: total number of cattle or buffaloes, LSD: Lumpy Skin Disease, WLSD: without any Lumpy Skin Disease signs |
Identification of tick species
Figure 3 shows ticks collected from different animals (cattle and buffaloes) with or without LSD clinical signs. Morphological identification revealed that they belonged to R. (Boophilus) annulatus, the most prevalent tick species on both cattle and buffaloes. Their dorsal shield (scutum) and forward-protruding mouthparts (capitulum) were observed from above. Those belonging to the Boophilus subgenus exhibit a hexagonal basis capitulum, with rounded or oval spiracular plates and very short, compressed palps featuring dorsal and lateral ridges. Male hard ticks possess adanal shields and accessory shields, while females typically lack a distinct anal groove, which is faintly present in males. There are no evident festoons or ornamentation.
Table 4 presented the results of the detection of LSDV antibodies and LSDV-DNA in cattle and buffalos' sera, as well as whole blood samples, using EP-ELISA and PCR across different governorates of Egypt. Out of 84 sera samples, 46 (54.8%) tested positive for LSDV antibodies by EP-ELISA in both vaccinated and non-vaccinated cattle. While, PCR detected LSDV-DNA in 30 out of 84 (35.7%) whole blood samples obtained from cattle. In the case of buffaloes, antibodies against LSDV were 15 positives out of 45 (33.3%) detected by EP-ELISA. Additionally, PCR identified LSDV-DNA in 5 out of 45 (11.1%) buffaloes.
Table 4
LSDV Detection in Blood Samples from Examined Animals Using End-Point ELISA and PCR for identification of LSDV antibodies in serum and LSDV-DNA from cattle and buffaloes across Egypt. Cattle exhibited positive results for LSDV antibodies through EP-ELISA were 54.8%, and 35.7% positive by PCR. Similarly, buffaloes positive for LSDV antibodies using EP-ELISA were 33.3 and 11.11% tested positive by PCR
| Governorates | Cattle | Buffalos |
| Total No | Indirect EP-ELISA sera | PCR whole blood EDTA | Total No | Indirect EP-ELISA sera | PCR whole blood EDTA |
| +ve | % | + | % | +ve | % | +ve | % |
| Beni-suef | 20 | 12 | 60 | 5 | 25 | 5 | 2 | 40 | 1 | 20 |
| El Fayoum | 15 | 8 | 53.3 | 7 | 46.6 | 10 | 2 | 20 | 1 | 10 |
| Giza | 13 | 6 | 46.1 | 3 | 7.6 | 10 | 3 | 30 | 1 | 33.3 |
| Monefia | 6 | 2 | 33.3 | 2 | 33.3 | 2 | - | - | - | - |
| Sharqiya | 16 | 9 | 56.2 | 9 | 37.5 | 7 | 3 | 42.8 | 1 | 14.28 |
| Marsa Matrouh | 5 | 3 | 60 | 1 | 33.3 | 2 | - | 1- | - | - |
| Gharbiya | 10 | 6 | 60 | 5 | 21.4 | 9 | 5 | 55.5 | 1 | 11.11 |
| Total | 84 | 46 | 54.8 | 30 | 23.2 | 45 | 15 | 33.3 | 5 | 11.11 |
| EP-ELISA: End point - Enzyme-Linked Immunosorbent Assay; PCR: Polymerase Chain Reaction |
The highlight variations in LSDV prevalence across different governorates, with the highest percentage of active LSDV infections found in El-Fayoum (46.6%), followed by Sharqiya (37.5%), and Monefia (33.3%). Conversely, the lowest percentage of LSDV-positive samples was observed in Giza (7.6%). The results showed that cattle are more likely to test positive for LSDV compared to buffaloes.
Virus isolations
Isolation of LSDV from tick samples and inoculation into SPF ECE, as shown in Fig. 3 three pools each (3 to 5 ticks) of collected different ticks’ stages (adults and nymphs) from clinically suspected LSDV-infected cattle gave a positive result in RT-qPCR. By the third passage, three pooled samples were found to be positive out of 29 pooled samples. Harvested CAM showed pock lesions and thickening of the membrane, as shown in Figs. 4a–f. The pock lesions in Figs. 4b are likely caused by the virus destroying the cells of the CAM.
Characterization of an isolated virus and virus detection
Multiplex PCR
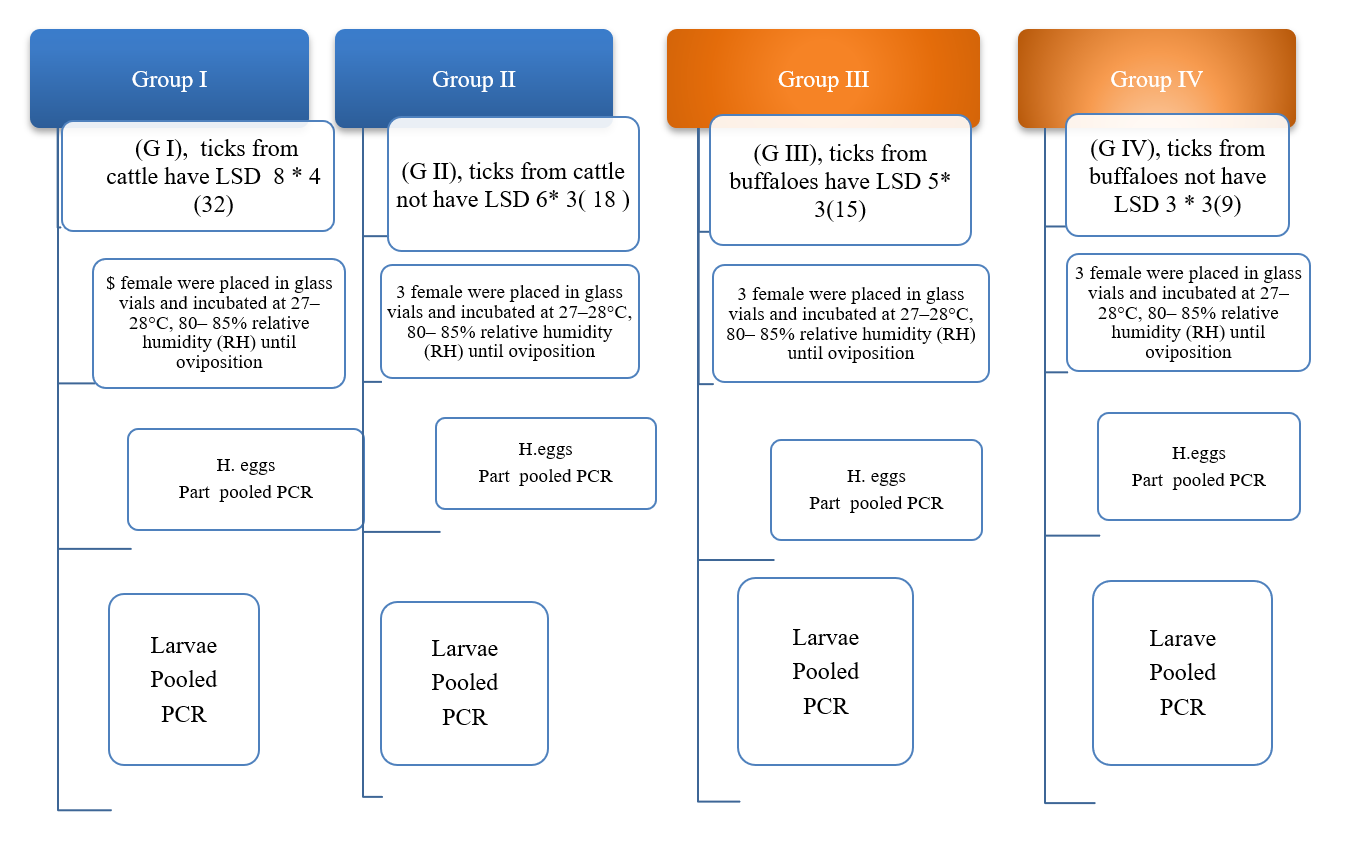
Multiplex PCR for amplified products of LSDV isolated from skin biopsy, blood, and tick samples using unique primers for P32, VP32, G protein, and viral fusion protein genes is shown in Fig. 5. Lane M: marker with molecular weight marker (3000 bp), Fig. 5 (a) Multiplex PCR for amplified products of LSDV isolated from skin biopsy, blood, and ticks' samples using unique primers for P32, VP32, G protein, and viral fusion protein genes. Lane M: marker with molecular weight marker (3000 bp), Lane 2, 3, 11, 15, 16, 17, 18, and 19; negative results Lane 4: Positive 192 bp; Lanes 6, 8, 10, 12, and 13: Positive at 192 bp, 412 bp, and 554 bp Lane 9: Fint positive. Lane 1C-: negative control; Lane 5C+: positive control for LSDV. Figure 5 (b) Multiplex PCR for amplified products of LSDV isolated from skin biopsy, blood, and ticks' samples using unique primers for P32, VP32, G protein, and viral fusion protein genes. Lane M: marker with molecular weight marker (3000 bp); Lane 5 and 12 positive results at 412 bp Lane 1, 2, 3, 4, 6, 7, 9, 11, 12, 13, 14, and 15 positives at 192 bp Lane 1C-: negative control; Lane 5C+: positive control for LSDV. Figure 5 (c). Multiplex PCR for amplified products of LSDV isolated from skin biopsy, blood, and ticks' samples using unique primers for P32, VP32, G protein, and viral fusion protein genes. Lane M: marker with molecular weight marker (3000 bp); Lane 2, 3, 6, 8, 9, 12, 13, 14, 15, 16, 17, and 18 positives at 192 bp; Lanes 12 and 14: positive at 192 bp, 412 bp, and 554 bp Lane 9: Fint positive, Lane 1, 4, 5, 6, 8, 10, 11, and 19 negative results Table 5 shows positive detections of LSDV-DNA in ticks from cattle and buffaloes and non-LSD samples across various stages of ticks (adults, nymphs, eggs, and larvae) concerning transmission of LSDV through different stages. The positive rates of engorged female and nymph ticks from cattle with or without LSD and the numbers of eggs and larvae collected from both LSD-infected and non-LSD-infected cattle provide insight into the detection rates of LSDV in different stages of ticking under varying conditions as shown in Table 5 .
Table 5 Detection of LSDV in ticks’ samples collected from different animals by rt-qPCR and PCR. Detections of LSDV-DNA in ticks, from cattle and buffaloes and non-LSD samples through different stages of ticks (adults, nymphs, eggs, and larvae). The positive rates of engorged female and nymph ticks from cattle with or without LSD, and the numbers of eggs and larvae from both collected ticks of LSD-infected and non-LSD-infected cattle and buffaloes
|
Groups of Ticks
|
Detection LSDV-DNA in ticks by
|
PCR detected LSDV-DNA in ticks collected from
|
rt-qPCR Syber Green based detected LSDV-DNA in ticks collected from
|
|
T. Cattle
|
|
T. Buffaloes
|
T. Cattle
|
T. Buffaloes
|
|
+ve
|
+ve
|
+ve
|
+ve
|
|
Ticks Adults and nymph
|
LSD 8 pools *
|
5
|
+
|
5 GPs
|
2
|
+
|
7
|
+
|
2
|
+
|
|
Non-LSD 6 pools**
|
3
|
+
|
3 GPs
|
1
|
+
|
5
|
+
|
1
|
+
|
|
Eggs
|
LSD 8 ***
|
5
|
+
|
5 GPs
|
2
|
+
|
7
|
+
|
2
|
+
|
|
Non-LSD 6****
|
3
|
+
|
3 GPs
|
1
|
+
|
5
|
+
|
1
|
+
|
|
Larvae
|
LSD 8*****
|
5
|
+
|
5 GPs
|
2
|
+
|
7
|
+
|
2
|
+
|
|
Non-LSD 6*****
|
3
|
+
|
3 GPs
|
1
|
+
|
5
|
+
|
1
|
+
|
Real-time quantitative PCR (RT-qPCR)
Detection of LSDV from suspected animal samples in different governorates in Egypt by RT-qPCR. The results revealed varied percentages of LSDV-positive samples across different regions The results showed that the percentage of LSDV-positive samples was in El- (Fayoum (46.6%), followed by Sharqiya (37.5%) and Monefia (33.3%) of blood samples. The lowest percentage of LSDV-positive samples was in Gharbiya (21.4%).. In total, 30 cattle skin biopsy samples were tested by RT-qPCR, of which 15 were positive for LSDV (50%). Only five blood samples from buffaloes were positive for LSDV 11.11%). The Ct values in the table can be used to estimate the amount of LSDV DNA in the samples as shown in Table 6.
Table 6
Detection of LSDV from suspected animal samples by molecular assays (rt-qPCR and PCR), the highest percentage of LSDV-positive samples was in El Fayoum (46.6%). The Ct values in this study range from 10 to 36.5 proved that the amount of LSDV DNA in the samples varied.
| Governorates | Whole blood | Nasal samples | Skin biopsy | PCR detected LSDV_DNA from different samples | rt-qPC detected LSDV-DNA from different samples |
| Whole blood | Nasal samples | Skin biopsy | Whole blood | Nasal samples | Skin biopsy |
| + | % | + | % | + | % | + | % | + | % | + | % |
| Beni-suef | 20 | 10 | 6 | 5 | 25 | 2 | 20 | 2 | 33.3 | 8 | 40 | 3 | 30 | 4 | 66.6 |
| El Fayoum | 15 | 15 | 5 | 7 | 46.6 | 2 | 13.3 | 1 | 50 | 7 | 46.6 | 3 | 20 | 1 | 50 |
| Giza | 13 | 10 | 5 | 3 | 7.6 | 1 | 16.6 | 2 | 33.3 | 3 | 7.6 | 1 | 16.6 | 2 | 40 |
| Monefia | 3 | 3 | 2 | 2 | 33.3 | - | | 3 | 75 | 2 | 33.3 | - | | 3 | 75 |
| Sharqiya | 16 | 16 | 7 | 9 | 37.5 | 3 | 18.75 | 3 | 42 | 9 | 37.5 | 3 | 18.75 | 3 | 42. |
| Marsa Matrouh | 3 | 2 | 2 | 1 | 33.3 | - | | 1 | 33.3 | 1 | 33.3 | - | | 1 | 33.3 |
| Gharbiya | 14 | 14 | 3 | 5 | 21.4 | 2 | 14.28 | 3 | 75 | 5 | 21.4 | 2 | 14.28 | 3 | 75 |
| Total | 84 | 70 | 30 | 30 | 23.2 | 10 | 14.2 | 15 | 50 | 35 | 42.6 | 12 | 17.1 | 17 | 56.6 |
Ct-Value
The lower the Ct value, the more LSDV DNA is present in the sample. The Ct values in this study ranged from 10 to 36.5, suggesting that the amount of LSDV DNA in the samples varied, as shown in Table 6 Syber green that showed fluorescence development over time (graph generated by ES Equant tube scanner software) for detection of LSDV-DNA in skin tissue biopsy of infected cattle and buffaloes; Fig. 5b: Detection of LSDV-DNA in blood and nasal swabs showed different results. The RT-qPCR amplification plot with Syber Green A green dye showed positive results with the positive control of the sheeppox virus vaccine. Figure 5c: rt-q PCR amplification plot of tick samples and LSDV isolated on CAM were compared with the positive control of Neethling virus. Figure 5d rt-q PCR amplification plot with TaqMan probe for detection of LSDV-DNA in skin biopsies and tick samples compared with control positive and other results from rt-q PCR Syber Green. The Ct value of biopsy samples (red square) was the highest, followed by swab samples (gray triangle). While the Ct value of the blood sample (blue diamond shape) was similar to that of biopsy samples and other types of samples, Ct values spanned a range from 10.4 to 36.6, indicating variations in viral DNA abundance across samples. The outcomes of this investigation suggest that biopsy samples serve as the most reliable source of LSDV-DNA. Nonetheless, swab samples and blood samples can also be employed for detection. It is evident from the Ct values in this study that the quantity of LSDV-DNA within a given sample is subject to fluctuations based on the sample type and the severity of the infection, as shown in Fig. 8. The Ct values in the table can be used to estimate the amount of LSDV DNA in the samples. The lower the Ct value, the more LSDV DNA is present in the sample. The Ct values in this study range from 10 to 36.5, proving that the amount of LSDV DNA in the samples varied.