3.1 rGO@HCF composite membranes
As depicted in Fig. 1, rGO@HCF composite films were fabricated employing a vacuum-assisted filtration method. The WC samples were meticulously purified and subsequently subjected to a NaClO2 treatment aimed to remove lignin, conducted at 80°C for a duration of 2 hours15, 32. Post preparation, the WC suspensions were amalgamated with GO solution and thoroughly homogenized within an anhydrous ethanol medium. The resulting mixture was then subjected to vacuum filtration and a carbonization process at an elevated temperature of 900°C under an inert nitrogen atmosphere for 2 hours. According to the references33–34, GO would partially transform into reduced graphene oxide (rGO) at high temperatures. Figure 2 presents a comparative analysis of the surface morphology and microstructure between HCF and rGO@HCFs composites. HCF exhibits a typically hollow tubular fiber architecture (Figs. 2a1, a2) adorned with intermittent, low-amplitude, wave-like ridges (Fig. 2a3). These characteristics are consistent with the results of prior investigations15, 35–36. Utilizing a strategic combination of blending and heat treatment, GO has been successfully enwrapped on the HCF surface, as illustrated in Figs. 2b2 and c2. As shown in Fig. 2c3, it is exciting that regular wave-like, undulatory folding microstructures form on the surface of hollow carbon fibers. Notably, the intensity of these microstructures is accentuated with the incremental addition of GO (Figs. 2b3 and c3). The genesis of these regular wavy folds likely stems from the adsorptive interaction between GO and WC during the formation of a homogenized suspension, with subsequent GO deployment on the WC hollow fibers surface. High-temperature carbonization induces a differential shrinkage between WC and rGO. Additionally, there is noted that evidence of GO did not completely conform to the surface wrapping of HCF (Fig. 2c1), but instead intermingled with rGO@HCF, serving to bridge and interconnect the rGO@HCF fibers.
Table 1
Surface element content of rGO@HCF composite membrane
|
Sample
|
Elements/weight%
|
|
C
|
O
|
N
|
|
HCF
|
86.88
|
10.92
|
2.20
|
|
rGO@HCF0.03
|
81.07
|
17.90
|
1.03
|
|
rGO@HCF0.06
|
80.16
|
19.36
|
0.48
|
As delineated in Table 1, the elemental compositions on the surface of three kinds of evaporator are quantified, revealing that the oxygen content in pristine HCF is registered at 10.92 wt%. This metric notably ascends to 19.36 wt% on the rGO@HCF0.06 surface. Wrapped rGO on the HCF has greatly increased the content of oxygen-containing functional groups. The increase of oxygen-containing functional groups will have a beneficial effect on the hydrophilicity of the prepared evaporator, ensuring sufficient supply of interface water during the water vapor production process. The wettability characteristics of the evaporators are captured in Figs. 3b, c, and d. Pristine HCF exhibits pronounced hydrophobicity, which water droplet kept a contact angle of 120° even post 650 seconds. Conversely, the rGO@HCF composites showcase exceptional super-hydrophilic behavior; for instance, a droplet rapidly disperses across the rGO@HCF0.03 sample surface within a mere 0.625 seconds, while contact instigates instantaneous spreading on the rGO@HCF0.06 sample. Such hydrophilic tendencies are in concordance with the increment of oxygen-containing functional groups on the surface of rGO@HCF.
The innovatively engineered wave-like and creased micro-to-nanostructures furnish a conducive platform for multifaceted light reflection, thereby amplifying the light absorption efficacy and photothermal transduction proficiency of the evaporator. A comprehensive evaluation, utilizing a UV-vis-NIR spectrophotometer, was conducted to investigate the solar light capture performance of rGO@HCF. As exhibited in Fig. 3a, light absorption for unmodified HCF is only 65.55% over the extensive UV-vis-NIR spectrum (250–2500 nm). A notable surge is observed when rGO loading varies from 0.03 wt% to 0.06 wt% within the composite, catapulting light absorption increase from 84.22% to a remarkable 90.86%. This corresponds to HCF absorptive gains of 28.5% and 36.6%, respectively. Consequently, the rGO-enriched, wave-like surface topology markedly bolsters the light absorption capabilities of the evaporators, which would enhance the water evaporation rate of the resulting evaporators.
3.2 Photo‑to‑thermal conversion properties of the rGO@HCFs
For comprehensive assessment of the photothermal conversion efficacy of the rGO@HCF evaporators, an infrared thermal imager was employed to record the surface temperature during the one sun irradiation (1 kW m− 2) for the dry and wet samples. The corresponding results are elucidated in Figs. 4 and 5. As illustrated in Fig. 4, the dry surface temperature of the dry rGO@HCF0.06 was swiftly ascended from ambient temperature (23.3 ℃) to 78.3 ℃ within the first minute, with a value higher than that of HCF and rGO@HCF0.03 13.2 ℃ and 6.0 ℃ respectively; in the next 4 minutes, the temperature of the dry rGO@HCF0.06 further rise to 103.2 ℃, which is also higher than that of HCF and rGO@HCF0.03 5.9 ℃ and 2.9 ℃ respectively. Advancing over a span of 55 minutes, the dry surface temperature of rGO@HCF0.06 continued to escalate gradually, stabilizing ultimately at 119.1 ℃, which is markedly superior to HCF and rGO@HCF0.03 by differentials of 8.8 ℃ and 4.1 ℃, respectively. The above results indicate that with the increase of wavy wrinkled rGO on the surface of HCF, the photothermal conversion performance of the material gradually enhances, and the trend of the photothermal conversion performance is consistent with its light absorption performance (Fig. 3a).
It is necessary to investigate the photothermal conversion performance of the wetted samples owing to its wetted by water when used as an evaporator. The results indicate that the photothermal conversion performance in the wet state is consistent with that in the dry state. For example, under one sun irradiation, the temperature of the wet surface of rGO@HCF0.06 quickly rises from room temperature to 43.6°C within 3 minutes, which is 5.7°C and 6.1°C higher than that of HCF and [email protected], respectively; over the next 7 minutes, the wet surface temperature of rGO@HCF0.06 rapidly increases to 65.2°C, which is 16.5°C and 13.9°C higher than that of HCF and rGO@HCF0.03, respectively; in the subsequent 50 minutes, the wet surface temperature of rGO@HCF0.06 slowly rises to 69.5°C, and the final stable wet surface temperature of rGO@HCF0.06 is 17.5°C and 10.8°C higher than that of HCF and [email protected], respectively. The above results suggest that with the increase of the wavy-like rGO folds on the HCF surface, the photothermal conversion performance of rGO@HCF gradually enhances during operation, which is consistent with the trend in its light absorption capability (Fig. 3a) and the temperature change in the dry state. Additionally, by comparing Figs. 4 and 5, it is found that when rGO@HCF is at work, its surface temperature is significantly lower than the surface temperature in the dry state, which may be due to the additional heat uptake necessitated by the phase transition of water from liquid to vapor at the rGO@HCF surface during working.
3.3 Efficacy of Water Vapor Generation in rGO@HCF Composite Membranes
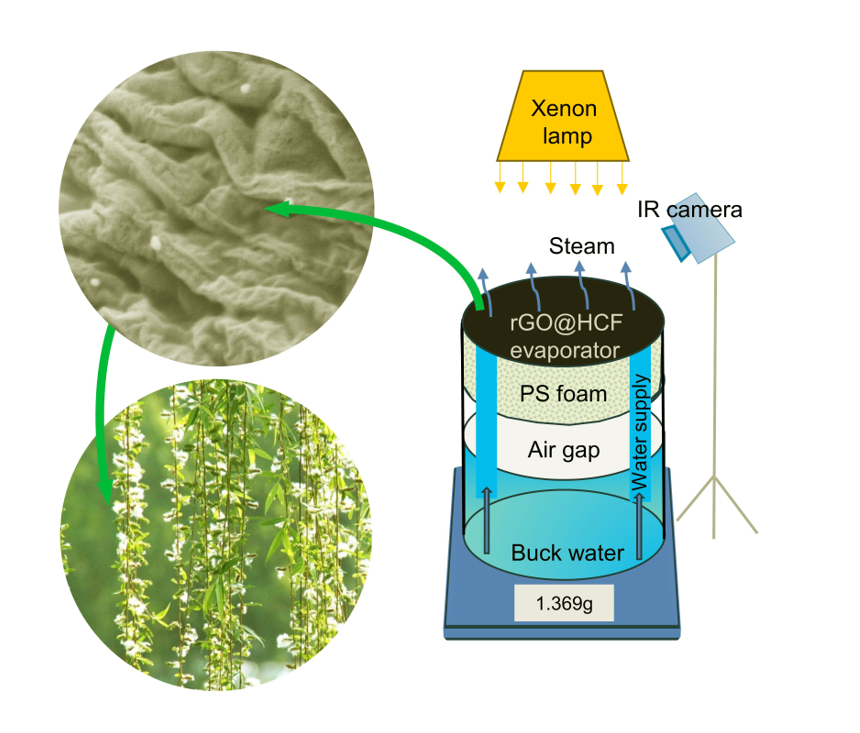
Assessment of the rGO@HCFs capacity for solar driven water steam generation was evaluated by a home-made experimental apparatus, under ambient conditions (23 ± 2 ℃). As presented in Fig. 6a, rGO@HCF samples were placed on a round PS foam wrapped in a cotton cloth, with an air gap of approximately 3 cm between the bottom of the PS and the water surface for avoiding heat loss caused by heating the body water. The cotton cloth was extended into the water to provide sufficient water for evaporation by rGO@HCF; mass changes were recorded by a computer connected -electronic balance, and all indoor tests were completed under one sun irradiation (1 kW m− 2). The mass change of water in the evaporator is shown in Fig. 6d. Within one hour, the mass reduction per square meter for the evaporator equipped with HCF was 2.01 kg. However, for evaporators equipped with rGO@HCF0.03 and rGO@HCF0.06, the mass reduction was 2.45 kg and 3.14 kg for per square meter, respectively. Compared to the HCF based evaporator, the vapor production performance increased by 21.9% and 56.2%, respectively. Clearly, the vapor production performance of the rGO@HCF based evaporators is significantly better than that of the HCF based evaporator.
In order to more intuitively evaluate the relationship between the water vapor production rate of the prepared evaporators and the illumination time, the average evaporation rate of the evaporator is calculated at 5-minute intervals. The calculated evaporation rate varies with illumination time are shown in Fig. 6e. The evaporation rates of HCF, rGO@HCF0.03, and rGO@HCF0.06 evaporators quickly reached 1.97 kg m− 2 h− 1, 2.19 kg m− 2 h− 1, and 2.74 kg m− 2 h− 1 respectively within the first 10 minutes. In the following 50 minutes; the evaporation rates of HCF, rGO@HCF0.03, and rGO@HCF0.06 further increased to 2.14 kg m− 2 h− 1, 2.67 kg m− 2 h− 1, 3.42 kg m− 2 h− 1 and reached a stable evaporating rate. Obviously, the evaporation rate of rGO@HCF based evaporators is much greater than that of HCF evaporators, and the evaporation rate of rGO@HCF evaporators significantly increases with the addition of GO. For better understanding the reasons for the excellent photothermal conversion and energy absorption of rGO@HCF, a simple simulation of the microstructure of the rGO@HCF surface is performed, as shown in Fig. 6b, the captured light will undergo multiple reflections within these wavy folds (Fig. 6c), until it is absorbed and converted into thermal energy, which will heat the interfacial water. Comparing Figs. 5 and Fig. 6e, the increasing trend of the evaporation rate for HCF, rGO@HCF0.03, and rGO@HCF0.06 is consistent with the change in their corresponding wet surface temperatures, indicating that good photothermal conversion performance is the key element for the excellent water vapor production performance of the evaporators.
2.4. Outdoor performance and Durability
Working stability and practical performance are important indicators for solar interfacial evaporators. For this reason, an outdoor test setup was designed, as shown in Fig. 7a. The outdoor tests were conducted at the Xinzhou Teachers University in Xinfu District, Xinzhou City, Shanxi Province, and the water evaporation production performance of the rGO@HCF0.06 evaporator for deionized water and Yellow Sea seawater was tracked for 20 days, with results shown in Figs. 7b and 7c. As illustrated in Fig. 7b, after treatment by the rGO@HCF0.06, the ion concentrations of Na+, K+, Ca2+, and Mg2+ in Yellow Sea seawater dropped from the original 11779.4 mg L− 1, 472.3 mg L− 1, 439.2 mg L− 1, 1389.9 mg L− 1 to 9.8 mg L− 1, 3.9 mg L− 1, 5.2 mg L− 1, 2.9 mg L− 1, respectively. According to the "Standards for Drinking Water Quality" (GB 5749 − 2006) and the World Health Organization standards, the treated water quality meets the requirements for drinking water37–38. As shown in Fig. 6c, the rGO@HCF0.06 evaporator performed steadily over a continuous 20 days, with the average daily evaporation amount for deionized water and Yellow Sea seawater reaching 21.2 kg m− 2 and 20.3 kg m− 2, respectively, which can meet the drinking water needs of about 10 adults. It should be noted that the daily water production performance of the rGO@HCF0.06 evaporator is affected by sunlight intensity, and generally, the water production of the prepared evaporator increases with the enhancement of light intensity, with a fluctuation in the daily evaporation rate of seawater between 9.5 and 27.8 kg m− 2. According to the above results, the prepared rGO@HCF0.06 evaporator exhibits good solar interfacial evaporation performance and service durability, and these excellent properties are due to the abundance of regularly wavy-like rGO folds on the surface of HCF, which endows rGO@HCF0.06 with good photothermal conversion and hydrophilic properties.