Patient characteristics
A total of 136 TAK patients and 272 common carotid arteries were included in this study. The mean age was 32.72 ± 11.28 years, and the female-to-male ratio was 10.3:1. The mean disease duration was 24 (6–60) months. The common clinical presentations were neck pain (19.6%) and dizziness/headache (16.9%). The median ESR and CRP levels were 31(10–63) mm/h and 7.5 (1.4–32.2) mg/L respectively. According to the 1996 Numano classification[15], type I, IIa, IIb, and V diseases were observed in 54 (39.7%), 11 (8.1%), 15 (11.0), and 56 (41.2%) patients, respectively.
Based on PGA, active and inactive disease were identified in 83 (61.0%) and 53 (39.0%) patients, respectively. No significant difference in sex (p = 0.57) or clinical symptoms of amaurosis or syncope (p = 0.08), and cerebral infarction (p = 0.38) were observed between the groups. Patients with active disease were significantly younger (30.83 ± 10.37 vs. 35.04 ± 11.38 years, p = 0.03), and presented with significantly higher rates of fatigue (13.3% vs. 1.9%, p = 0.02), fever (12.0% vs. 0, p = 0.01), dizziness or headache (25.3% vs. 3.8%, p < 0.01), neck pain (31.3% vs. 1.9%, p < 0.01), and visual impairment (12% vs. 0, p = 0.01). All demographic and clinical data of the included patients were presented in Table 1.
Table 1
Demographic and clinical characteristics of TAK patients
| | Total patients n = 136 | Active n = 83 | Inactive n = 53 | P value |
| Age (year), mean ± SD | 32.72 ± 11.28 | 30.83 ± 10.37 | 35.04 ± 11.38 | 0.03 |
| Female n(%) | 124(91.2) | 77(92.8) | 47(88.7) | 0.57 |
| Disease duration (month), median (q1–q3) | 24(6–60) | 12(4–48) | 48(20–117) | < 0.01 |
| Newly diagnosed n(%) | 60(44.1) | 50(60.2) | 10(18.9) | < 0.01 |
| Clinical symptoms n(%) | | | | |
| Fatigue | 12(8.8) | 11(13.3) | 1(1.9) | 0.02 |
| Fever | 10(7.4) | 10(12.0) | 0 | 0.01 |
| Dizziness/headache | 23(16.9) | 21(25.3) | 2(3.8) | < 0.01 |
| Neck pain | 27(19.9) | 26(31.3) | 1(1.9) | < 0.01 |
| Visual impairment | 10(7.4) | 10(12.0) | 0 | 0.01 |
| Amaurosis/syncope | 9(6.6) | 8(9.6) | 1(1.9) | 0.08 |
| Cerebral infarction | 2(1.5) | 2(2.4) | 0 | 0.38 |
| ESR (mm/h), median(q1–q3) | 31(10–63) | 50(21–84) | 11(6–31) | < 0.01 |
| CRP (mg/L), median(q1–q3) | 7.5(1.4–32.2) | 18.4(4.1–68.1) | 2.2(0.6–7.5) | < 0.01 |
| Ultrasound features |
| | Total CCAs n = 258 | Active n = 162 | Inactive n = 96 | |
| Wall thickness (mm), mean ± SD | 1.95 ± 0.70 | 2.16 ± 0.74 | 1.62 ± 0.44 | < 0.01 |
| Inner diameter (mm), mean ± SD | 4.01 ± 2.41 | 4.25 ± 2.36 | 3.56 ± 2.44 | 0.03 |
| Outer diameter (mm), mean ± SD | 8.33 ± 2.52 | 8.90 ± 2.47 | 7.37 ± 2.35 | < 0.01 |
| Peak flow rate (m/s), mean ± SD | 1.13 ± 0.75 | 1.17 ± 0.69 | 1.08 ± 0.83 | 0.37 |
| RI, mean ± SD | 1.08 ± 0.72 | 1.15 ± 0.76 | 0.96 ± 0.63 | 0.04 |
| Vascular stenosis, n(%) | 145(56.2) | 84(51.9) | 61(63.5) | 0.11 |
| Vascular occlusion, n(%) | 32(12.4) | 13(8.0) | 19(19.8) | 0.01 |
| Low echogenicity, n(%) | 106(41.1) | 89(54.9) | 17(17.7) | < 0.01 |
| Ultrasound score, median(q1–q3) |
| ES | 2(2–4) | 4(2–4) | 2(0–2) | < 0.01 |
| TS | 4(2–5) | 5(3–6) | 2(1–3) | < 0.01 |
| ULTRAS | 6(3–8) | 8(6–10) | 3(2–5) | < 0.01 |
| TAK: Takayasu arteritis; ESR: erythrocyte sedimentation rate; CRP: C-reactive protein; CCA: common carotid artery; RI: resistance index; ES: echo score; TS: thickness score; ULTRAS: ultrasound activity score |
The baseline prednisone doses were 0.8–1 mg/kg/day and 0.1–0.2 mg/kg/day in patients with active and inactive TAK, respectively. Immunosuppressors administered included leflunomide (20 mg/day, p.o.; n = 79), cyclophosphamide (0.5–0.75 g/m2 i.v. every 4 weeks up to a cumulative dose of 6–7 g during induction treatment; n = 9), methotrexate (10–15 mg/week, p.o.; n = 16), mycophenolate mofetil (30 mg/kg/day, p.o.; n = 5), azathioprine (1–1.5 mg/kg/day, p.o.; n = 8), and tocilizumab (8 mg/kg/m2, i.v. every 4 weeks; n = 10). A total of 9 inactive disease patients did not receive pharmacological treatment.
General carotid ultrasound features
Unilateral and bilateral CCA lesions were observed in 14 (10.3%) and 122 (89.7%) patients, respectively. Among the 258 arteries involved, 145 (56.2%) and 32 (12.4%) showed stenosis and occlusion, respectively. The average wall thickness was 1.95 ± 0.70 mm (Table 1).
Active disease patients demonstrated significantly higher wall thickness (2.16 ± 0.74 vs. 1.62 ± 0.44 mm, p < 0.01), inner diameter (4.25 ± 2.36 vs. 3.56 ± 2.44 mm, p = 0.03), outer diameter (8.90 ± 2.47 vs. 7.37 ± 2.35 mm, p < 0.01), and proportion of low echogenicity (54.9% vs. 17.7%, p < 0.01). In contrast, inactive disease patients showed significantly higher proportion of luminal occlusion (19.8% vs. 8.0%, p = 0.01) .
Correlation of carotid ultrasound findings with disease activity at baseline
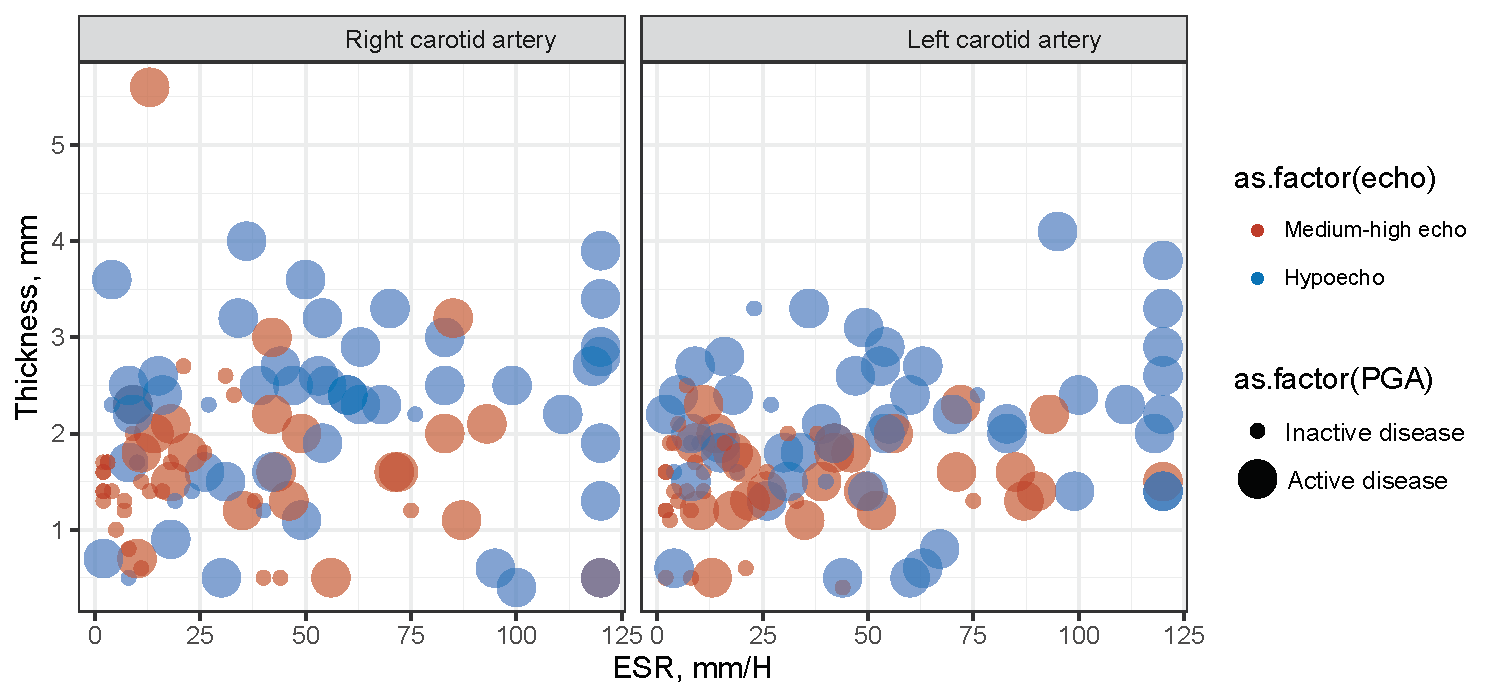
Univariate analysis showed that active disease significantly associated with increased wall thickness (OR = 4.9, 95%CI 2.7–8.9, p < 0.01), outer diameter (OR = 1.29, 95%CI 1.13–1.47, p < 0.01), and low echogenicity (OR = 6.97, 95%CI 3.83–12.71, p < 0.01). Such associations remained significant after adjusting for age, disease duration, neck pain, visual impairment, dizziness or headache, ESR, and CRP (Table 2). In the scatter plot, ESR, wall thickness, and low echogenicity were observed to be significantly higher in active disease patients (Supplementary Figure S1).
Table 2
Association between carotid ultrasonographic parameters and disease activity on logistic regression
| | Unadjusted model | P value | Model 1 | P value |
| Wall thickness | 4.9(2.7, 8.9) | < 0.01 | 3.65(1.85,7.20) | < 0.01 |
| Inner diameter | 1.10(0.99, 1.23) | 0.09 | 1.07(0.93,1.23) | 0.36 |
| Outer diameter | 1.29(1.13, 1.47) | < 0.01 | 1.25(1.06,1.49) | < 0.01 |
| RI | 1.49(0.98, 2.26) | 0.07 | 1.37(0.77,2.46) | 0.28 |
| Vascular occlusion | 0.38(0.18, 0.81) | 0.01 | 0.54(0.19,1.57) | 0.26 |
| Low echogenicity | 6.97(3.83, 12.71) | < 0.01 | 2.49(1.15,5.38) | 0.02 |
| RI: resistance index |
| Model 1: adjusted for age, disease duration, neck pain, visual impairment, dizziness/headache, ESR, and CRP |
Ultrasound activity score and diagnostic accuracy
A median ES and TS of 2 (2–4) and 4 (2–5) were calculated, respectively, obtaining a median ULTRAS of 6 (3–8). The interobserver agreement for ES (κ = 0.80) and TS (κ = 0.89) were both strong. Active TAK showed significantly higher scores in both parameters (Table 1, Fig. 2A–C). In the correlation analysis, ESR significantly associated with wall thickness (r = 0.23, p < 0.01), ES (r = 0.38, p < 0.01), TS (r = 0.29, p < 0.01), and ULTRAS (r = 0.34, p < 0.01) (Supplementary Table S3).
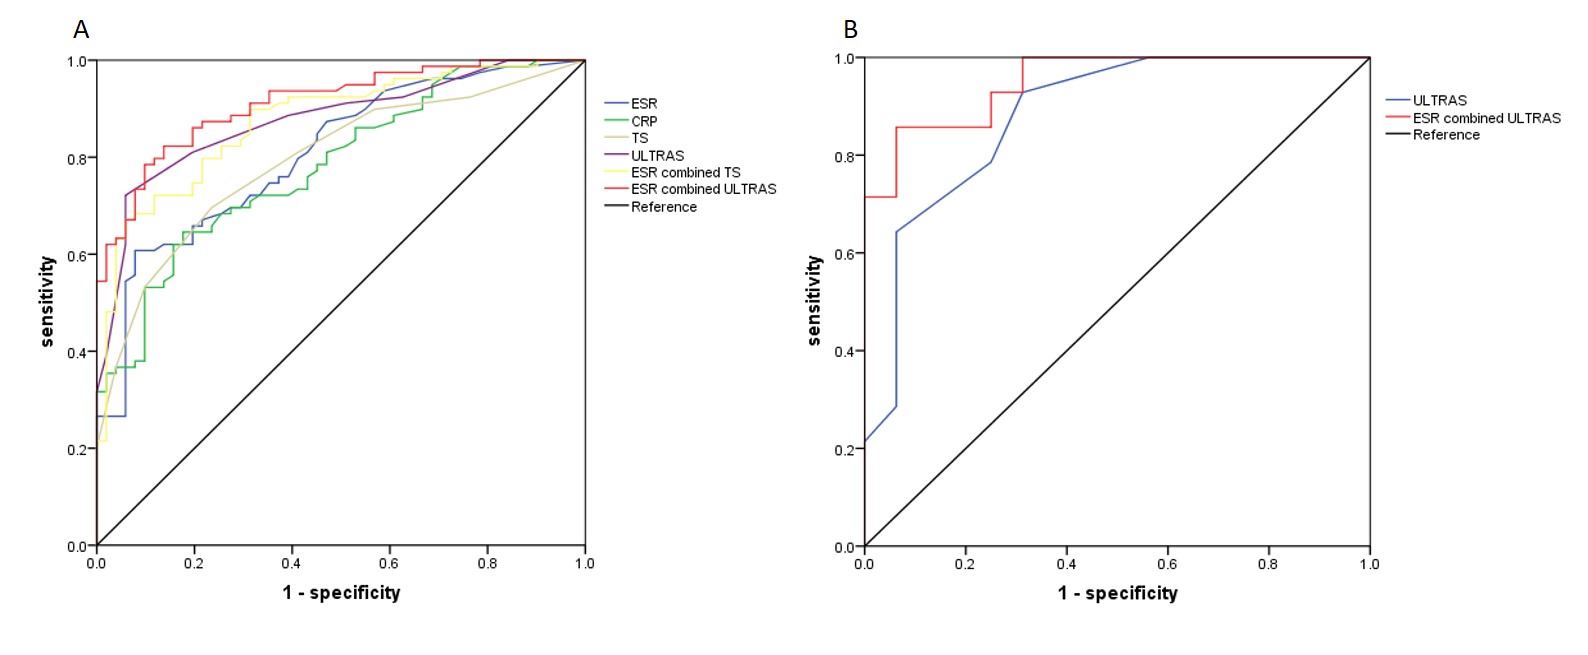
ULTRAS showed better diagnostic accuracy for active TAK compared to TS, with AUCs of 0.88 (95% CI, 82–94) and 0.80 (95% CI, 72–87) observed, respectively (Table 3, Supplementary Figure S2 A). At an optimal cut-off point of 7, the sensitivity and specificity of ULTRAS were 73% (95% CI, 62–82) and 94% (95% CI, 83–98), respectively. Improved diagnostic accuracy was achieved with combination of ULTRAS and ESR in parallel, with an AUC of 0.91 (95% CI, 86–96) and a sensitivity of 89% (95% CI, 80–95). However, the diagnostic performance of ULTRAS in symptomatic patients was poor, with AUC of 0.67 (Fig. 2D–F).
Table 3
Predictive performance of ULTRAS and TS
| | SE | SP | PPV | NPV | +LR | -LR | Accuracy |
| ESR (> 30) | 71(59–80) | 76(62–86) | 86 (70–90) | 63(50–74) | 2.94(1.79–4.81) | 0.39(0.2–0.55) | 73 |
| CRP (> 6.3) | 72(61–81) | 70(56–82) | 79(67–87) | 62(49–74) | 2.43(1.58–3.74) | 0.40(0.28–0.57) | 71 |
| TS (4) | 71(5–80) | 78(64–88) | 83(72–90) | 64(51–75) | 3.18(1.90–5.34) | 0.38(0.27–0.53) | 74 |
| ULTRAS (7) | 73(62–82) | 94(83–98) | 95(86–99) | 69(57–79) | 12.68(4.20–38.34) | 0.28(0.20–0.41) | 82 |
| ESR plus TS | 88(80–95) | 57(43–70) | 76(66–84) | 78(61–89) | 2.09(1.52–2.88) | 0.19(0.10–0.37) | 76 |
| ESR plus ULTRAS | 89(80–95) | 74(60–85) | 84(74–91) | 82(67–91) | 3.43(2.17–5.42) | 0.15(0.08–0.28) | 83 |
| ESR: erythrocyte sedimentation rate; CRP: C-reactive protein; TS: thickness score; ULTRAS: ultrasound activity score; SE: sensitivity; SP: Specificity; PPV: positive predictive value; and NPV: negative predictive value; LR: likelihood ratio |
| SE, SP, PPV, NPV and LR were presented as percentage and 95% CI, while accuracy is presented as percentage only |
In the verification group, the female to male ratio was 5:1, with active disease observed in 14 (46.7%) patients. The clinical characteristics and ultrasound scores were shown in Supplementary Table S4. With an ULTRAS of 7, the sensitivity and specificity for diagnosing active disease were 79% (95% CI, 49–94) and 94% (95% CI, 68–99), respectively, and the AUC was 0.88. Combining of ESR and ULTRAS achieved an increased diagnostic sensitivity and specificity of 93% (95% CI, 64–99) and 81% (95% CI, 54–95), respectively (Supplementary Figure S2 B).
Wall thickness for the prediction of TAK remission and symptom recovery
The results of wall thickness and ultrasonographic scores during follow-up were shown in Table 4. Among the 83 patients with active disease at baseline, 69 (83.1%) demonstrated improvement in clinical symptoms and serology at 3-month follow-up, while 79 (95.2%) showed disease inactivity at 6-month follow-up. Of the 4 patients with active disease at 6 months, 3 associated with persistently elevated acute phase reactants with amaurosis, and 1 with raised ESR and new vascular lesion on MRA.
Table 4
Follow-up ultrasonographic parameters
| | Total patients n = 136 | Disease activity at baseline | | | | Clinical symptoms at baseline | |
| Outcomes | | Active n = 83 | Inactive n = 53 | P value | | | Present n = 56 | Absent n = 80 | P value |
| Improvement rate, n(%) |
| At 3 months | | 69 (83.1%) | / | / | | | 53(94.6%) | / | / |
| At 6 months | | 79 (95.2%) | / | / | | | 53(94.6%) | / | / |
| | n = 79 | n = 53 | | | | n = 53 | n = 80 | |
| Wall thickness (mm), mean(SD) |
| Baseline | 1.95(0.70) | 2.08(0.83) | 1.62(0.44) | < 0.01 | | | 1.88(0.86) | 1.78(0.72) | 0.34 |
| At 3 months | 1.69(0.54) | 1.70(0.59) | 1.62(0.42) | 0.46 | | | 1.66(0.58) | 1.69(0.51) | 0.74 |
| At 6 months | 1.74(0.71) | 1.71(0.72) | 1.63(0.34) | 0.49 | | | 1.61(0.58) | 1.76(0.66) | 0.33 |
| TS, median(q1–q3) |
| Baseline | 4(2–5) | 5(3–6) | 2(1–3) | < 0.01 | | | 4(2–6) | 3(1–5) | 0.04 |
| At 3 months | 2(1–4) | 3(1–5) | 2(1–3) | < 0.01 | | | 2(1–4) | 2(1–4) | 0.40 |
| At 6 months | 2(1–4) | 3(1–4) | 2(1–3) | 0.01 | | | 2(1–4) | 2(1–4) | 0.56 |
| ES, median(q1–q3) |
| Baseline | 2(2–4) | 4(2–4) | 2(0–2) | < 0.01 | | | 4(2–4) | 2(2–4) | < 0.01 |
| At 3 months | 2(1–2) | 2(2–2) | 2(1–2) | 0.04 | | | 2(2–2) | 2(1–2) | 0.18 |
| At 6 months | 2(1–2) | 2(1–2) | 2(1–2) | 0.06 | | | 2(1–2) | 2(1–2) | 0.33 |
| ULTRAS, median(q1–q3) |
| Baseline | 6(3–8) | 8(6–10) | 3(2–5) | < 0.01 | | | 8(5–9) | 5(2–8) | < 0.01 |
| At 3 months | 4(2–6) | 5(3–7) | 3(2–4) | < 0.01 | | | 4(3–7) | 4(2–6) | 0.28 |
| At 6 months | 4(2–6) | 4(2–7) | 4(2–4) | < 0.01 | | | 4(2–6) | 4(2–6) | 0.47 |
| TS: thickness score; ES: echo score; ULTRAS: ultrasound activity score |
Among the 56 (41.2%) patients with clinical symptoms at baseline (systemic, n = 21; and ischemic, n = 40), 53 (94.6%) demonstrated remission of clinical symptoms at 3-month follow-up. Three patients had symptoms of amaurosis, which remained at 6 months.
To evaluate the relationship between wall thickness and clinical symptoms, we calculated the extent of wall thickness reduction among patients with disease remission and symptom recovery during follow-up. At 3 months, a reduction of 0.40 (0.06) mm and 0.41 (0.09) mm from baseline were observed in patients with disease remission and symptom recovery, respectively (Supplementary Table S5). Among cases of ≥ 1.0 mm in wall thickness reduction, 10.7% achieved symptom recovery at 3 months; while > 0.7 mm and > 0.3 mm reduction associated with 25% and 50% rate of symptom recovery, respectively.