Animals
A total of 135 adult male Sprague-Dawley rats (220–320 g, 6-8 weeks old) were purchased from Beijing Vital River Laboratory Animal Technology and housed in the laboratory animal center of Xuanwu Hospital at Capital Medical University (Beijing, China). Animals were maintained in facilities at constant temperature (25 °C) with humidity control on a 12/12-h light/dark cycle, with free access to food and water. All procedures were approved by the Institutional Animal Care and Use Committee of the Xuanwu Hospital in accordance with the guidelines of the US National Institutes of Health “Guide for the Care and Use of Laboratory Animals”.
Experimental SAH model
A rat model of SAH was established using endovascular perforation as described (Zhang et al. 2018b). In brief, rats were anesthetized with 3% isoflurane in 35% medical oxygen, delivered through tracheal intubation and a rodent ventilator (Harvard Apparatus, Holliston, MA, USA). Then a sharpened 4-0 nylon suture (DOTMED, New York City, NY, USA) was placed in the left external carotid artery and punched through the left internal carotid artery until resistance was felt. The suture further punctured the vessel for 3 seconds, after which it was withdrawn. Sham-operated rats underwent the same procedures without perforation with the suture.
Experimental design
The rats were randomly distributed into the following groups: Naïve (n=3), Sham (n = 9), Sham + vehicle (n = 18), SAH (n = 33), SAH + vehicle (n = 18), SAH + 0.3 μg/kg RvD2 (n = 6), SAH + 0.9 μg/kg RvD2 (n = 18), and SAH + 2.7 μg/kg RvD2 (n = 6). The groups were treated as follows and as illustrated in Fig. 1:
Experiment 1: Location and dynamics of GPR18 expression in different brain regions after SAH
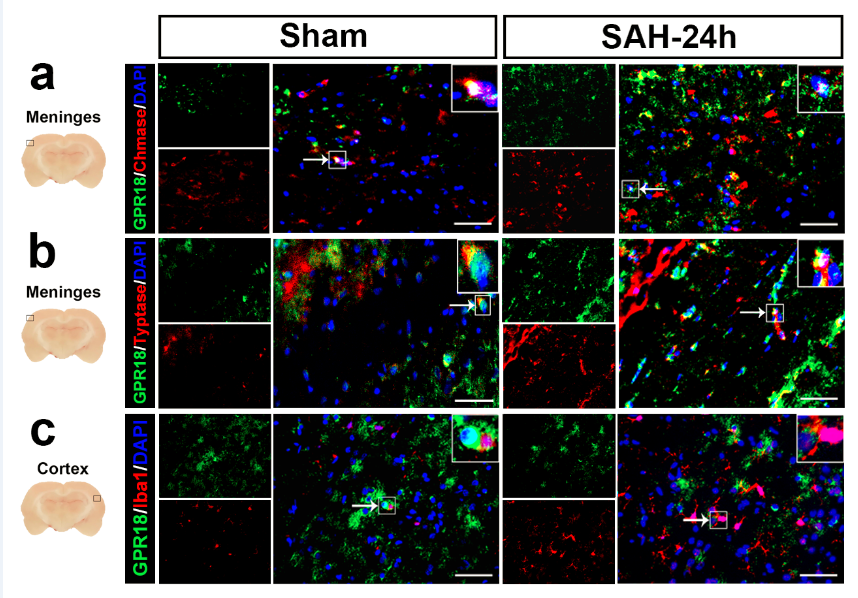
We first measured the immunofluorescence of GPR18 in different brain regions of three naïve rats. GPR18 expression in various brain regions was also measured over time in different brain regions (Supplemental Figure 1). A total of 36 rats were randomly assigned to six groups depending on at what time point after SAH induction they were analyzed (n=6 per group): Sham, SAH-3 h, SAH-6 h, SAH-12 h, SAH-24 h, and SAH-72 h. Western blot analysis was performed to assess the protein levels of GPR18. Another three Sham rats and three SAH-24 h rats were analyzed by double immunofluorescence staining against GPR18 as well a marker of mast cells and microglia (Supplemental Figure 2).
Experiment 2: Role of RvD2 in neurological function and brain edema
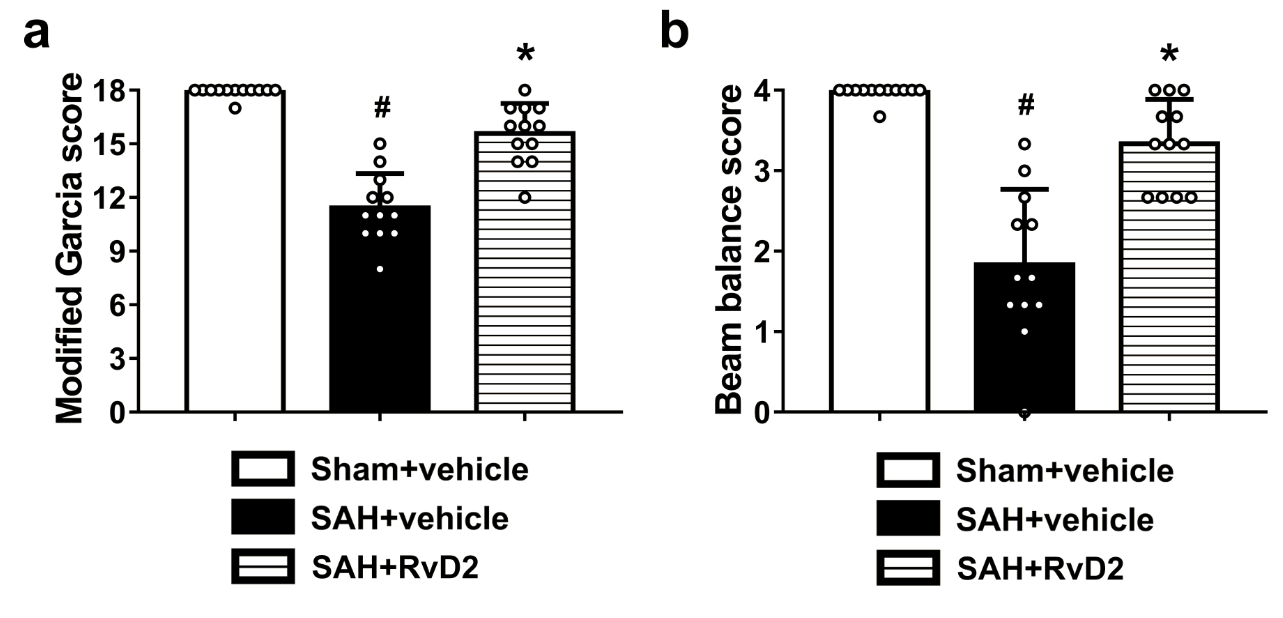
To evaluate the effects of GPR18 activation by RvD2 on neurological outcomes after SAH, 30 rats were randomly assigned into five groups (n=6 per group): Sham + vehicle, SAH + vehicle, SAH+RvD2 (0.3 μg/kg), SAH+RvD2 (0.9 μg/kg), and SAH+RvD2 (2.7 μg/kg). The SAH grade test, modified Garcia test, beam balance test and brain water content test were performed as described below at 24 h after SAH in all groups.
Experiment 3: Mechanisms of RvD2-mediated GPR18 activation in different brain regions
To explore the neuroprotective mechanisms of GPR18 activation by RvD2 in different brain regions after SAH, 36 rats were randomly assigned to three groups (n=12 per group): Sham + vehicle, SAH + vehicle, and SAH + RvD2 (0.9 μg/kg). Neurological scores were assessed before euthanasia (Supplemental Figure 3). At 24 h after SAH, 18 rats (n=6 per group) were analyzed by processing sections from different brain regions with terminal deoxynucleotidyl transferase dUTP (TUNEL), dihydroethidium (DHE), immunofluorescence and toluidine blue. At the same time point, another 18 rats (n=6 per group) were analyzed by processing lysates from different brain regions for western blotting to evaluate mast cell degranulation, hypothalamic inflammation, BBB disruption, oxidative stress, neuronal apoptosis and WMI.
Administration of RvD2
RvD2 (Sigma–Aldrich, St. Louis, MO, USA) was diluted with 1% dimethylsulfoxide (DMSO) in sterile saline and administered intranasally at 1 h after induction of SAH as described above. Vehicle was 1% dimethylsulfoxide (DMSO) in sterile saline. Rats in the SAH + vehicle and Sham groups received an equal volume of vehicle with the same method of injection.
Intranasal administration was performed as our previous study reported (Zuo et al. 2019). In brief, the anesthetized rats were placed on their backs and administered with vehicle or RvD2 at a dose of 0.3, 0.9 or 2.7 μg/kg) as nose drops (1 μl/drop) over a period of 20 min. Alternating drops were given every 2 min between the left and right nares. A total volume of 10 μl was administered intranasally.
SAH grade
The severity of SAH was measured on the SAH grading scale by blinded investigators before euthanasia at 24 h after SAH surgery as previous reported (Zhang et al. 2018b). Rats with a grade lower than 8 were excluded because that previous work suggested that their injury was minimal. Thus, one animal was excluded from the SAH-3h group, two from the SAH-6 h group, one from the SAH-24 h, and two from the SAH + vehicle group.
Neurological score and brain water content
Neurological scores were divided into the modified Garcia and beam balance scores as previously described (Zhang et al. 2018b). Six individual tests for responses to motion and sensation were performed and summarized as a modified Garcia score, while the beam balance score was expressed on a 4-point scale.
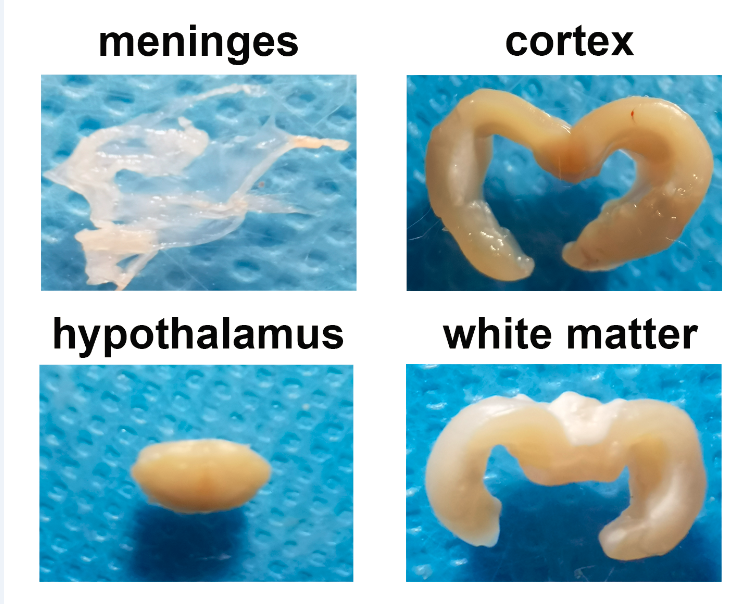
Left hemisphere, right hemisphere, cerebellum and brain stem were harvested from rats without perfusion. Each sample was weighed before drying to obtain the wet weight (WW), then dried in an oven at 105 ℃ to obtain the dry weight (DW). Brain water content was calculated as [(WW–DW) / WW] × 100%.
TUNEL staining
TUNEL staining was carried out using the Cell Death Detection Kit (Roche, San Francisco, CA, USA) was performed as described (Zhang et al. 2019a). After anesthetization, animals were intracardially perfused with 100 mL ice-cold phosphate-buffered saline (PBS), followed by 100 mL of 10% paraformaldehyde. Whole brains were harvested and fixed in 10% paraformaldehyde for 24 hours followed by 30% sucrose for three days. After being frozen at −80 °C, the brains were cut into sections 8 μm thick on a cryostat (LM3050S; Leica Microsystems, Bannockburn, Germany). Slices were divided into Sham + vehicle, SAH + vehicle and SAH + RvD2 groups. Nuclei were stained using 4-diamidino-2-phenylindole (DAPI), and samples were analyzed under a DMI8 fluorescence microscope (Leica Microsystems, Buffalo Grove, IL, USA).
ImageJ software was used for analysis. Mean numbers of TUNEL-positive and total cells were determined for six sections per brain at ´200 magnification by a blinded investigator. Apoptotic index was expressed as the ratio of the number of TUNEL-positive cells to the total number of cells within the temporal lobe of the cortex in each group.
DHE staining
The stock DHE reagent was purchased from Invitrogen (Grand Island, NY) and working agent for experiments was prepared as described (Zhang et al. 2019a). Briefly, brain slices were prepared as described above for TUNEL staining. After 1-h incubation with working agent and 10 min of PBS washing, the slides were dried at 37 ℃ for 30 min, then mounted and washed three times with PBS, each time for 10 min. Sections were observed and evaluated as for TUNEL staining. An oxidative stress index was calculated as the average number of DHE-positive cells per mm2 in the temporal lobe of the cortex.
Toluidine blue staining
Whole brains were harvested from rats in each group at 24 h after operation. Slices 8 μm thick were prepared as described (Zhang et al. 2006). Each slice was dipped in toluidine blue staining solution for 30 min, gently rinsed with distilled water for 3-5 min, and developed using 0.5% glacial acetic acid until the nucleus and intracellular features were clearly visible. The sections were rapidly dehydrated in 95% ethanol, rendered transparent using xylene, then mounted, sealed and examined under a DCM8 optical microscope (Leica Microsystems, Buffalo Grove, IL, USA).
Immunofluorescence staining
Whole brains were harvested from rats in each group at 24 h after operation. Slices 8 μm thick were prepared as described (Zhang et al. 2019b) and stained overnight at 4 °C with primary antibodies against GPR18 (1:200, Abcam, ab76258), aquaporin protein 4 (AQP4) (1:200, Abcam, ab9512), nerve peptide Y (NPY) (1:100, Novus Biologicals, NBP1-46535), proopiomelanocortin (POMC) (1:200, Abcam, ab94446), chymase (1:200, Abcam, ab186417), tryptase (1:200, Abcam, ab151757), or Iba1 (1:200, Abcam, ab178846). Nuclei were stained using DAPI (Abcam, ab104139). Next, brain sections were incubated at room temperature for 2 h with secondary antibodies (1:500, Jackson Immunoresearch, PA, USA). Sections were observed and analyzed as described above for TUNEL staining.
Western blot analysis
Western blot analysis was performed as described (Zhang et al. 2019b). In brief, different regions of cerebral hemispheres were collected, grinded and lysed with RIPA buffer for 1 hour in room temperature, then equal amounts of total protein (50 μg) were fractionated on sodium dodecylsulphate polyacrylamide gel electrophoresis (SDS-PAGE) and transferred to nitrocellulose membranes. Membranes were blocked for 2 hours with 5% non-fat milk in Tris-buffered saline containing Tween-20 (pH 7.6), followed by overnight incubation at 4 °C with primary antibody against GPR18 (1:1000, Abcam, ab76258), chymase (1:1000, Abcam, ab186417), tryptase (1:1000, Abcam, ab151757), NPY (1:1000, Novus Biologicals, NBP1-46535), POMC (1:1000, Abcam, ab94446), TNF-α (1:1000, Abcam, ab205587), interleukin-10 (IL-10) (1:1000, Abcam, ab133575), matrix metalloprotease-9 (MMP-9) (1:1000, Abcam, ab76003), AQP4 (1:1000, Santa Cruz Biotechnology, sc-390488), cleaved caspase-3 (1:1000, Cell Signaling Technology, #9664), Romo1 (1:1000, Abcam, ab236409), amyloid precursor protein (APP) (1:1500, Abcam, ab101492), myelin basic protein (MBP) (1:1000, Abcam, ab209328). Membranes were immunostained against β-actin (1:5000, Santa Cruz Biotechnology, sc-8432) as a loading control. After 3 times of washing with washing buffer, The membranes were then incubated with appropriate secondary antibodies (1:5000, Santa Cruz Biotechnology). The images were analyzed in a blinded fashion using ImageJ software.
Statistical analysis
All experiments were performed with full blinding, allocation concealment, and randomization. The Shapiro-Wilk test was used to test data for normality before analysis. Normally distributed continuous variables were expressed as mean ± SD and compared among three or more groups using one-way analysis of variance (ANOVA), followed by Tukey’s post-hoc test. Skewed continuous variables were expressed as median (interquartile range) and compared between groups using the Kruskal-Wallis test, followed by Dunn’s post-hoc test. P < 0.05 was defined as statistically significant. All statistical analyses were performed using SPSS 24.0 (IBM, Chicago, IL, USA).