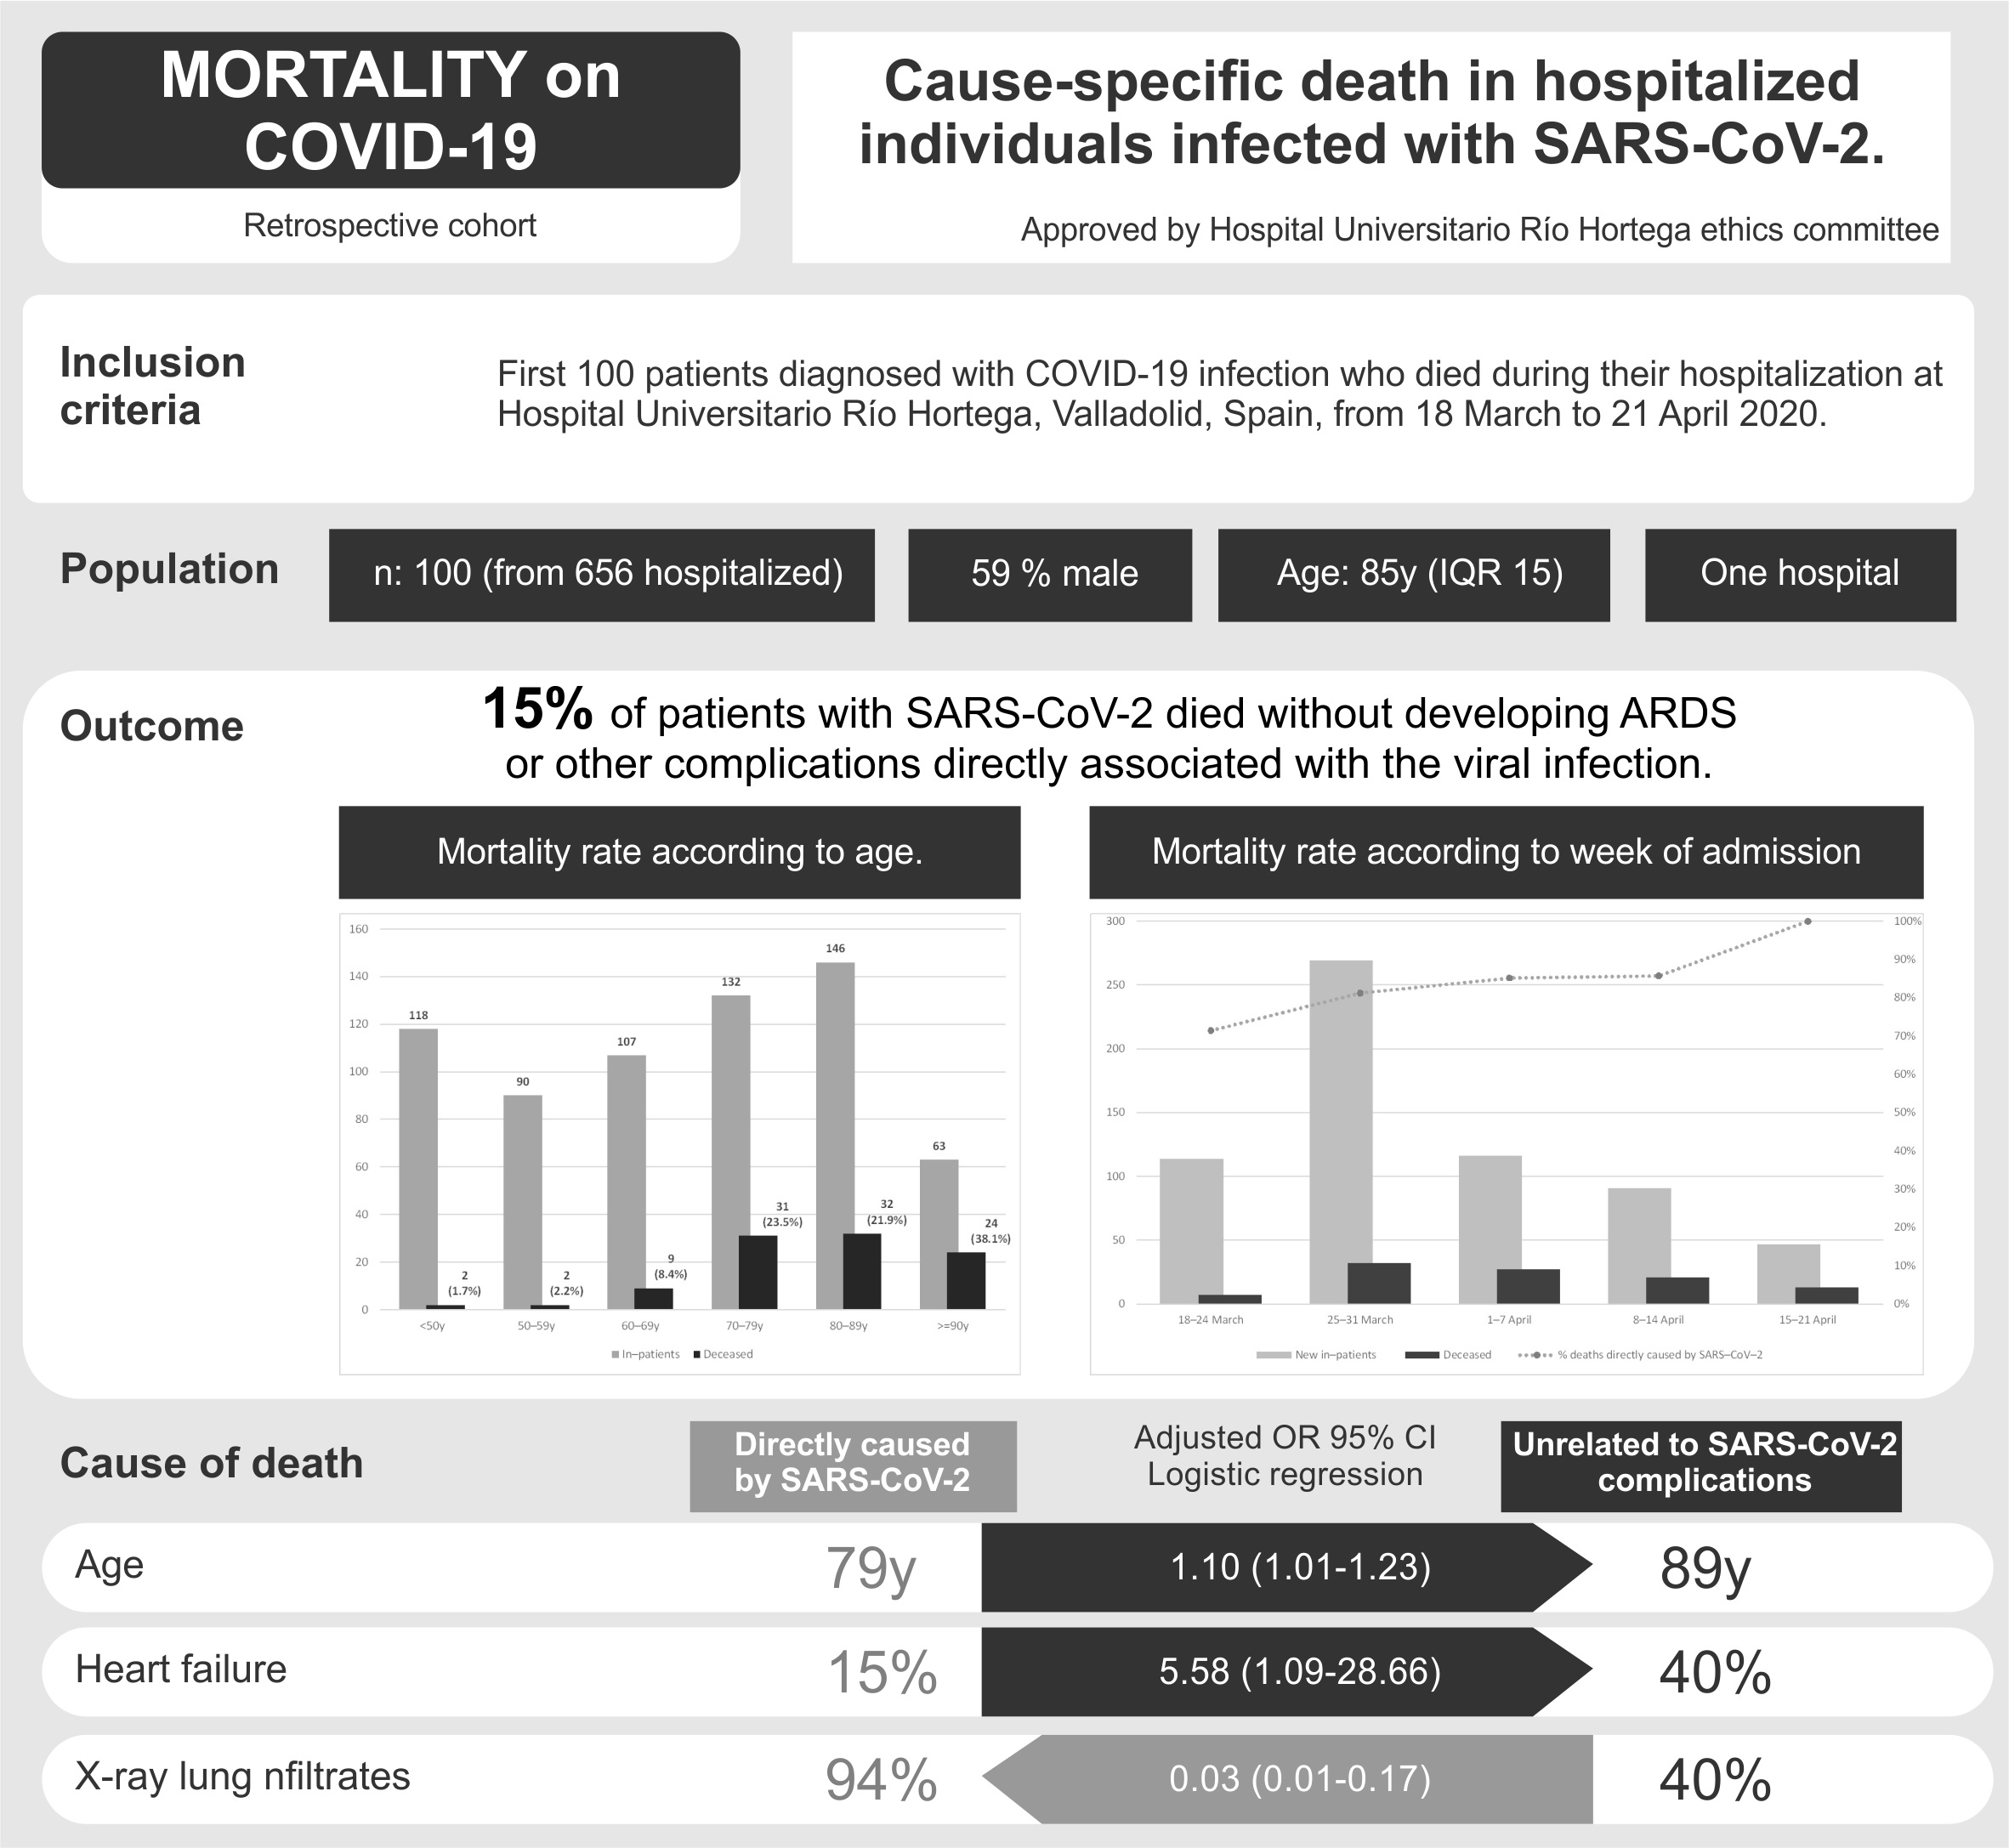
A total of 734 patients referred to our hospital were diagnosed as infected with SARS-CoV-2 during the study period. Of these, 656 (89%, 95% CI 87–91%) patients were admitted to hospital (median age 71 years, IQR 29; 52% were male). Seventy-eight patients were discharged on the same day directly from the emergency room because they had mild disease without pneumonia. One hundred patients died (15.2%, 95% CI 13–18%). The distributions of inpatients and the mortality rate according to age group are detailed in Figure 1. At the time of writing, 17% of the patients admitted during the study period were still in hospital.
The median age of the patients who died was 85 years (IQR 15), and 59% were male. Basal characteristics, comorbidities and chronic treatment are detailed in Table 1. In 15 patients, the cause of death was attributed to other causes than the own viral infection. These patients were older, with more long-term conditions and higher Charlson comorbidity scores, and more frequently had heart failure, dementia or cerebrovascular disease. They had a higher grade of dependency for activities of daily living. More frequently, the X-ray was normal and no fever was present at admission.
Table 1. Basal characteristics.
|
Characteristics
|
Total
(n = 100)
|
Deaths caused directly by SARS-CoV-2 infection (n = 85)
|
Deaths unrelated to SARS-CoV-2 complications (n = 15)
|
p
|
|
Age, median (IQR), years
|
85 (15)
|
79 (16)
|
89 (6)
|
0.010
|
|
<50
50–59
60–69
70–79
80–89
≥90
|
2 (2%)
2 (2%)
9 (9%)
31 (31%)
32 (32%)
24 (24%)
|
2 (2%)
2 (2%)
9 (11%)
30 (35%)
24 (29%)
18 (22%)
|
0 (0%)
0 (0%)
0 (0%)
1 (7%)
8 (44%)
6 (33%)
|
0.007*
|
|
Males
|
59 (59%)
|
53 (62%)
|
6 (40%)
|
0.105
|
|
Place of residence
Home
Nursing home
|
57 (57%)
43 (43%)
|
55 (62%)
32 (38%)
|
4 (27%)
11 (73%)
|
0.010
|
|
Comorbidities
Hypertension
Dyslipidaemia
Myocardial infarction
Heart failure
Cerebrovascular disease
Dementia
COPD
Asthma
SAHS
Interstitial lung disease
Connective tissue disease
Peptic ulcer disease
Diabetes mellitus
Uncomplicated
End organ damage
Chronic liver disease
Mild
Moderate or severe
Chronic kidney disease
Solid tumour
Localized
Metastatic
Leukaemia or lymphoma Current or past smoker
|
71 (71%)
42 (42%)
16 (16%)
19 (19%)
12 (12%)
24 (24%)
6 (6%)
4 (4%)
6 (6%)
1 (1%)
0 (0%)
12 (12%)
25 (25%)
4 (4%)
4 (4%)
2 (2%)
16 (16%)
12 (12%)
2 (2%)
5 (5%)
21 (21%)
|
58 (68%)
37 (44%)
14 (17%)
13 (15%)
7 (8%)
17 (20%)
5 (6%)
3 (4%)
4 (5%)
1 (1%)
0 (0%)
10 (12%)
21 (25%)
3 (4%)
4 (5%)
2 (2%)
14 (17%)
12 (14%)
2 (2%)
4 (5%)
18 (21%)
|
13 (87%)
5 (33%)
2 (13%)
6 (40%)
5 (33%)
7 (47%)
1 (7%)
1 (7%)
2 (13%)
0 (0%)
1 (7%)
2 (13%)
4 (27%)
1 (7%)
0 (0%)
0 (0%)
2 (13%)
0 (0%)
0 (0%)
1 (7%)
3 (20%)
|
0.219
0.461
1.000
0.036
0.016
0.046
0.484
0.558
0.220
1.000
0.150
1.000
1.000
0.484
1.000
1.000
1.000
0.204
1.000
0.564
1.000
|
|
Number of long-term conditions, median (IQR)
|
3 (3)
|
3 (4)
|
5 (4)
|
0.064
|
|
Charlson comorbidity index, median (IQR)
|
5 (3)
|
5 (2)
|
6 (2)
|
0.040
|
|
Performance in activities of daily living
Independent
Slight dependency
Moderate dependency
Severe dependency
Total dependency
|
46 (46%)
21 (21%)
14 (14%)
8 (8%)
11 (11%)
|
45 (52%)
18 (21%)
10 (12%)
7 (8%)
5 (6%)
|
1 (7%)
3 (20%)
4 (27%)
1 (7%)
6 (40%)
|
0.000
|
|
Chronic treatment
ACEs
ARBs
Statins
Metformin
IDPP-4
Insulin
Inhaled corticosteroids
Oral corticosteroids
Immunomodulators
|
25 (25%)
25 (25%)
32 (32%)
18 (18%)
11 (11%)
6 (6%)
9 (9%)
3 (3%)
4 (4%)
|
18 (21%)
20 (24%)
29 (34%)
13 (15%)
10 (12%)
6 (7%)
8 (9%)
3 (4%)
4 (5%)
|
7 (47%)
5 (33%)
3 (20%)
5 (33%)
1 (7%)
0 (0%)
1 (7%)
0 (0%)
0 (0%)
|
0.051
0.518
0.375
0.138
1.000
0.587
1.000
1.000
1.000
|
ACEs: angiotensin-converting enzyme inhibitors, ARBs: angiotensin II receptor blockers, COPD: chronic obstructive pulmonary disease, RT-PCR: reverse transcription polymerase chain reaction, SAHS: sleep apnoea–hypopnea syndrome.
Among the 15 patients whose deaths were not directly caused by SARS-CoV-2 infection, eight very frail patients (53%) died without developing any SARS-CoV-2 complication, with the cause of death attributed to wasting associated with age; two (13%) died of sepsis caused by bacterial infection; 2 (11%) died of heart failure or pulmonary oedema; two (13%) died of kidney failure; and one (7%) died of bronchoaspiration.
The most commonly reported symptoms are detailed in Table 2. Patients who died of COVID-19 complications were more frequently feverish or had fever at admission. Dyspnoea was the most common symptom in both groups. Nearly half of the patients who died without COVID-19 complications had normal X-rays, and lymphocyte and white blood cell counts were higher in these patients.
Table 2. Initial clinical, radiological and laboratory parameters and specific COVID-19 treatment.
|
Characteristics
|
Total
(n = 100)
|
Deaths caused directly by SARS-CoV-2 infection (n = 85)
|
Deaths unrelated to SARS-CoV-2 complications (n = 15)
|
p
|
|
Days from illness onset to hospital admission, median (IQR), days
|
4 (5)
|
5 (5)
|
3 (6)
|
0.404
|
|
Signs and symptoms at diagnosis
Shortness of breath
Fever
Cough
Diarrhoea or vomiting
Abdominal pain
Anosmia or ageusia
Asthenia
Arthromyalgia
Sore throat
Headache
|
78 (78%)
72 (72%)
45 (45%)
12 (12%)
5 (5%)
20 (20%)
13 (13%)
3 (3%)
3 (3%)
13 (13%)
|
64 (75%)
65 (77%)
41 (48%)
12 (14%)
5 (6%)
18 (22%)
11 (13%)
3 (4%)
3 (4%)
11 (13%)
|
14 (93%)
7 (47%)
4 (27%)
0 (0%)
0 (0%)
2 (11%)
2 (11%)
0 (0%)
0 (0%)
2 (11%)
|
0.180
0.028
0.122
0.204
1.000
0.298
1.000
1.000
1.000
1.000
|
|
X-ray/CT scan findings
Normal
Unilateral infiltrates
Bilateral infiltrates
|
14 (14%)
16 (16%)
70 (70%)
|
5 (6%)
14 (17%)
66 (77%)
|
9 (60%)
2 (13%)
5 (33%)
|
0.000
|
|
Diagnosis
RT-PCR positive
Ig test positive
Presumptive diagnosis
|
95 (95%)
2 (2%)
3 (3%)
|
78 (95%)
2 (2%)
2 (2%)
|
14 (93%)
0 (0%)
1 (7%)
|
0.289
|
|
Laboratory parameters, median (IQR)
SaFi
PaFi
White blood cells, x 109/mL
Lymphocytes, x 109/mL
Platelets, x 109/mL
Haemoglobin, g/dL
D-dimer, mg/mL
CRP, mg/L
Serum ferritin, ng/mL
Creatinine, mg/dL
Sodium
ALT, U/l
AST, U/l
LDH, U/l
|
393 (127)
236 (114)
6,600 (5,575)
700 (500)
171 (115)
129 (25)
652 (929)
108 (125)
563 (1257)
1.13 (0.5)
135 (10)
27 (38)
51 (32)
424 (141)
|
395 (126)
238 (117)
6,500 (5,550)
660 (500)
168 (112)
127 (27)
639 (912)
110 (110)
563 (1287)
1.12 (0.8)
134 (9)
29 (22)
51 (45)
425 (186)
|
390 (230)
233 (62)
7,900 (5,000)
1,000 (900)
196 (81)
131 (21)
889 (1865)
104 (170)
564 (557)
1.14 (1.3)
137 (4)
20 (39)
49 (24)
399 (152)
|
0.754
0.889
0.132
0.039
0.512
0.133
0.037
0.925
0.572
0.671
0.340
0.878
0.689
0.828
|
|
Treatments during study period
Antibiotic agent
Azithromycin
Lopinavir and ritonavir
Hydroxychloroquine
Interferon
Tocilizumab
Corticosteroids
Anticoagulants
LMWH prophylaxis
LMWH extended prophylaxis
LMWH therapy
Oral anticoagulants
No anticoagulants
|
96 (96%)
84 (84%)
51 (51%)
85 (85%)
14 (14%)
3 (3%)
25 (25%)
64 (64%)
4 (4%)
15 (15%)
1 (1%)
16 (16%)
|
81 (95%)
70 (82%)
49 (58%)
71 (84%)
14 (17%)
3 (4%)
24 (28%)
52 (61%)
4 (5%)
13 (15%)
1 (1%)
15 (18%)
|
15 (100%)
14 (93%)
2 (13%)
14 (93%)
0 (0%)
0 (0%)
1 (7%)
12 (80%)
0 (0%)
2 (13%)
0 (0%)
1 (7%)
|
0.391
0.285
0.002
0.457
0.120
1.000
0.385
0.630
|
|
Respiratory support
High-flow oxygen
Non-invasive ventilation
Invasive mechanical ventilation
ECMO
|
1 (1%)
11 (11%)
20 (20%)
1 (1%)
|
1 (1%)
11 (13%)
20 (24%)
1 (1%)
|
0 (0%)
0 (0%)
0 (0%)
0 (0%)
|
1.000
0.206
0.037
1.000
|
ALT: alanine aminotransferase, AST: aspartate aminotransferase, CRP: C-reactive protein, ECMO: extracorporeal membrane oxygenation, LDH: lactate dehydrogenase, LMWH: low molecular weight heparin, PaFi: arterial partial pressure of oxygen/fraction of inspired oxygen, SaFi: pulse oximetric saturation/fraction of inspired oxygen.
The COVID-19 complications are detailed in Table 3. Nearly four in five patients who died with complications associated with SARS-CoV-2 infection developed ARDS or hyperinflammation. The first weeks, with more pressure on the hospital from the admission of new patients with COVID-19, had higher rates of deaths unrelated to SARS-CoV-2 complications.
Table 3. COVID-19 complications.
|
Characteristics
|
Total
(n = 100)
|
Deaths caused directly by SARS-CoV-2 infection (n = 85)
|
Deaths unrelated to SARS-CoV-2 complications (n = 15)
|
p
|
|
Days in hospital until death, median (IQR), days
|
6 (7)
|
6 (8)
|
5 (8)
|
0.148
|
|
ARDS
|
70 (70%)
|
70 (82%)
|
0 (0%)
|
0.000
|
|
Hyperinflammation
|
72 (72%)
|
66 (78%)
|
6 (40%)
|
0.003
|
|
Septic shock
|
10 (10%)
|
10 (12%)
|
0 (0%)
|
0.351
|
|
Pulmonary embolism
|
2 (2%)
|
2 (2%)
|
0 (0%)
|
1.000
|
|
Place of death
Hospital ward
Intensive care unit
|
80 (80%)
20 (20%)
|
65 (77%)
20 (23%)
|
185 (100%)
0 (0%)
|
0.037
|
|
Week of admission
18–24 March
25–31 March
1–7 April
8–14 April
15–21 April
|
7 (7%)
32 (32%)
27 (27%)
21 (21%)
13 (12%)
|
5 (6%)
26 (31%)
23 (27%)
18 (21%)
13 (15%)
|
2 (13%)
6 (40%)
4 (27%)
3 (20%)
0 (0%)
|
0.084*
|
ARDS: acute respiratory distress syndrome.
The variables associated with the cause of death are shown in Table 4.
Table 4. Variables significantly associated with deaths unrelated to COVID-19 complications.
|
Variable
|
Crude OR (95% CI)
|
Adjusted OR (95% CI)
|
p
|
|
Age
|
1.12 (1.03–1.22)
|
1.10 (1.01–1.23)
|
0.048
|
|
Heart failure
|
3.69 (1.12–12.14)
|
5.58 (1.09–28.66)
|
0.039
|
|
X-ray infiltrates
|
0.04 (0.01–0.16)
|
0.03 (0.01–0.17)
|
0.000
|
|
Dependence on activities of daily living
|
15.75 (1.98–125.19)
|
|
|
|
Cerebrovascular disease
|
5.58 (1.48–20.92)
|
|
|
|
Dementia
|
3.45 (1.10–10.84)
|
|
|
|
Fever or feverish at admission
|
0.27 (0.09–0.84)
|
|
|
CI: confidence interval, ns: statistically not significant, OR: odds ratio.
The evolution during the five weeks of the proportion of deaths attributed directly to COVID-19 is detailed in Figure 2. The number of new hospital admissions and the total number of deaths are also shown.