DNA extraction and mock communities
The performance of RRN sequencing was assessed using four mock microbial communities, serving as simplified representatives of real microbiome samples. The first mock community, ATCC ABRF-MGRG (Cat No. MSA-3001), comprises an even mixture of genomic DNA (gDNA) from 10 microbial strains (9 bacteria, 1 archaea). This was selected to typify environmental microbiome samples. The second, ZymoBIOMICS™ DNA Standard II (Cat No. D6311), is a log-distributed mixture of gDNA isolated from 10 microbial strains (8 bacteria, 2 fungi).
In addition, an in-house mock community with 24 distinct microbial species was constructed. To compose this in-house community, the gDNA was extracted from pure cultures of bacteria species using the GenElute™ Bacterial Genomic DNA Kit (Sigma-Aldrich, Germany) according to manufacturer's instructions. Two versions of the in-house mock community were developed. For the Mock Community Amplicons Pool (MCAP), RRN amplicons were generated using gDNA from each species individually as the template. Those amplicons were then pooled in equal amounts (in ng) before sequencing. In the second version, the Mock Community gDNA Pooled (MCGD), gDNA from each of the species was initially pooled in equal amounts (in ng) and then amplified to create RRN amplicons for the entire community. The microbial composition of each mock community is detailed in Supplementary Table 1.
PCR amplifications
Four RRN primers, 27F, 519F, 2241R, and 2428R, were selected based on their development in previous publications [39, 45, 46, 48, 49, 53]. All four possible pairings of these forward and reverse primers were employed in PCRs using the four mock communities mentioned above. Of these, 27F-2241R [39, 45, 48, 49, 53] and 519F-2428R [46, 47] have been applied previously in RRN studies. A two-step PCR approach was used in this study to generate barcoded amplicons. First-round primers consisted of M13 sequences at the 5’ end and a 3’ RRN-specific region matching the four primers listed above. The primers used during the second-round PCR, target the M13 sequences incorporated into the first-round amplicons, and allow the generation of second-round PCR products containing asymmetric barcode sequences [54]. For each sample, unique forward and reverse barcodes were utilised, with each barcode differing in sequence from the other. Further, the combination of forward and reverse primers was distinct for each sample to prevent index cross-talk during amplification. The sequences and details of the employed primers are provided in Supplementary Table 2. The PCR amplification mix for each round consisted of Q5® High-Fidelity DNA Polymerase 2X master mix (NEB, UK), forward and reverse primers (10 µM), and template DNA (2µL), made up to a volume of 25 µl using PCR grade water. PCR cycling conditions were as per Supplementary Table 3. After each PCR round, amplicons were cleaned and size-selected using NucleoMag (Macherey-Nagle GmbH & Co., Duren, Germany) at a 0.6X ratio. Their quantities were then determined using a Qubit™ fluorometer (Life Technologies, Carlsbad, CA). Each of the barcoded and cleaned RRN amplicons from the second round of PCR was pooled at equal amounts of 8 ng. Size validation was conducted on a 2100 Bioanalyzer instrument (Agilent Technology, California, United States), employing the Agilent DNA 1000 Kit. An overview of the wet-lab methods used in library preparation are presented in Fig. 1A.
Sequencing of the v3-v4 region of the 16S rRNA gene was also conducted using Illumina technology to compare with RRN sequencing at genus and species levels. The v3-v4 libraries were prepared following the procedures for Illumina 16S Metagenomic Sequencing Library Preparation [55, 56], using the Nextera XT Index kit v2 (Illumina, California, United States).
Sequencing and data processing
The pool of cleaned, barcoded RRN amplicons was sequenced using two long read platforms, Oxford Nanopore Technology (ONT, Oxford, UK) and PacBio (California, United States). One half of the pool of amplicons, was prepared for ONT sequencing according to the guidelines provided in the Nanopore protocol for PCR barcoding amplicons, version PBA96_9152_v112_revB_09Feb2022 [57], using the Ligation Sequencing Kit (Q20+) (SQK-LSK112; ONT). Given that the amplicons were already barcoded, the library processing commenced from the “DNA repair and end-prep” stage as outlined in the referenced Nanopore protocol. Sequencing was then carried out using R10.4 flow cells (FLO-MIN112; ONT) on a GridION sequencer following manufacturer’s instructions. The raw fast5 data from the GridION was base-called by Guppy v. 6.2.7 (ONT) with the High-accuracy model. MinKNOW v. 22.08.6 (ONT) was employed to apply a minimum quality score of 9. Subsequent demultiplexing of the asymmetric barcodes and the region-specific RRN primers was achieved using Nanoplexer [58]. Finally, primers and barcodes were removed using Cutadapt v. 2.6 [59].
The other half of the amplicon pool was prepared for PacBio sequencing according to the PacBio protocol for Preparing multiplexed amplicon libraries using SMRTbell prep kit 3.0 [54]. Sequencing was carried out on an 8M SMRT cell on a Sequel IIe instrument using the Sequel II Binding kit 3.2 and Sequencing chemistry v2.0 (PacBio). Loading was performed by diffusion, with a movie time of 30 hours, and a pre-extension time of 60 minutes. CCS analysis was performed on the Sequel IIe instrument. For demultiplexing, the Lima software from SMRT Tools v11 (PacBio) was used via command line without specifying a minimum barcode quality score, following which all primer and barcode sequences were removed. The PacBio sequencing service was provided by the Norwegian Sequencing Centre (Oslo, Norway).
For the v3-v4 Illumina library, sequencing was carried out on the Illumina NextSeq 2000 at the Teagasc sequencing facility, using a 2 × 300 cycle v3 kit, following standard Illumina sequencing protocols. Demultiplexing of reads was performed on the NextSeq system. Primers were removed using Cutadapt v. 2.6. Details on each sample, including number of reads, median read lengths, and median read quality, are shown in Supplementary Table 4.
Bioinformatic analysis
For the RRN amplicons, two primary approaches to compositional analysis were applied: (i) OTU clustering using vsearch [60], and (ii) direct alignment via Minimap2 [61]. Regardless of the chosen method, a consistent quality threshold of > Q12 and a length filter ranging from 3500 to 5000 bp were applied. After quality filtering, chimeric sequences were removed. The specific tools utilised for these processes varied based on the approach used and are mentioned in the respective sub-sections. The quality threshold of > Q12 was set to ensure consistency between the ONT and PacBio data, while removing a number of low-quality sequences for the ONT data. This was particularly crucial given the disparity in quality scores, with ONT data averaging at 14.7 and PacBio considerably higher at 51. PacBio data was suitable for both the OTU and direct alignment approaches, while the ONT data, owing to its comparatively lower quality scores, was only compatible with the direct alignment approach using Minimap2.
OTU clustering using vsearch
The following steps were performed using vsearch v. 2.22.1. FASTQ files from PacBio sequencing were quality (> Q12) and length filtered (3500–5000 bp) with --fastq_filter. Reads were then de-replicated using --derep_fulllength. Pre-clustering was performed to reduce the impact of sequencing error on chimera removal at 98% similarity threshold using --cluster_size. De novo and reference-based chimera removal was performed with --uchime_denovo and --uchime_ref, respectively. OTU clustering was carried out using --cluster_size at five different clustering thresholds of 97%, 98%, 99%, 99.5%, and 99.9%. The resulting OTU table was then imported into QIIME2 v. 2023.2 [12], where taxonomic classification was performed using the BLAST + consensus taxonomy classifier, hereon referred to as QIIME-BLAST (QB), with the feature-classifier classify-consensus-blast option. Two other classifiers within QIIME2, Naïve Bayes (NB) trained (QNBT) and VSEARCH exact match + sklearn (QVPSK), were also used with the options feature-classifier classify-sklearn and feature-classifier classify-hybrid-vsearch-sklearn, respectively.
Direct alignment using Minimap2
FASTQ files from PacBio and ONT sequencing were quality filtered (> Q12) using Filtlong v. 0.2.0 and length filtered (3500–5000 bp) using Cutadapt v. 2.6. Chimeric reads were detected and removed using yacrd v. 1.0. Taxonomic classification was performed using Minimap2 v. 2.17-r974 as the classifier, hereon referred to as Minimap (MM). When using MM the seed length was provided with -z 70, as suggested by Cuscó et al [49].
For v3-v4 Illumina data an average quality score of 33 was obtained. OTU clustering was performed as illustrated by the vsearch developer [62] and was similar to the OTU pipeline run on the PacBio data with the exception that for the Illumina data, forward and reverse reads were first merged using the option --fastq_mergepairs in vsearch v. 2.22.1. Following this, quality and length filtering was performed using the option --fastq_filter to keep only the reads > Q30 and ranging between 250 to 446 bp. The steps from dereplication to chimera removal were kept the same as for the PacBio data. OTU clustering was performed using --cluster_size at three different clustering thresholds of 97%, 98%, 99%. The resulting OTU table was then imported into QIIME2 v. 2023.2 and taxonomic classification was performed with the Naïve Bayes (NB) trained classifier, hereon referred to as QIIME-NB trained (QNBT), using the option feature-classifier classify-sklearn. An overview of the bioinformatic methods used to taxonomically classify the amplicon data is presented in Fig. 1B.
Taxonomy reference databases
In our analysis, six distinct reference databases were utilised. Four of these databases contained sequences of the RRN operon, with the remaining two consisting of full-length 16S rRNA sequences. The rrnDB comprises 16S-ITS-23S sequences extracted from a total of 67,199 bacterial genomes that have been retrieved from NCBI GenBank [39]. The MIrROR database includes curated 16S-23S-ITS sequences, derived through in silico PCRs employing the 27F-2241R primer pair. These sequences, clustered at a 99% similarity, originated from 43,653 bacterial genomes listed in NCBI GenBank [53]. The FANGORN database comprises quality-checked 16S-ITS-23S extracted sequences, clustered at a 99.9% similarity threshold. Within FANGORN, two primary datasets are available: one sourced from 317,541 bacterial and archaeal GTDB genomes, referred to as FANGORN-GTDB, and another sourced from 253,840 bacterial and archaeal RefSeq genomes, referred to as FANGORN-RefSeq [63]. The four RRN databases were used to taxonomically classify long-read RRN amplicons. The rrnDB, FANGORN-GTDB, and FANGORN-RefSeq databases were employed with both the QIIME-BLAST and Minimap classifiers. In contrast, MIrROR, tailored for Minimap2 applications, was exclusively used with our Minimap-based classification method. The two 16S rRNA databases being (i) SILVA v138.1 [64] and (ii) Greengenes2 [65] were used to taxonomically classify Illumina short read v3-v4 amplicons using QIIME-NB trained classifiers.
Selection of classification methods
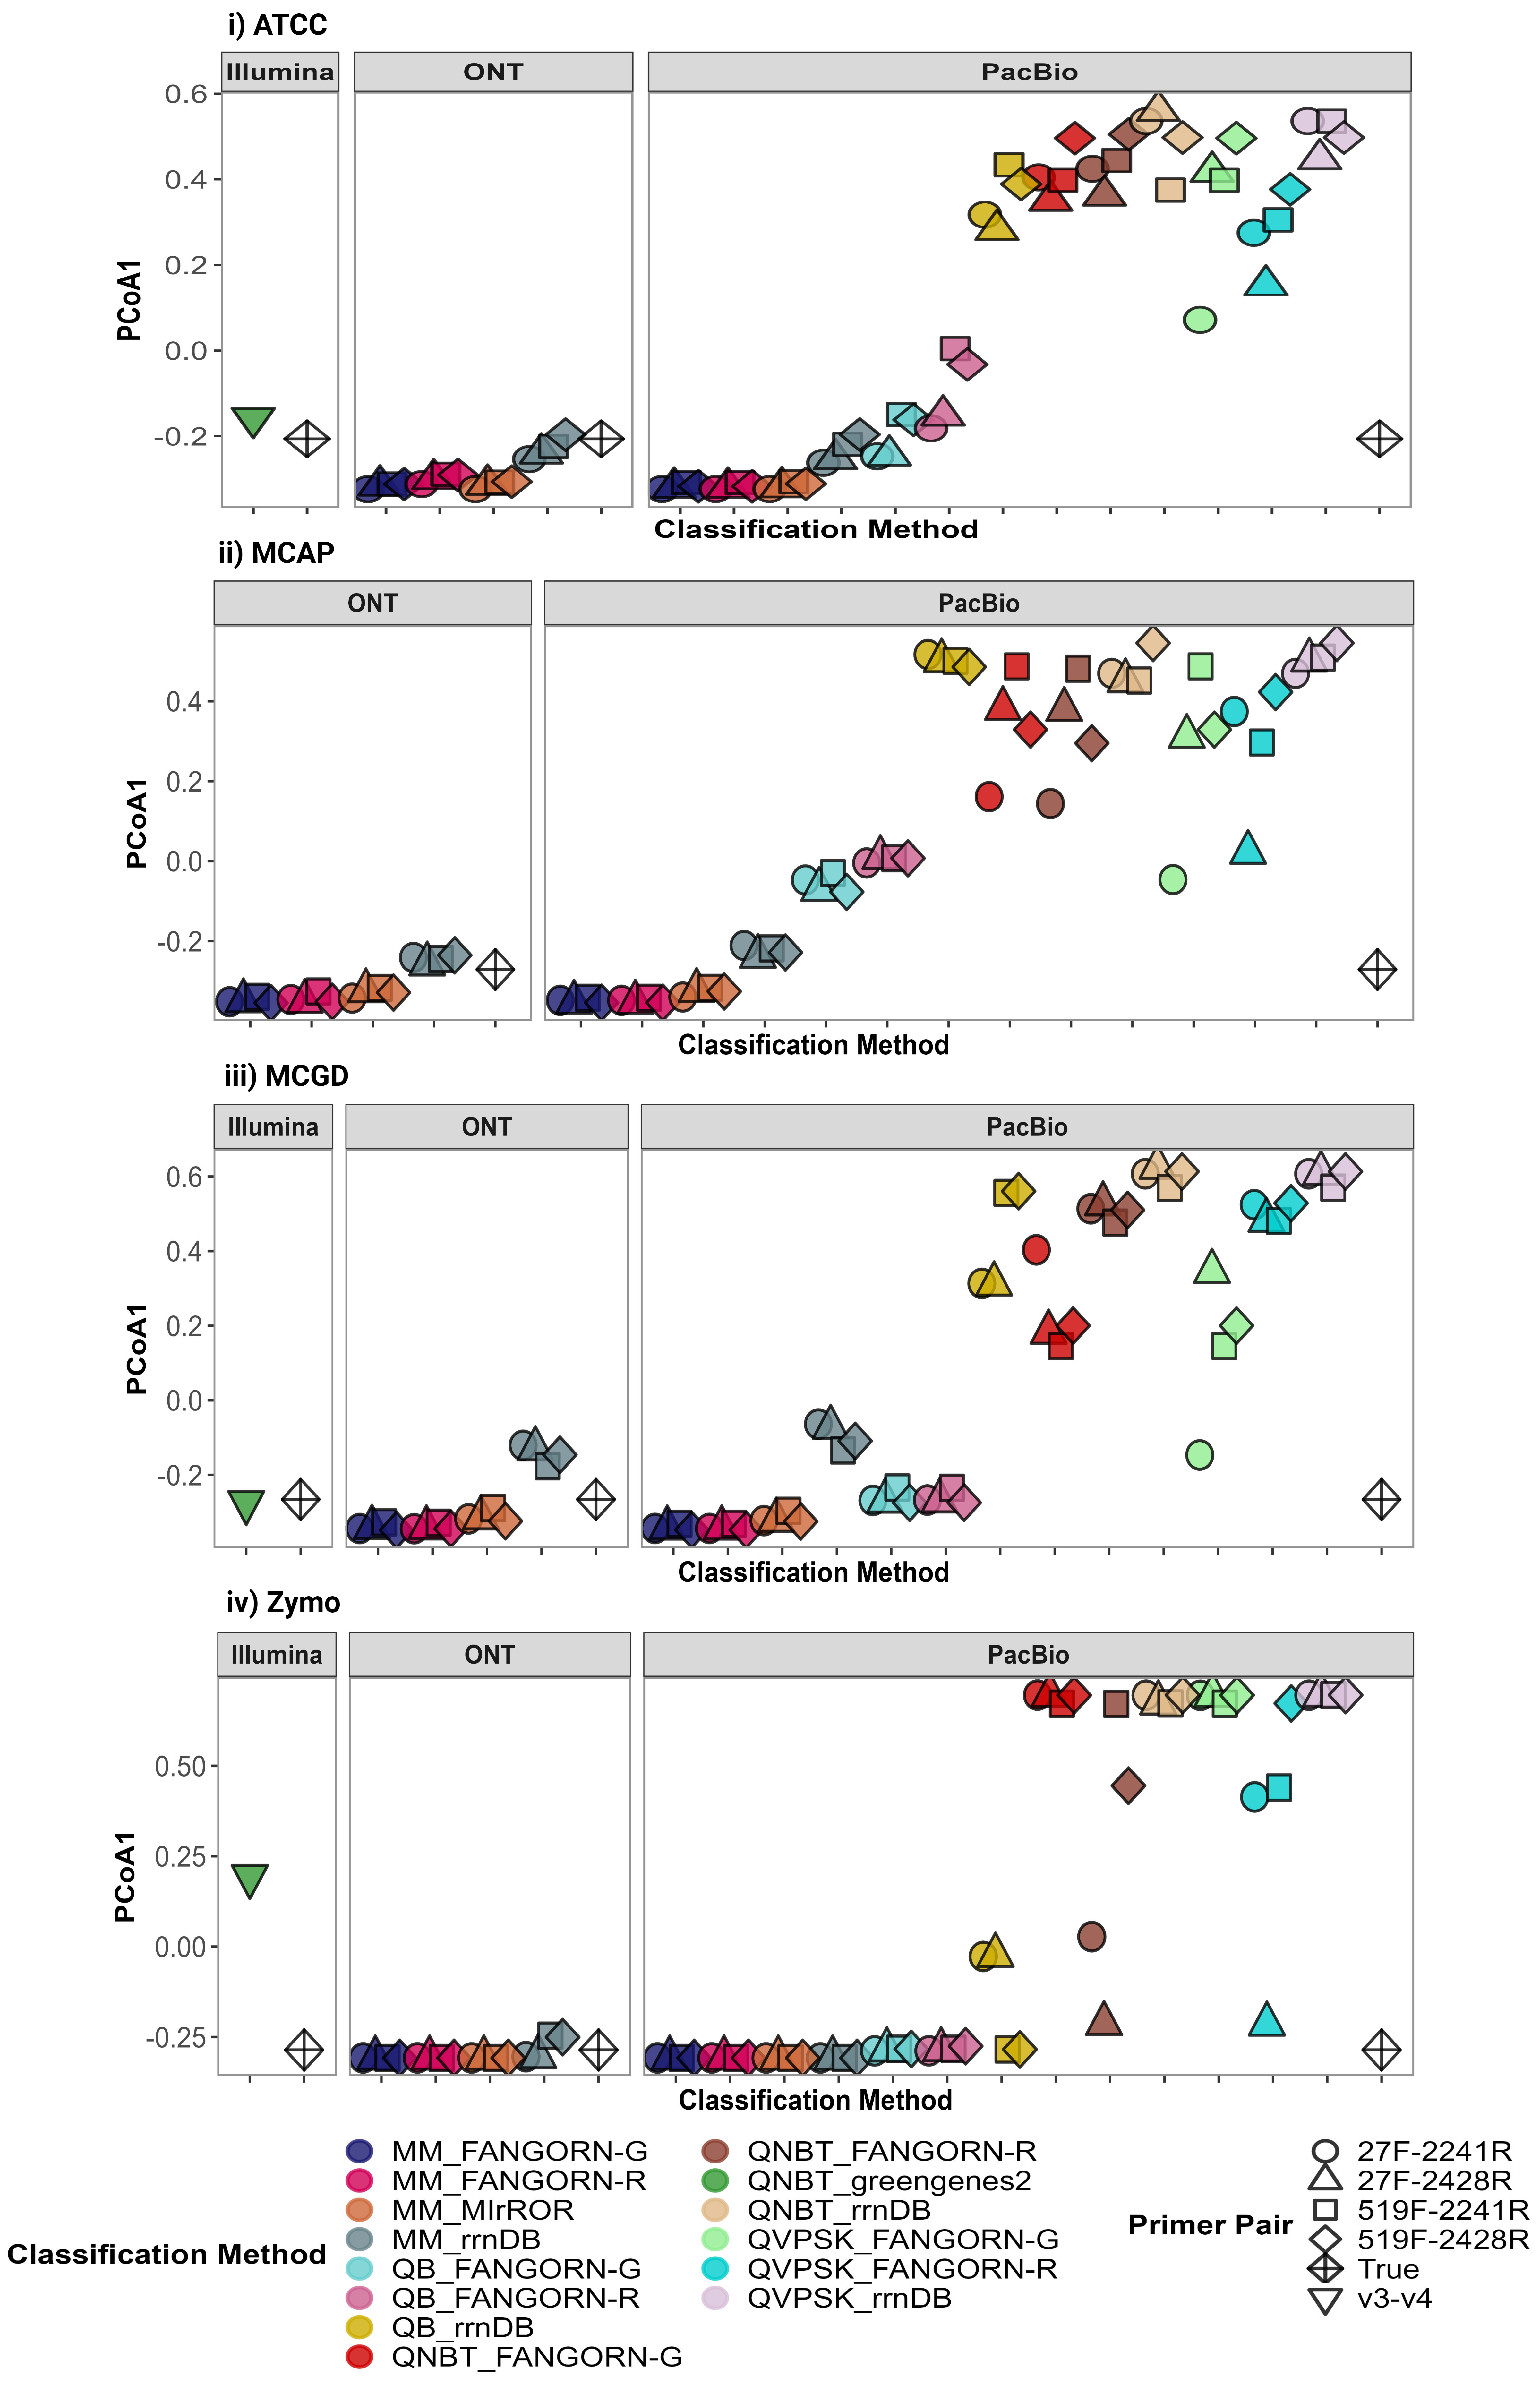
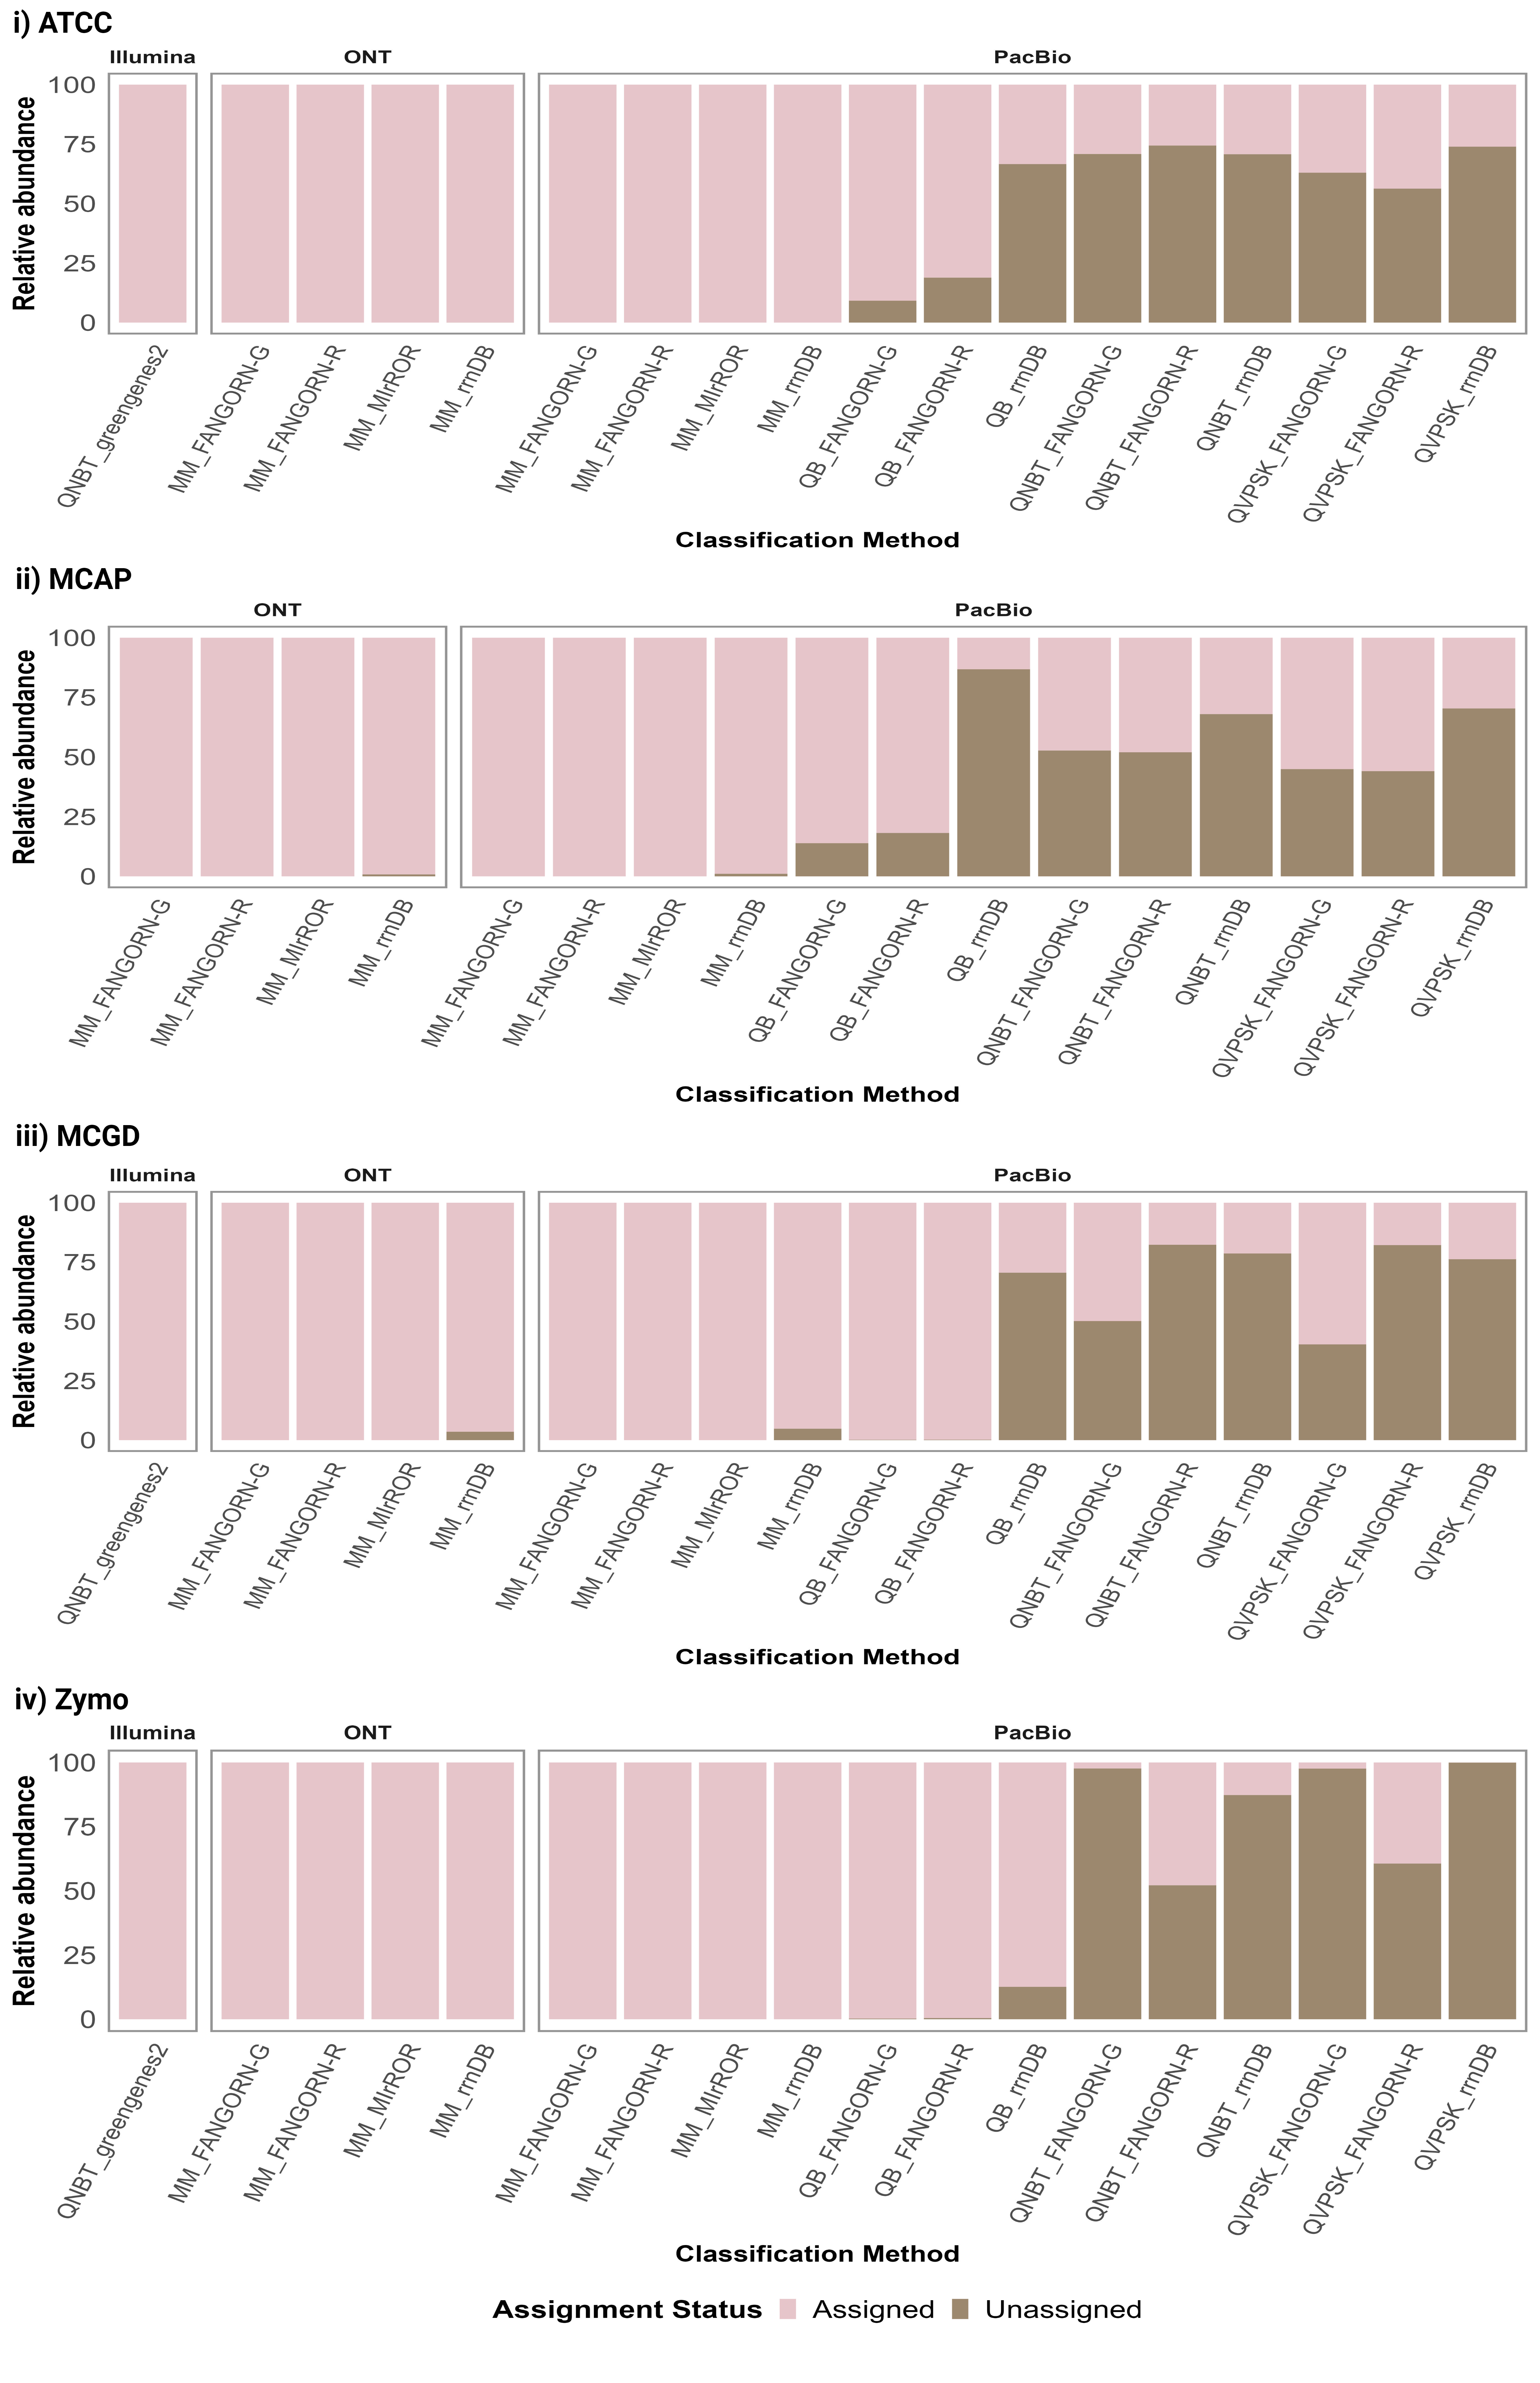
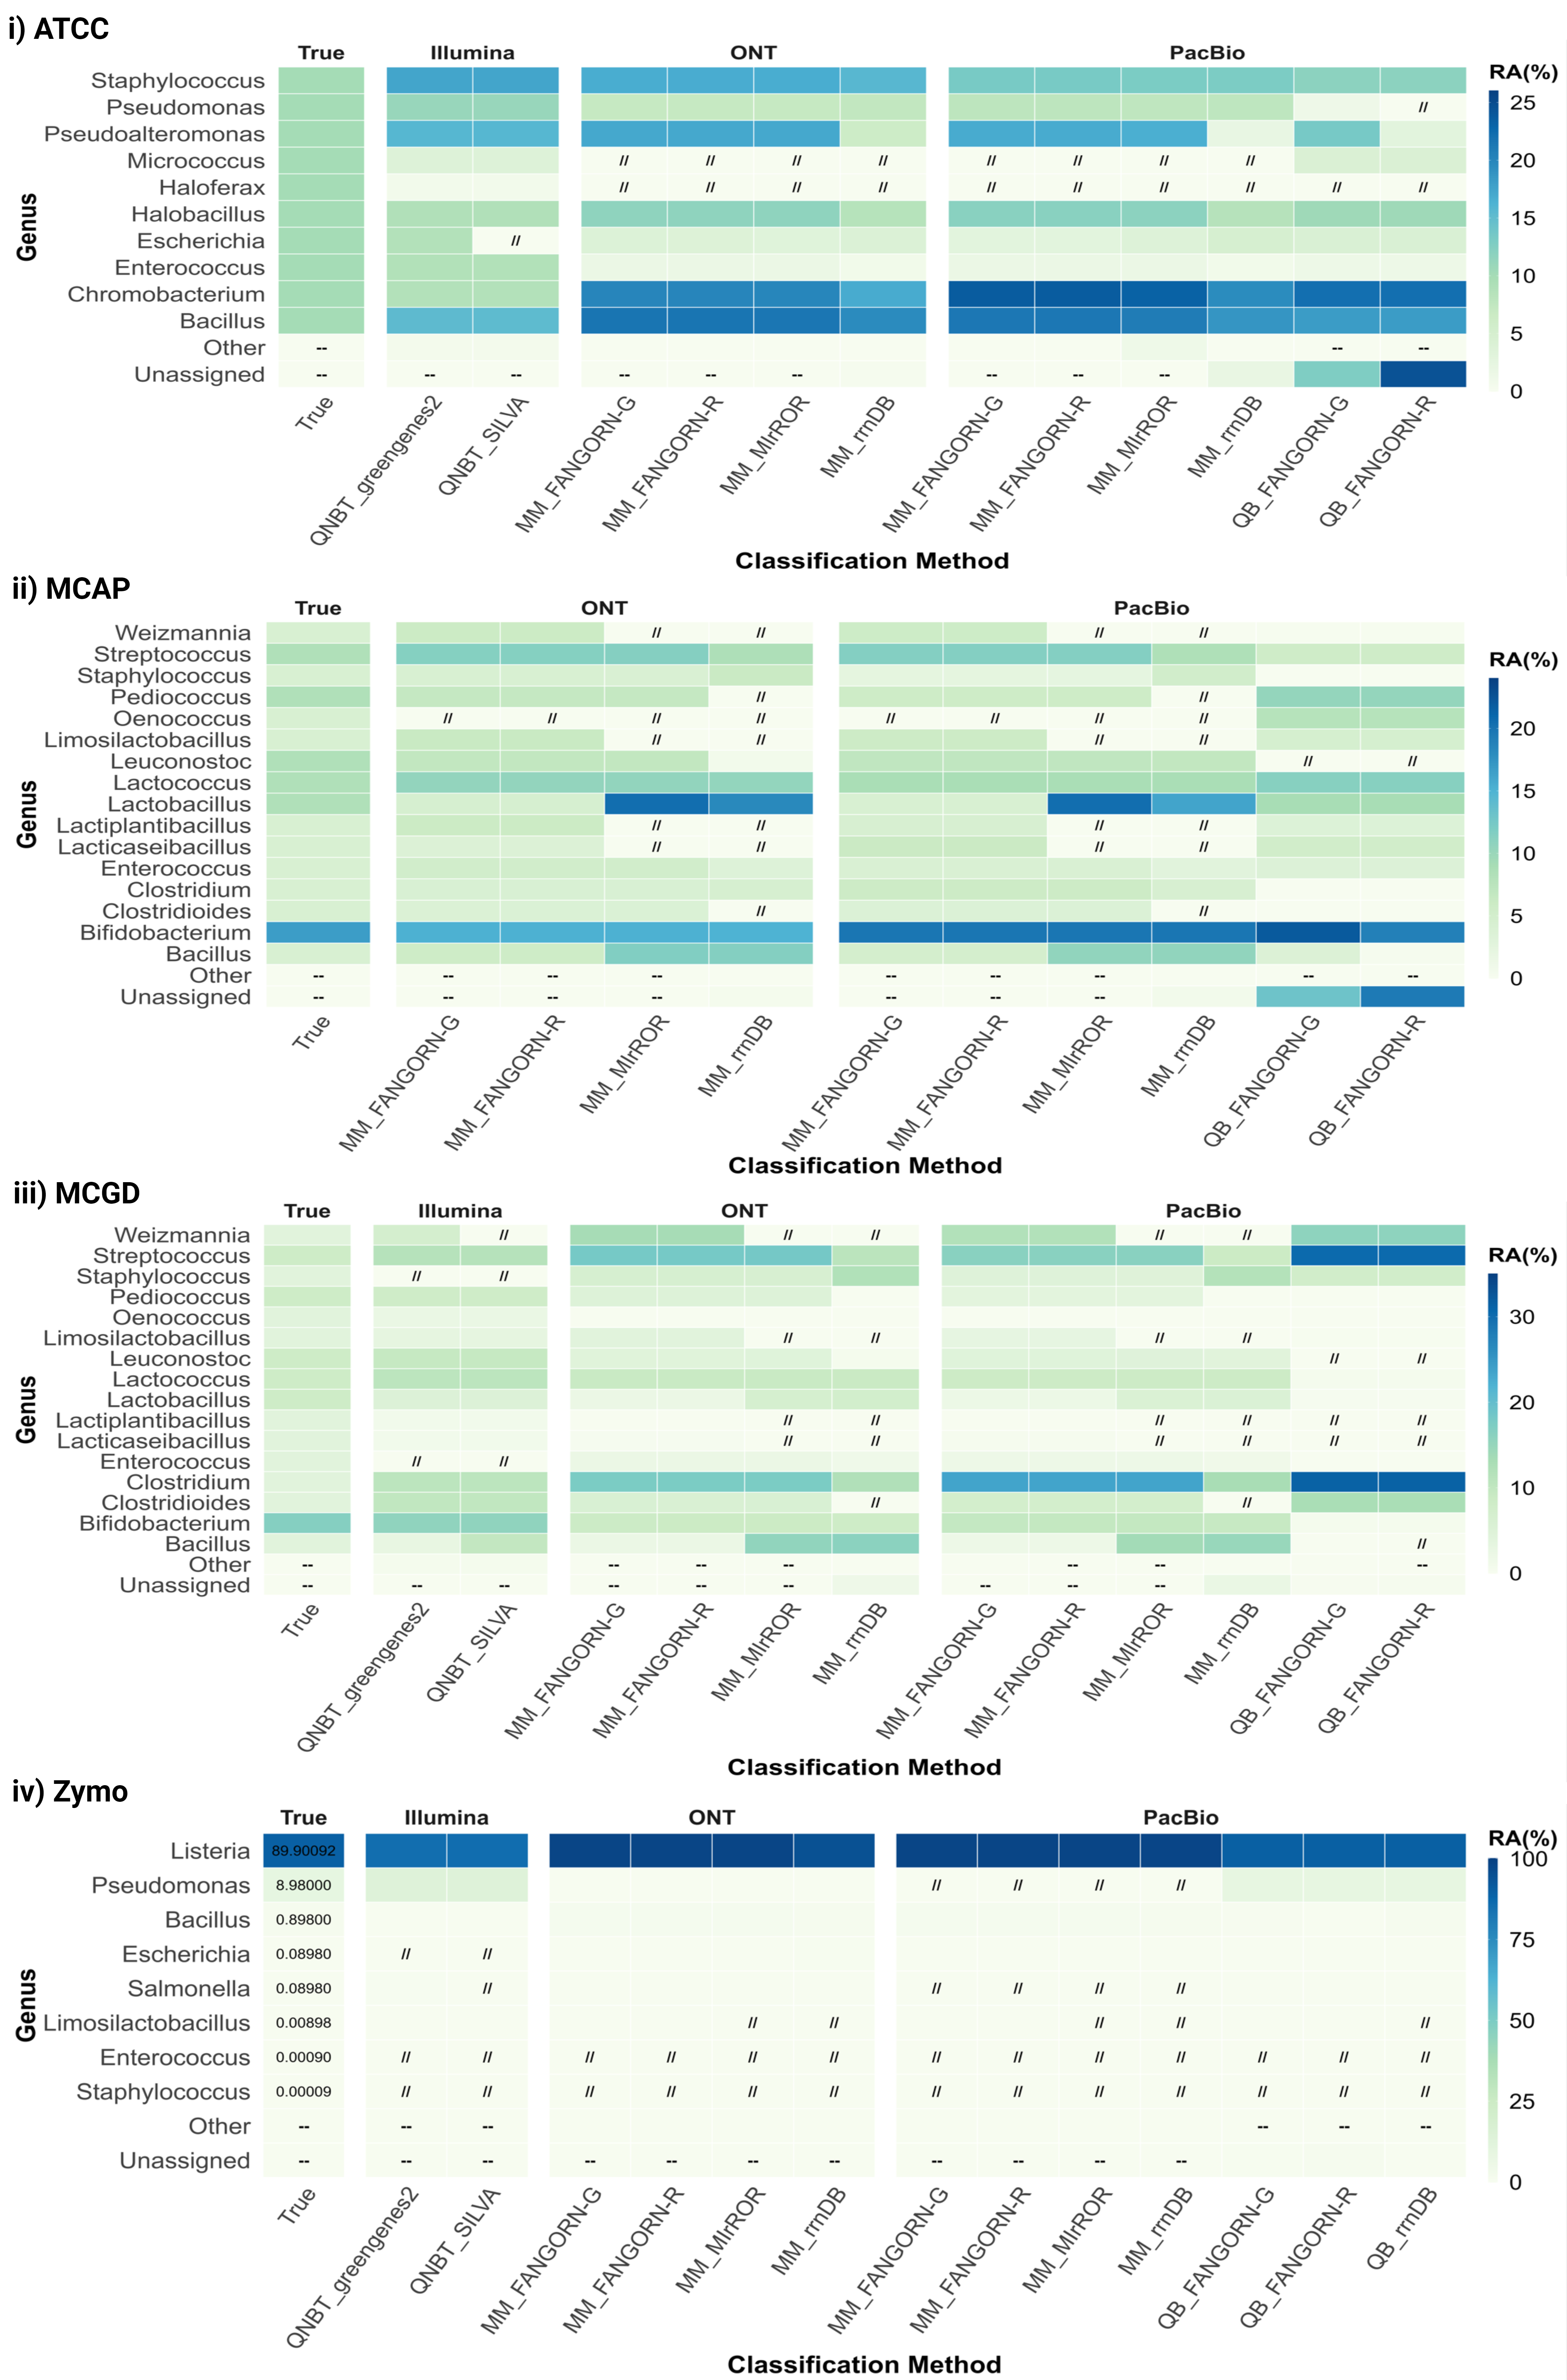
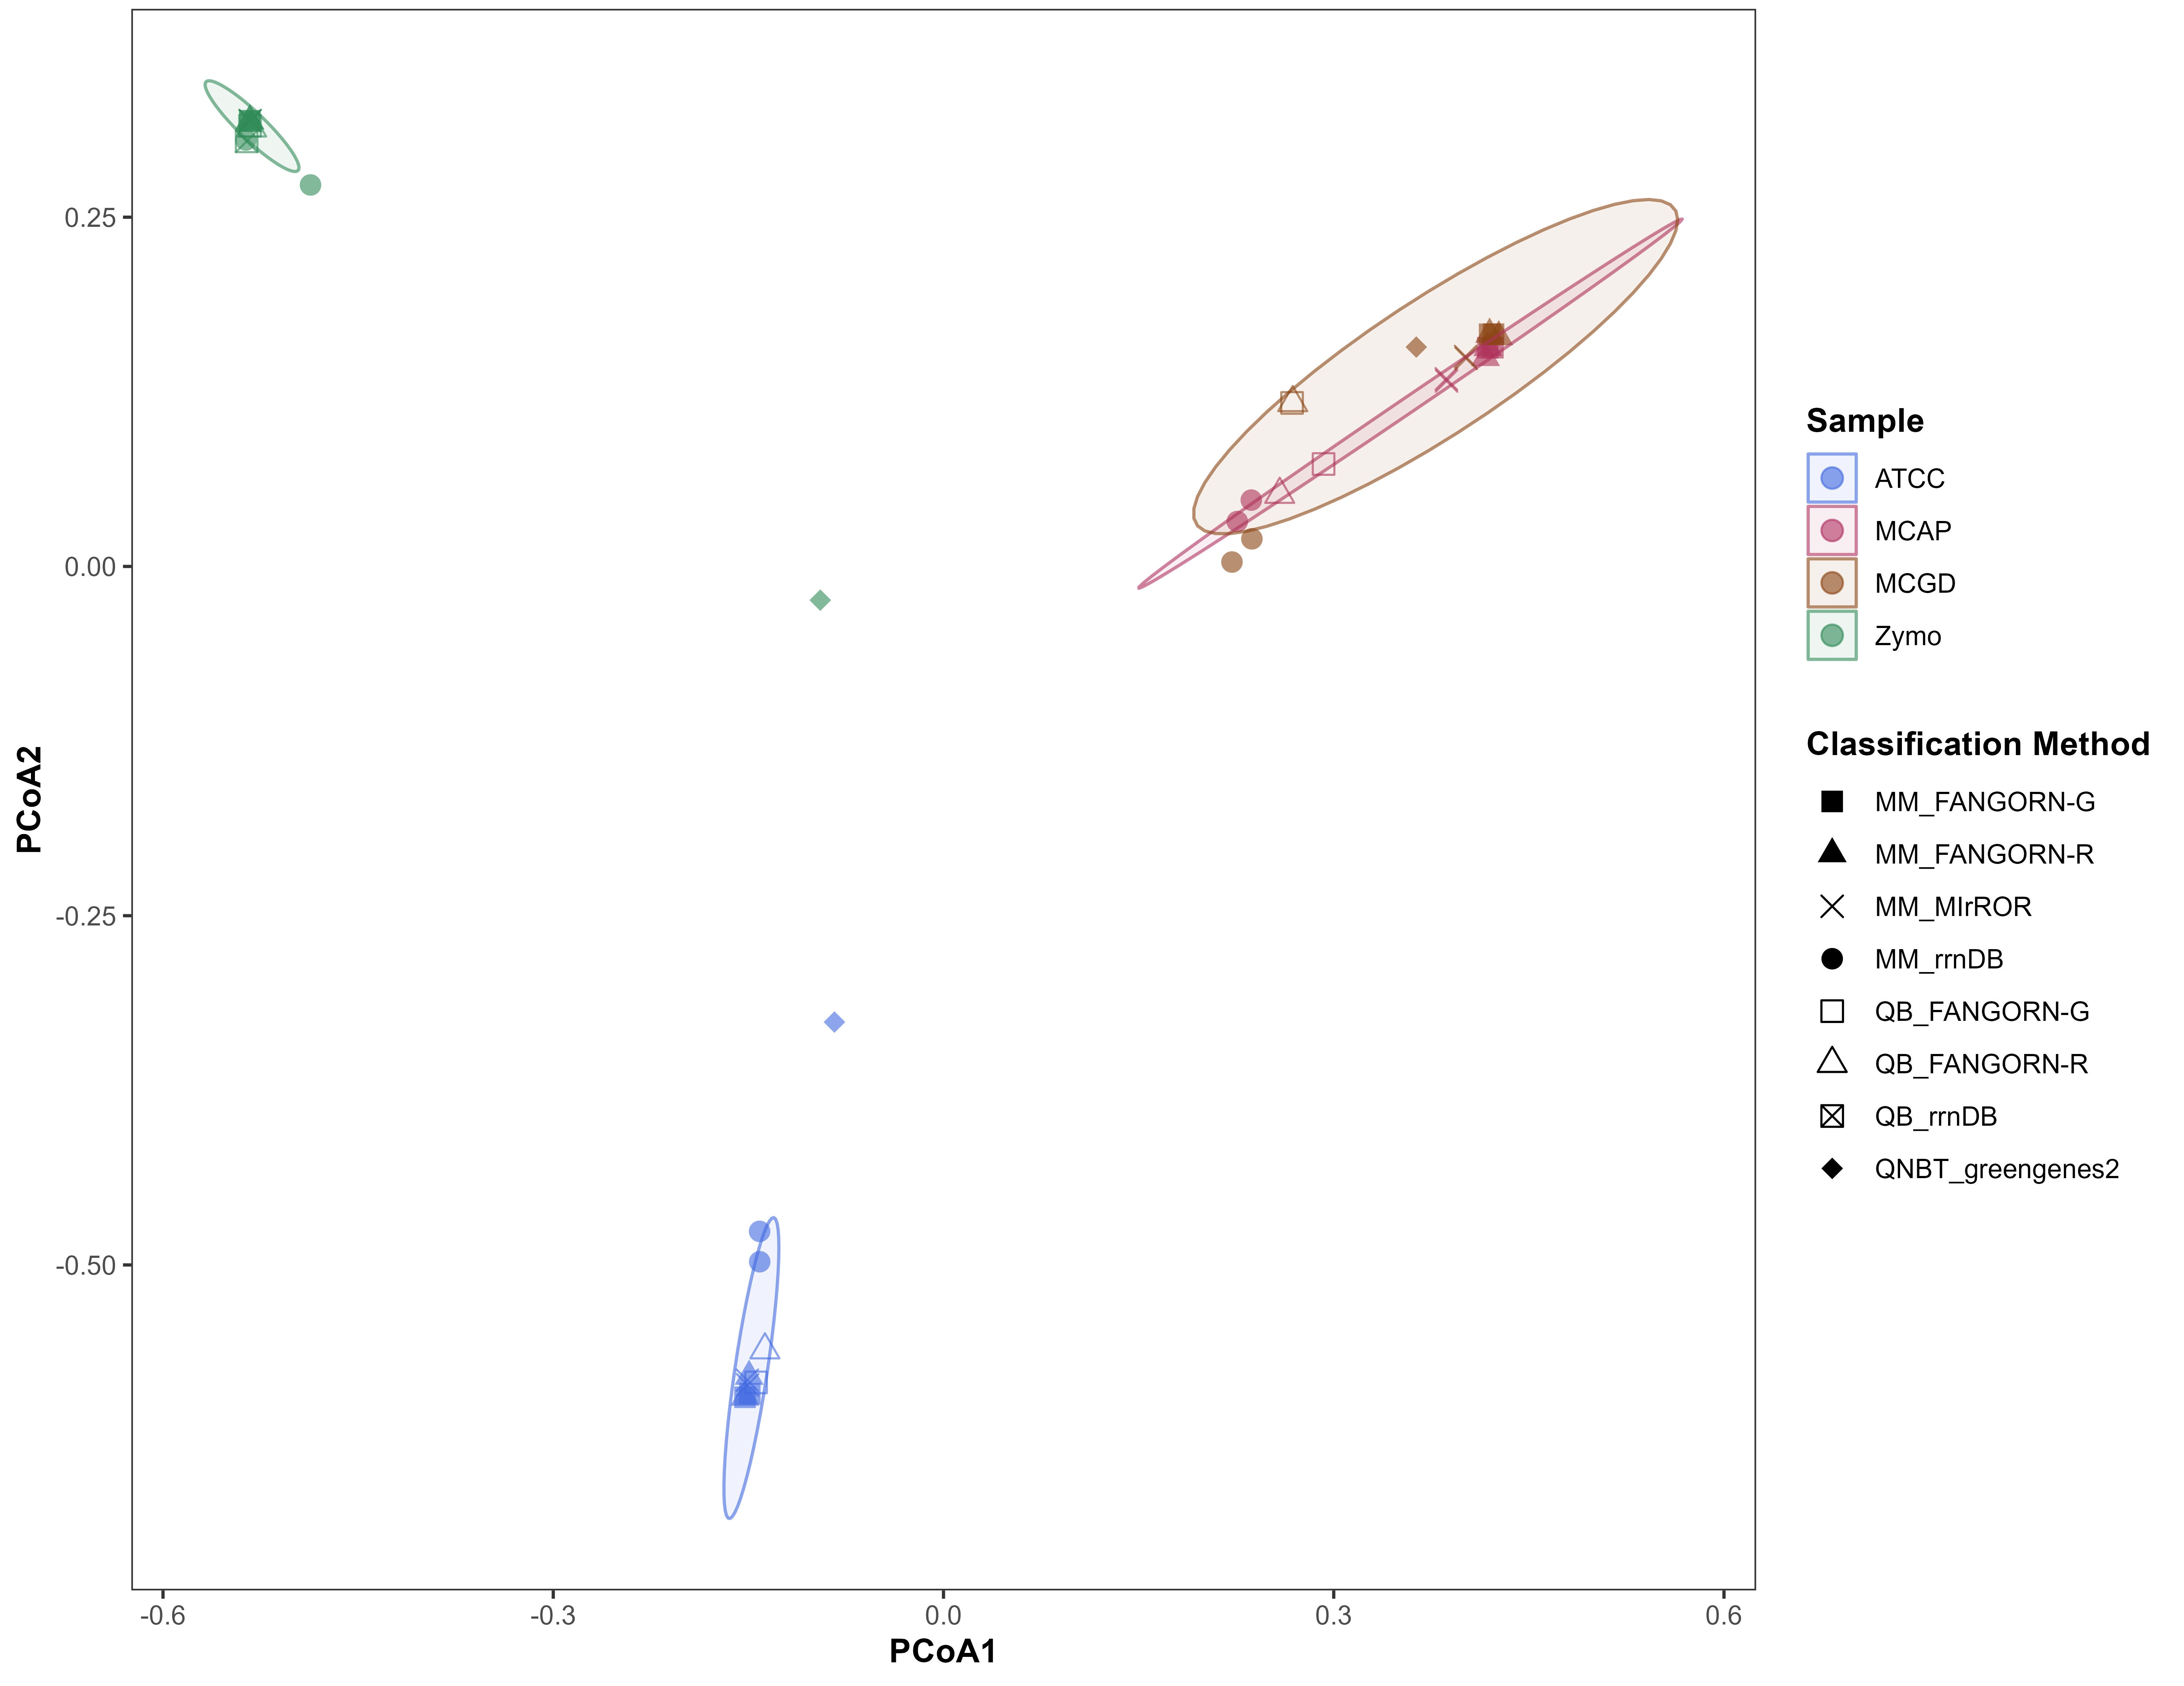
The classification methods included combinations of classifiers and databases (presented as classifier_database from here on). Each of the four RRN databases, FANGORN-G, FANGORN-R, rrnDB, and MIrROR, were applied in combination with the Minimap (MM) classifier for ONT and PacBio RRN amplicon sequencing data. Of the three QIIME-based classifiers applied in combination with three of the four RRN databases, FANGORN-G, FANGORN-R, and rrnDB, only the QIIME-BLAST classifier was selected for further analysis of the PacBio RRN data at species and genus levels. While all three QIIME-based classifiers provided taxonomic profiles similar to the expected community (Supplementary Table 5), the QIIME-NB trained (QNBT) and QIIME-VSEARCH exact match + sklearn (QVPSK) classifiers were excluded from further analysis as they were observed to perform inconsistently even within the same mock community, cluster further away from the expected community (Supplementary Fig. 1), and report a higher number of unassigned taxa at the species level (Supplementary Fig. 2). The classification methods applied for the v3-v4 Illumina data included the QIIME-NB trained (QNBT) classifier with the Greengenes2 database at species and genus levels and the QIIME-NB trained (QNBT) classifier with the SILVA v138.1 database for genus level taxonomic assignments. OTU clustering thresholds of 99% and 97% were applied for species and genus level assignments respectively, for the v3-v4 data.
Statistical analysis
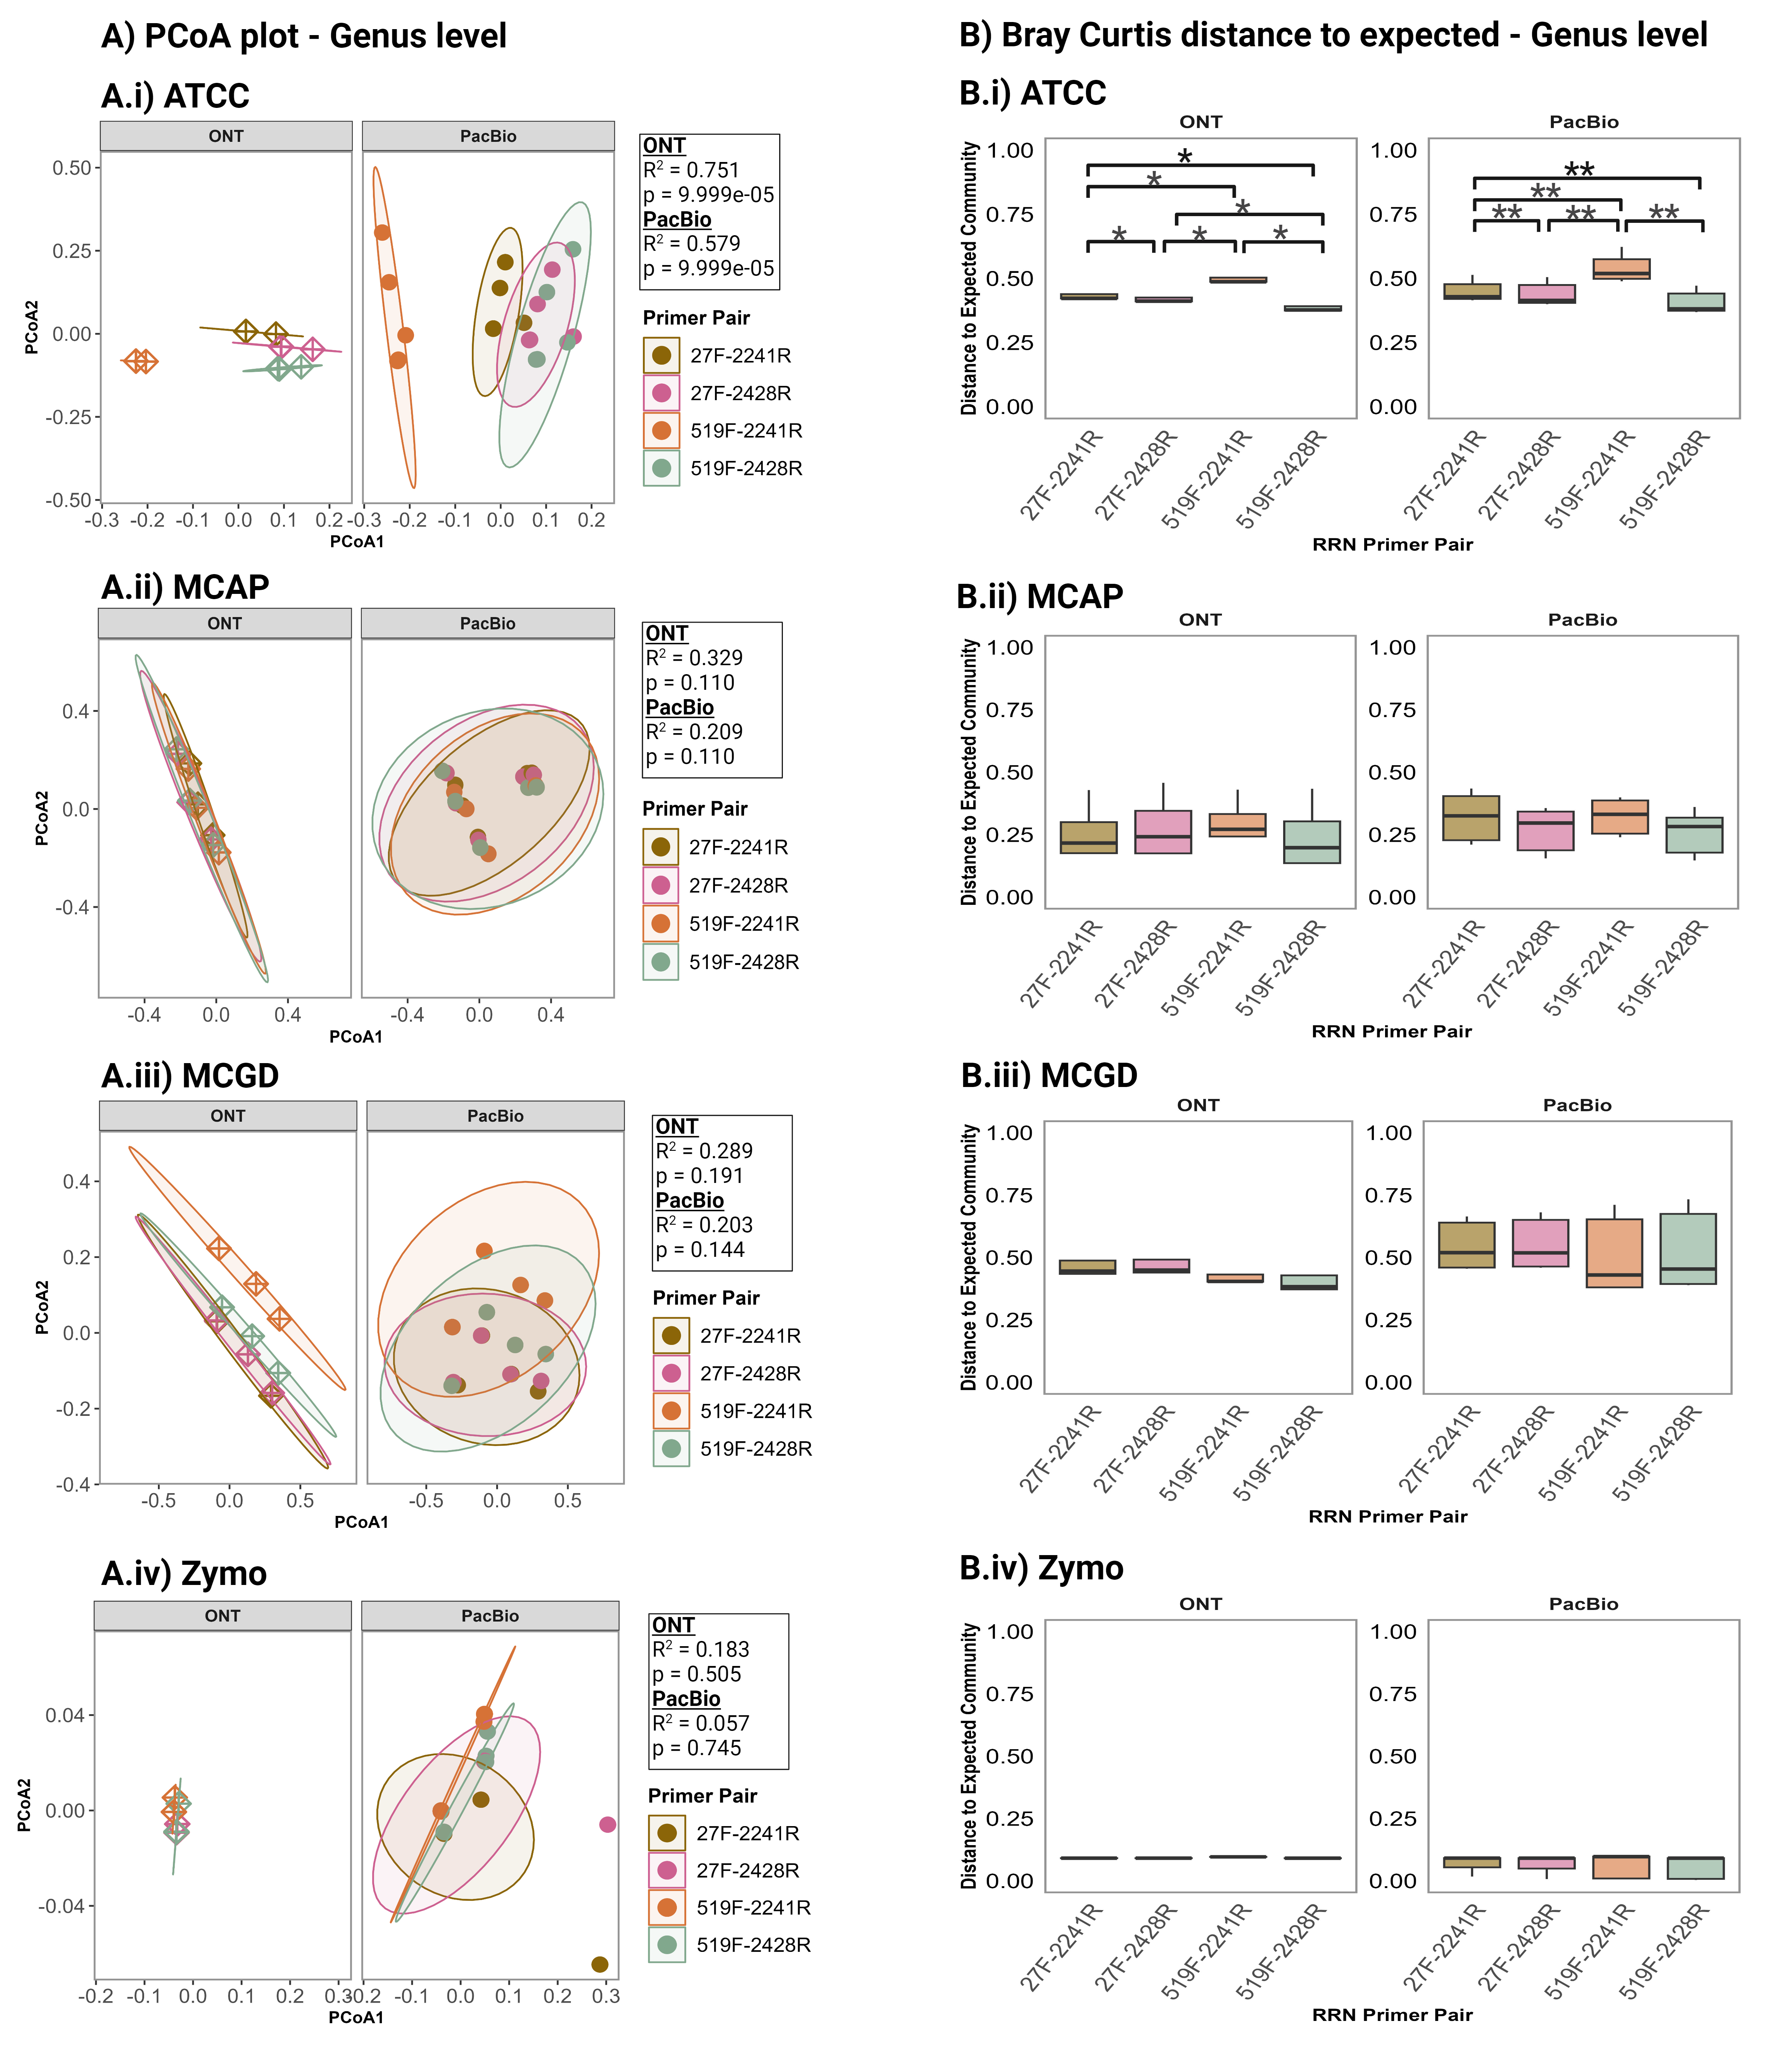
Statistical analysis was performed in R v.4.1.2. The vegan package v. 2.6.4 [66] was used for Bray-Curtis Dissimilarity calculations and for PERMANOVA (permutational analysis of variance) analysis using the adonis function specifying 10,000 permutations. The stats package v. 4.1.2 in R was used for Classical Multidimensional Scaling and for the pairwise Wilcoxon test to identify significant differences. P values were adjusted using the Benjamini-Hochberg method and significance was accepted as p ≤ 0.05. The ggplot2 package v. 3.4.2 [67] was used for data visualisation.
Accuracy metrics
The accuracy of microbial taxa detection at both genus and species levels, in terms of their presence or absence, was evaluated using three metrics: precision, recall, and F1 scores. The R package yardstick v. 1.1.0 was used for these calculations. Precision measures the proportion of correctly identified true positives in relation to all claimed true positives. Recall, on the other hand, indicates the percentage of actual positives in the sample that were successfully detected by the classification methods. The F1 score, serving as a balance between precision and recall, is the harmonic mean of these two metrics. These three metrics were calculated in the following manner:
$$Precision=\frac{True Positives}{True Positives + False Positives}$$
$$Recall=\frac{True Positives}{True Positives + False Negatives}$$
$$F1 score=2\frac{Precision . Recall}{Precision + Recall}$$