In this section, proton transport through a CNTS is considered as transport channel from one end to the other end. A segment of (5,0) CNT is employed as proton transport channel, where C-C bond lengths and angles are frozen to their experimental values as 1.41 Å and 120°, respectively, to impose D5d point group symmetry. To saturate the CNTS’ ends, dangling hydrogens are used for terminal carbon atoms. Figure 1 display the CNTS, consisting of 30 carbon and 10 terminal hydrogen atoms as C30H10. In order to find intermediates and transition state species, the principal axis of CNTS is chosen as z, and z-coordinate of the proton is scanned from outside of the CNTS to the middle, while x- and y-coordinates are relaxed. Figure 2 displays initial geometry of the proton outside of the CNTS.
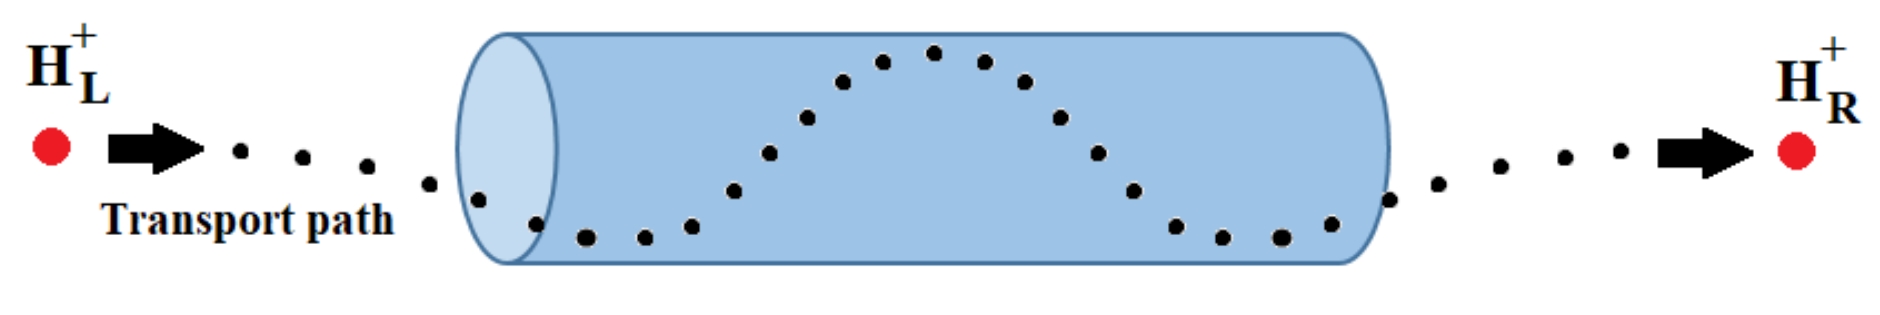
Figure 3 displays a schematic trajectory as transport path (dotted line) of a proton (red circle) through the CNTS (blue tube), where \({\text{H}}^{+}\) moves from left to right as \({\text{H}}_{\text{L}}^{+}\) and \({\text{H}}_{\text{R}}^{+}\), respectively. Since the proton can be adsorbed to the interior wall of CNTS, a curvy path is taken into account to include proton-CNTS interaction through its path.
As this graph shows, different area with respect to distances to the interior wall, correspond to minima, transition states, and maxima in the energy diagram. Figure 4 depicts visual trajectory of proton transport through the CNTS in three different views, where blue and red colors denote minima, and maxima, respectively, and Fig. 5 displays electronic energy diagram of the proton-CNTS system versus z-coordinate of the proton as transport coordinate that reflects proton transport progress. For the sake of simplicity, electronic energies of the species are reported relative to energies of proton outside the CNTS in Fig. 5. Also, symmetry of the overall system, imposes symmetry to the energy diagram in Fig. 5 in which minima and maxima are mirror images.
According to Figs. 4 and 5, the proton establishes a local minimum complex at the entrance of CNTS and is the most stable structure among intermediates, while product possesses the same energy by symmetry. The energy diagram in Fig. 5 obviously predicts a 3-step transport that can be considered as a consecutive reaction. Table 1 includes barrier energies and Gibbs free energy differences (\({E}_{\text{B}\text{a}\text{r}\text{r}\text{i}\text{e}\text{r}}\), \({\varDelta G}^{‡}\)) for the three steps.
Table 1
Barrier energy (\({E}_{\text{B}\text{a}\text{r}\text{r}\text{i}\text{e}\text{r}}\)) and Gibbs free energy change for transition state (\({\varDelta G}^{‡}\)) in kcal/mol.
| Step | 1 | 2 | 3 |
| \({E}_{\text{B}\text{a}\text{r}\text{r}\text{i}\text{e}\text{r}}\) | 34.70 | 13.48 | 13.17 |
| \({\varDelta G}^{‡}\) | 32.18 | 12.29 | 12.11 |
As Fig. 5 and barrier energies in Table 1 show, the first step as entrance of proton to the CNTS possesses highest barrier compares to the other two steps.
Summary and concluding remarks
Segments of carbon nanotubes can be used as proton transport channel in fuel cell technology. In the present work, two rings of zigzag (5,0) CNT is considered as the CNTS and presence of proton is considered outside and inside the CNTS. It has been shown how proton can be absorbed to the interior walls of the CNTS and the corresponding to minimum and maximum structures with respect to their energies. Barrier and Gibbs free energies of the specie are also calculated to show energy profile of proton transport through the CNTS channel.