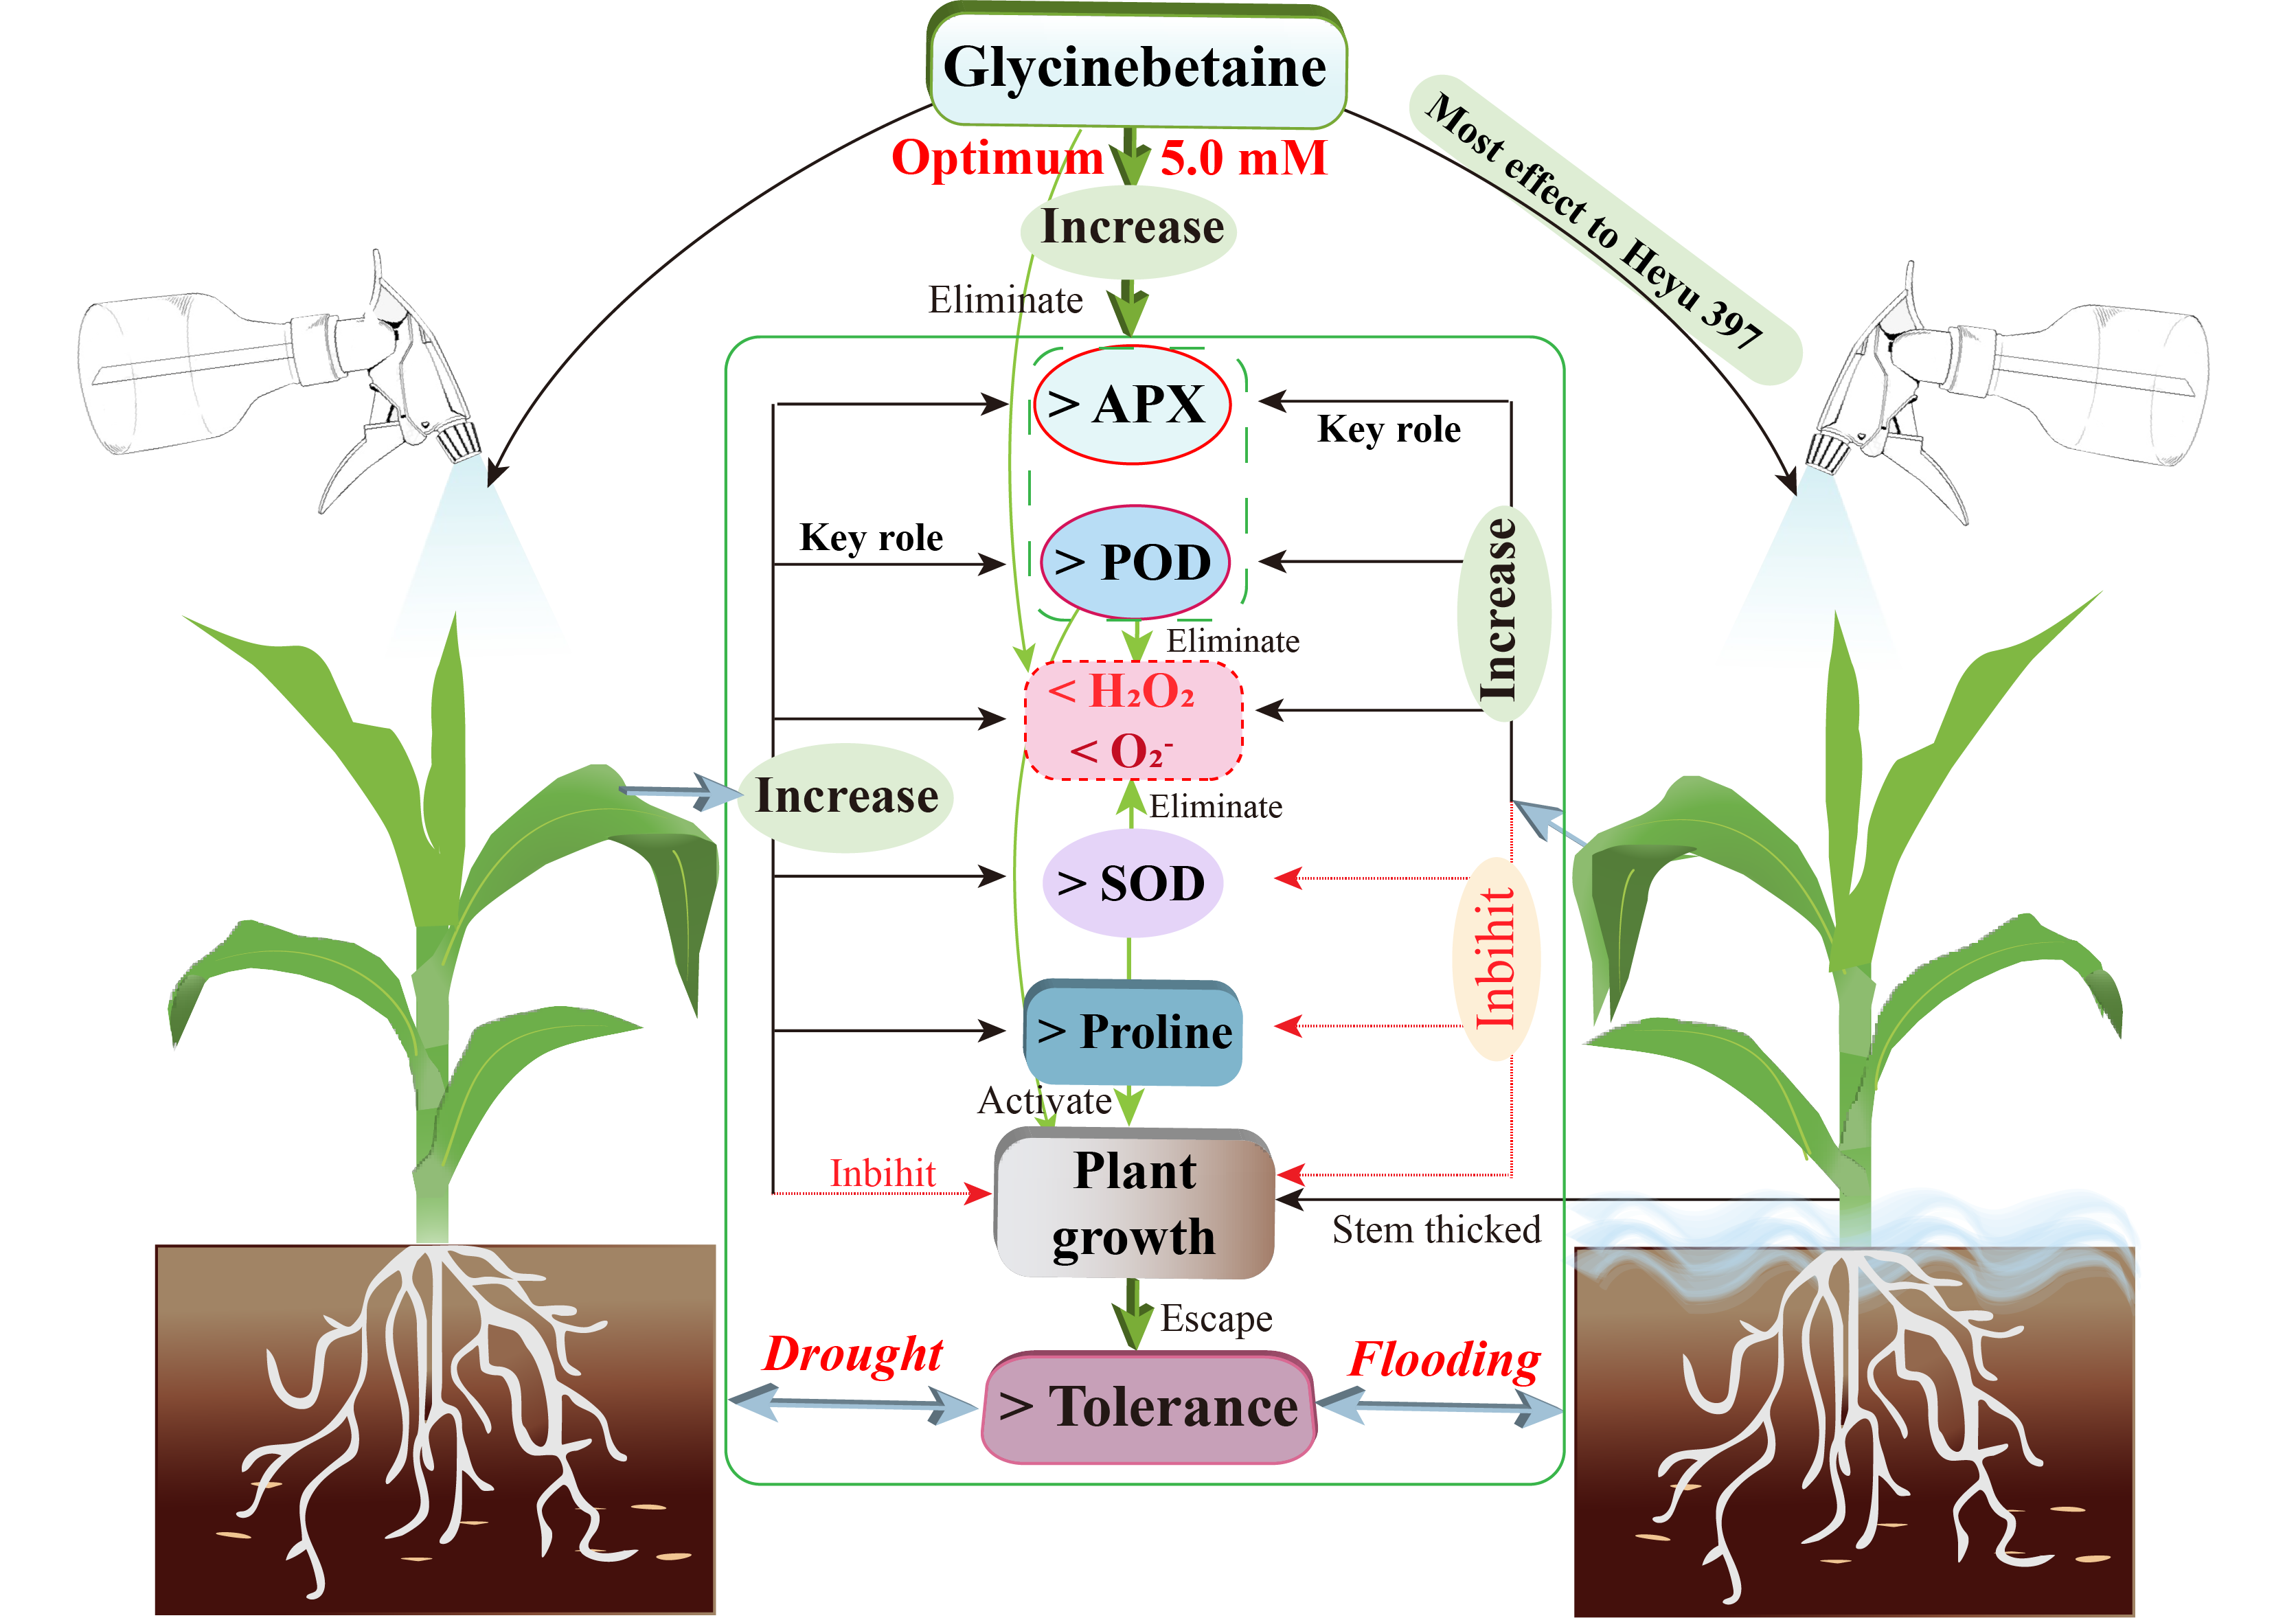
Glycinebetaine reduced the accumulation of reactive oxygen species under water stress
Without the influence of GB, prolonged WS and growth stage resulted in a marked increase in O2− content but a decrease in H2O2 content. (Fig. 1). After 8 d, the CK without GB had reduced H2O2 content by 25.52%, while increased O2− content by 47.99% compared with those after 4 d. Yindieyu 9 accumulated more H2O2 content and less O2− content under WS, but showed less increment ratio in H2O2 (65.00%) compared with Heyu 397 (140.83%) without GB. In addition, the H2O2 and O2− contents under flooding without GB were severally ~ 1.42 fold and ~ 1.15 fold as compared with those under drought after 8-d stress. The accumulation of ROS was significantly affected not only by WS but also by GB and the interaction between them (P < 0.01). The generation of ROS in all treatments was first attenuated and then rose with an increase in the concentration of GB. Although ROS in CK under high dosage of GB was increased, CK still exhibited lower levels of ROS compared with WS, in which the lowest H2O2 in CK from 4 d to 8 d was detected in GB1 to GB1 in Heyu 397 and GB1 to GB2 in Yindieyu 9, correspondingly for O2− was GB1 to GB1 and GB3 to GB2, indicating Heyu 397 under CK with low ROS required less GB than Yindieyu 9, and GB wasn’t changed for total ROS with growth duration. Meanwhile, the ROS under WS was significantly reduced by GB (P < 0.05), and under the effect of GB, the ROS under flooding was still higher than that under drought. The optimum dosage of GB for ROS after 8-d stress was detected in GB3. Meanwhile, more GB (~ 5.0 to 10.0 mM), especially for Heyu 397, was needed under the progressive WS to decrease O2− content. After 8 d, compared with GB0, GB promoted H2O2 content by 18.55%, -46.47%, and − 31.57% under CK, flooding, and drought in variety Heyu 397, respectively, and correspondingly, by 11.34%, -11.72%, and − 13.52% in variety Yindieyu 9. At the same time, there were increments in O2− content under CK, flooding, and drought in variety Heyu 397 by 0.74%, -12.21%, -5.15%, respectively, as well as in Yindieyu 9 by 11.32%, -12.05%, -1.84%, respectively. As a result, GB was more beneficial in attenuating the accumulation of ROS under flooding, especially for Heyu 397.
Gglycinebetaine was more beneficial in improving SOD activity under flooding stress
The interaction of either WS or variety with GB significantly affected SOD activity (Fig. 2, P < 0.01). Compared with that after 4 d, under CK, flooding and drought, the SOD activity without GB after 8 d in Heyu 397 was decreased by 13.24%, 2.24%, and 0.87%, respectively, and in Yindieyu 9 was increased by 1.16%, 27.21%, and − 8.99%, respectively. When maize seedlings were exposed to WS, SOD activity exhibited a significant decrease under flooding, while an increase under drought, compared with CK. The GB played a significant role in improving SOD activity in all treatments (P < 0.001). After 8 d, under the effect of GB, drought still had a significantly higher SOD activity than flooding and CK (P < 0.05), while a lower SOD activity was under flooding compared with CK. The SOD activity first increased and then descended in response to the increase in concentration of GB. Where, the greatest increment in SOD activity was discovered in GB3 under flooding and drought in Heyu 397, GB3 (after 4 d), and GB2 (after 8 d) in Yindieyu 9, and GB2 in CK in both varieties. After 8 d, Yindieyu 9 exhibited a higher SOD activity than Heyu 397 under WS and CK, particularly under flooding, but the high SOD activity in Yindieyu 9 under drought was unaffected by GB. After 8 d, compared with GB0, under CK, flooding, and drought, SOD activity under the effect of GB increased in Heyu 397 by 11.24%, 14.21%, and 3.57%, respectively, and correspondingly, in Yindieyu 9 by 5.38%, 0.55%, and 4.51%, respectively. As a consequence, GB was more beneficial in improving the SOD activity of Heyu 397 under flooding.
Glycinebetaine enhanced the POD activity under water stress
From after 4 d to 8 d, in the absence of GB, the POD activities under CK, drought, and flooding declined in Heyu 397 by 31.97%, 31.27%, and 27.32%, respectively, and correspondingly, in Yindieyu 9 by 8.50%, 4.69%, 17.78%, respectively (Fig. 3). After 8 d, compared with CK in the absence of GB, WS greatly improved POD activity, especially drought stress that increased the POD activity by 22.62% in Heyu 397 and 25.30% in Yindieyu 9. After 8 d, Heyu 397 showed significantly higher POD activity under drought than under flooding and CK (P < 0.05), while Yindieyu 9 had no significant difference in the POD activity between drought and flooding (P > 0.01). Moreover, Yindieyu 9 had higher POD activity than Heyu 397 (P < 0.05). Foliar application of GB significantly increased POD activity no matter what the water conditions applied (P < 0.01), where the rank for POD activity from high to low was drought, flooding, and CK in Heyu 397, and flooding, drought, and CK in Yindieyu 9 after 8 d. The POD activity was first significantly improved and then declined with the increase in the concentration of GB (P < 0.01), revealing that a high concentration of GB (GB4) inhibited the infinite increase of POD activity, but still improved the POD activity compared with CK. After 4 d, the highest POD activity was observed in GB3 in all treatments, except for GB2 in CK of Yindieyu 9. Nevertheless, after 8 d, the highest POD activity was observed in GB2 under CK and drought, in GB4 under flooding in Heyu 397, and correspondingly in GB1 under CK and drought, and GB3 under flooding in Yindeyu 9. After 8 d, compared with GB0, the POD activities under CK, drought, and flooding were increased by the foliar GB by 24.02%, 32.56%, 29.64% in Heyu 397, respectively, and by 14.62%, 27.58%, and 6.25% in Yindeyu 9, respectively. Results indicated that GB contributed more POD activity towards flooding as well as Heyu 397 than Yindieyu 9.
Glycinebetaine improved the APX activity under water stress
Prolonged WS and growth stage induced an obvious rise in APX activity (Fig. 4). Compared with after 4 d, APX activities after 8-d stress under CK, drought, and flooding were increased by 36.21%, 45.19%, and 57.74% in Heyu 397, respectively, and 63.20%, 56.97%, and 51.29% in Yindieyu 9, respectively. Yindieyu 9 accumulated higher APX activity under flooding relative to drought, in the absence of GB, after 8 d. In contrast to Yindieyu 9, Heyu 397 displayed lower APX activity under WS and CK and maintained higher APX activity under drought than under flooding. Nevertheless, there was no significant difference between drought and flooding treatments in APX for plants (P > 0.05). Water stress and GB significantly affected APX activity (P < 0.01), but the interaction between the two factors had no obvious effect on APX activity (P > 0.05). Throughout the whole period of treatment for Heyu 397, the highest APX activity was found in GB3 which was similar to that in GB2 under CK, and in GB3 under WS, those all were significantly higher than in other concentrations of GB (P < 0.05). Meanwhile, in Yindieyu 9, the highest APX activity was detected in GB1 under CK and in GB3 under WS, but there was no significant difference between treatments with GB after 8 d (P > 0.05). It was also revealed that Yindieyu 9 under the effect of GB still had significantly higher APX activity than Heyu 397 after 8 d (P < 0.01). Although a low dosage of GB was suitable for CK, high GB still improved the APX activity compared with the treatments without GB, and so did under WS. After 8 d, compared with GB0, GB was more beneficial to improving APX activity under flooding in Heyu 397 which about a 10.53% increment, and under drought in Yindieyu 9 by 13.33%.
Lower dosage of GB increased the proline content under water stress
Proline content steadily declined with the progression of WS and growth. Proline content of Yindieyu 9 showed a higher reduction from after 4 d to 8 d compared with Heyu 397. Furthermore, proline content without GB after 8-d stress significantly decreased under flooding and significantly increased under drought (∼7-fold as compared with CK) (Table 1, P < 0.01). Yindieyu 9 accumulated less proline content than Heyu 397 in the absence of GB. Although GB significantly promoted the proline content under WS (P < 0.01), high concentrations of GB had adverse effects on maize seedlings under CK, because proline content declined under CK after 8 d. With prolonged WS, maize’s growth needed more and more GB to pronounce more proline. There was no significant difference in proline content induced by GB between flooding and CK (P > 0.05), which were all lower than drought. Proline content promoted by GB was significantly higher in Heyu 397 in comparison with Yindieyu 9. The proline content was enhanced most by GB2 under CK, GB1 under flooding, and GB3 under drought in Heyu 397, correspondingly by GB2, GB2, and GB1 in Yindieyu 9 after 4-d stress. After 8 d, the highest increment in proline content under WS at the effect of GB was detected in GB3, of which the average increment was 11.74% under flooding 136.95% under drought in Heyu 397, and 11.93% under flooding 99.68% under drought in Yindieyu 9. Consequently, GB contributed more proline content towards Heyu 397, especially for treatments under drought.
Table 1
The effect of exogenous glycinebetaine (GB) on the proline content (µg/g FW) of maize seedlings under water stress.
| Water stress/ GB (mM) | After 4 d of treatment | After 8 d of treatment |
| Heyu 397 | Yindieyu 9 | Heyu 397 | Yindieyu 9 |
| CK | 0 | 514.03 ± 53.28d | 516.97 ± 32.46b | 433.06 ± 48.68a | 351.74 ± 59.51a |
| 0.5 | 773.46 ± 13.20bc | 484.00 ± 29.75b | 312.15 ± 19.12bc | 264.64 ± 39.26b |
| 1.0 | 914.96 ± 5.76a | 658.77 ± 22.34a | 333.71 ± 10.26b | 257.60 ± 31.10b |
| 5.0 | 731.70 ± 20.56c | 636.56 ± 49.11a | 286.30 ± 2.85c | 263.65 ± 35.82b |
| 10.0 | 805.06 ± 52.51b | 496.00 ± 15.93b | 285.09 ± 11.78c | 218.50 ± 22.50b |
| Flooding | 0 | 450.08 ± 51.47b | 483.93 ± 2.55c | 315.87 ± 44.52bc | 271.27 ± 1.07b |
| 0.5 | 765.04 ± 90.03a | 310.40 ± 24.91d | 289.94 ± 14.43c | 290.44 ± 28.11b |
| 1.0 | 408.71 ± 5.24b | 868.75 ± 49.61a | 353.37 ± 17.67b | 285.66 ± 2.24b |
| 5.0 | 359.11 ± 23.79bc | 567.70 ± 44.73b | 424.42 ± 3.39a | 333.84 ± 8.23a |
| 10.0 | 296.97 ± 51.38c | 495.31 ± 49.33c | 344.03 ± 46.18bc | 295.52 ± 15.18b |
| Drought | 0 | 1545.92 ± 175.38d | 1472.65 ± 13.69c | 1128.34 ± 42.66d | 1109.00 ± 28.02e |
| 0.5 | 1661.98 ± 37.12cd | 2875.10 ± 65.66a | 2477.36 ± 225.42b | 1963.93 ± 35.93c |
| 1.0 | 1863.65 ± 13.49c | 1367.66 ± 20.64d | 2450.63 ± 41.92b | 2378.21 ± 72.96b |
| 5.0 | 2708.21 ± 108.50a | 1729.74 ± 74.63b | 3904.41 ± 33.75a | 2694.72 ± 58.82a |
| 10.0 | 2240.05 ± 195.17b | 1244.03 ± 30.90e | 1861.99 ± 12.24c | 1821.16 ± 70.37d |
| Source of Variation | P > F |
| Variety | < 0.0001 | < 0.0001 |
| Water | < 0.0001 | < 0.0001 |
| GB | < 0.0001 | < 0.0001 |
| Variety × Water | < 0.0001 | < 0.0001 |
| Variety × GB | < 0.0001 | < 0.0001 |
| Water × GB | < 0.0001 | < 0.0001 |
| Variety × Water × GB | < 0.0001 | < 0.0001 |
| CK represents crops planted in the well-watered condition. FW is the fresh weight. Data are shown as the means ± standard deviation (n = 3, biological replicates). Different letters in a water treatment indicate the least significant differences according to P value ≤ 0.05 |
Glycinebetaine promoted the growth of maize seedlings under water stress
From after 4 d to 8 d, LA, and stem diameter in the absence of GB under flooding existed more increment than under drought, while plant height showed the exact opposite trend. Although there was no difference in the average increment between Yindieyu 9 and Heyu 7 under drought, a higher average increment occurred under flooding in Yindieyu 9 than in Heyu 397. Meanwhile, after 8 d, maize growth was significantly suppressed when subjected to drought in the absence of GB, resulting in smaller LA, thinner stem diameter, and shorter plant height compared with CK (Fig. 5, P < 0.05). By contrast, maize under flooding exhibited a thicker stem diameter, shorter plant height, and smaller LA than CK after 8 d. Although the difference in plant height between drought and flooding was not statistically significant, flooding resulted in higher plant height, stem diameter, and LA than drought in the absence of GB after 8 d (P > 0.05). Meanwhile, Yindieyu 9 maintained a significantly larger stem diameter and LA compared with Heyu 397 (P < 0.05). Foliar application of GB significantly mitigated the adverse effects of WS on maize growth, subsequently promoting crop growth (P < 0.05). With the progression of growth, GB played a more and more effect on LA and plant height, and less effect on stem diameter. However, the difference of morphological indicators affected by GB in WS and variety was similar to that without GB after 8 d. The morphological indicators were first increased and then reduced with an increase in GB concentration in all treatments. However, under the effect of GB, all morphological indicators were higher than those in GB0. After 8 d, to promote growth to survive from WS, Yindieyu 9 (GB2) required less GB than Heyu 397 (GB3) to improve stem diameter, while there was similar and optimum dosage of GB that was GB3 required between Yindieyu 9 and Heyu 397 to promote LA and plant height. Under CK, the optimum concentration for maize growth was GB3 after four times foliar application of GB, and other concentrations still maintained higher morphological indicators in comparison with GB0. The GB had the greatest effect on LA, followed by plant height, lowest on stem diameter. Where GB was more beneficial to increasing LA in Heyu 397 under flooding.
Glycinebetaine increased the biomass accumulation of maize seedlings under water stress
Water stress significantly slowed down the overall growth of maize seedlings, particularly in terms of leaf dry matter compared with CK (Fig. 6, P < 0.05). From 4 d to 8 d, under CK, drought, and flooding in the absence of GB, the total dry matter had grown by 78.18%, 19.81%, and 28.76% in Heyu 397, respectively, and 79.46%, 49.93%, 38.55% in Yindieyu 9, respectively, in which leaf dry matter was much more severely reduced by WS especially flooding. Additionally, stem dry matter under flooding in the absence of GB was reduced by 17.65% in Heyu 397 and 4.17% in Yindieyu 9 after 8 d, although not statistically significant between flooding and CK (P > 0.05). Drought also caused a significant reduction in leaf dry matter compared with CK (P < 0.05), which was also lower than flooding. Meanwhile, higher stem biomass was also observed under flooding rather than drought, with no significant difference (P > 0.05). Similarly, Heyu 397 showed significantly lower total biomass than Yindieyu 9 under flooding (P < 0.05), and no statistically significant compared with Yindieyu 9 under drought. The adverse effects of WS on the biomass accumulation of maize seedlings were significantly and steadily reduced with the increase of GB concentration (P < 0.05). The most significant increment in biomass accumulation was observed in GB3 after 4 d, while in GB3 in Heyu 397, and GB2 in Yindieyu 9 after 8 d. Although there was no adverse effect of GB on biomass accumulation of maize seedlings in all treatments, the higher dosage of GB had an inhibitory effect on biomass accumulation. Additionally, GB had contributed more biomass accumulation towards Heyu 397 than Yindieyu 9 especially in terms of leaf dry matter, which showed an increment of 21.95% under drought and 42.71% under flooding in Heyu 397. It also led to a similar dry matter between drought and flooding in Heyu 397, which was significantly lower than Yindieyu 9.
Glycinebetaine improved leaf relative water content under drought stress
Compared with CK, leaf relative water content (RWC) was not significantly altered under flooding (P > 0.05), but was significantly reduced during drought (Table 2, P < 0.01). Under drought without GB, the RWC of Heyu 397 with a decrement of 28.67% was significantly lower than that of Yindieyu 9 (P < 0.05). Foliar application of GB significantly increased RWC under drought by 22.90% in Heyu 397 and 13.23% in Yindieyu 9 (P < 0.05) but had no apparent impact on RWC under flooding and CK (P > 0.05). The most suitable concentration for plants grown under drought was GB3. Whereas, the higher dosage of GB had inhibitory but non-toxic effects on the RWC of maize seedlings.
Table 2
The effect of glycinebetaine (GB) on leaf relative water content (g/g, %) of maize seedlings after eight days of water stress.
| Treatments | Heyu 397 | Yindieyu 9 |
| Concentration (mM) |
| CK | 0 | 95.39 ± 1.98a | 97.12 ± 0.35ab |
| 0.5 | 97.48 ± 0.21a | 96.59 ± 1.60ab |
| 1.0 | 96.80 ± 1.25a | 98.35 ± 1.45a |
| 5.0 | 96.72 ± 1.59a | 96.16 ± 0.79b |
| 10.0 | 96.71 ± 1.89a | 95.65 ± 0.34b |
| Flooding | 0 | 97.13 ± 0.67ab | 95.84 ± 1.94a |
| 0.5 | 95.18 ± 1.80b | 95.79 ± 0.59a |
| 1.0 | 97.44 ± 0.52a | 96.35 ± 0.58a |
| 5.0 | 95.75 ± 0.41ab | 97.23 ± 0.72a |
| 10.0 | 95.44 ± 1.43ab | 97.19 ± 0.63a |
| Drought | 0 | 68.04 ± 1.73c | 71.50 ± 0.53c |
| 0.5 | 80.12 ± 1.64b | 78.26 ± 2.66bc |
| 1.0 | 87.54 ± 0.69a | 80.94 ± 0.57ab |
| 5.0 | 87.10 ± 4.45a | 82.61 ± 2.78a |
| 10.0 | 79.76 ± 1.86b | 82.04 ± 3.62ab |
| Source of Variation | P > F |
| Variety | 0.3565 |
| Water | < 0.0001 |
| GB | < 0.0001 |
| Variety × Water | 0.0987 |
| Variety × GB | 0.0188 |
| Water × GB | < 0.0001 |
| Variety × Water × GB | 0.0005 |
| CK represents crops planted in the well-watered condition. Data are shown as the mean ± standard deviation (n = 3, biological replicates). Different letters in a water treatment indicate the least significant differences according to P value ≤ 0.05 |
Analysis for correlation, stepwise regression, and tolerance
The correlation analysis revealed that the correlations among most of the indicators under WS were similar to those in CK (Fig. 7). However, SOD activity under flooding and proline content under drought showed the opposite correlation with some other indicators compared with CK, whereby either SOD activity under flooding or proline content under drought was positively correlated with morphological parameters and biomass. Additionally, POD activity significantly and positively correlated with SOD activity (P < 0.05). Furthermore, in all treatments, APX activity showed a significant positive correlation with morphological parameters and biomass (P < 0.05). Leaf area, plant height, stem diameter, and dry matter were significantly and positively correlated with each other (P < 0.05). It was APX activity under flooding, POD under drought, and plant height under both stresses that screened out by the stepwise regression analysis were the critical and representative indicators for leaf dry matter, which could determine a relatively high mean forecast accuracy of more than 80% (Table 3). Finally, D value, as an important indicator to evaluate water tolerance, was detected to be the highest in CK, followed by drought, and flooding (Table 4). The tolerance coefficient in a variety was more than 1.0 under drought, while lower than 1.0 under flooding. Yindieyu 9 had a higher tolerance to flooding and drought than Heyu 397, and its tolerance to flooding was ~ 3.17 fold as compared with Heyu 397 based on the D value.
Table 3
The stepwise regression analysis for eight indicators with leaf dry matter (LDM).
| Water stress | Models | R2 | F | P > F |
| Flooding | LDM1 = -0.858 + 0.071XAPX + 0.014XPH | 0.91 | 89.03 | < 0.001 |
| Drought | LDM2 = -0.504–0.051XPOD + 0.022XPH | 0.80 | 32.35 | < 0.001 |
| POD, APX, and PH represent peroxidase, ascorbate peroxidase, and plant height. |
Table 4
Analysis for tolerance after 8 d based on comprehensive evaluation (D) value and tolerance coefficient.
| Varieties | Water Stress | D value | Tolerance coefficient |
| Heyu 397 | CK | 0.53 | - |
| Flooding | 0.10 | 0.82 |
| Drought | 0.48 | 1.07 |
| Yindieyu 9 | CK | 0.59 | - |
| Flooding | 0.40 | 0.93 |
| Drought | 0.50 | 1.12 |
| CK represents crops planted in the well-watered condition. |